Application of Multivariate Statistics and Geostatistical Techniques to Identify the Distribution Modes of the Co, Ni, As and Au-Ag ore in the Bou Azzer-East Deposits (Central Anti-Atlas Morocco)
19
0
0
전체 글
(2) 364. Muhammad Souiri et al.. and quartz diorite. The thickness of the mineralized structures varies from a few centimeters to a few meters. Mining activities are presently managed by the Tifnout Tiranimine Company (CTT), which is a daughter company within the larger MANAGEM mining group. The objectives of this paper are i) to define the distribution modes of the Co, Ni, Fe arsenides and Au-Ag mineralizations in the Bou Azzer East deposit; ii) to determine the mineralogical supports of the Au-Ag precious metals to deduce potential metallotectes for their valorization. This is carried out through the mineralogical study, statistical and geostatistical analyses.. 2. Geological Setting 2.1. Regional geology The Bou Azzer–El Graara inlier is located in the central part of the Anti–Atlas belt in the south of Morocco. It corresponds to Pan–African orogenic belt as we can see in Fig. 1. This inlier is located along an E–W trending fault zone that forms the northern boundary of the West African craton (Leblanc, 1981). The Precambrian basement rock outcrops under an infracambrian and Paleozoic cover. In the Bou Azzer inlier outcrop especially vestiges of the old formations going from the Tonian to the lower Cambrian (Taroudant groupe) corresponding to (Blein et al., 2014b; Admou et al., 2013; Soulaimani et al., 2013; Chevremont et al., 2013): 1) The Tachdamt-Bleida Group (Upper Tonian– lower Cryogenian) composed of metamorphosed limestone and sandstone, intruded by mafic sills and lava flows. The metamorphism contact caused by mafic rocks was dated at 789 ± 10 Ma (whole rock Rb-Sr age; Clauer, 1974). This sedimentary sequence has a regional equivalent in the southwestern domain in the Anti-Atlas in the form of the Taghdout Group composed of similar rock types (Leblanc 1981; Hassenforder, 1987; Bouougri and Saquaque, 2004), which is currently interpreted as having been deposited on a passive margin on the northern edge of the West African Craton, tentatively during the Tonian and/or Cryogenian. However, the evidence from recent geochronology studies in the Ighrem window (Ikenne et al., 2017) and at Zenaga (Ait Lahna et al., 2016) has shown. that the mafic intrusive rocks might be as old as c. 1.7–1.6 Ga, with the passive margin sedimentary sequence being c. 1 Ga older than was previously thought. 2) The lower Cryogenian terrains are represented by the Tichibannine–Ben Lgrad group composed of fine siltstone and the Assif n’Bougmane– Takroumt plutono–metamorphic complex, consisted of orthogneisses, metamorphosed mafic rocks, and paragneisses, these metamorphic rocks are crosscut by Upper Cryogenian granitoids. This complex was originally thought to be of Palaeoproterozoic age, however, recent radiometric dating of the orthogneiss protoliths (755 ± 9 Ma and 745 ± 5 Ma; zircon U-Pb geochronology) and the Oumlil leucogranodiorite (695 ± 7 Ma; zircon U-Pb geochronology) has revealed it to be of Neoproterozoic ages (Chèvremont et al., 2013; Blein et al., 2014a). 3) The upper Cryogenian is represented by the ophiolitic complex of the Bou Azzer–El Graara Group (658 ± 9 Ma) (Admou et al., 2013), composed of serpentinized mantle peridotites, dikes of gabbros and dolerites, basalts and volcano-sedimentary units. 4) The Cryogenian–Ediacaran limit is represented by dioritic and granodioritic intrusions which are the Bou Frokh and Bou Azzer massifs and the polyphased Taghouni massif. 5) The Lower Ediacarian is represented by the ignimbrites and andesite (625 ± 8 Ma) of the Bou Lbarod–Iouraghen (Blein et al., 2014a). This magmatism is contemporaneous with the Tiddiline group in the East; which attributed is to Lower Ediacaran (606 ± 4 Ma) and composed of sandstones, siltstones and interlayered rhyolites (Blein et al., 2014a). 6) The Ouarzazate Group attributed to the Late Ediacaran (566 ± 4 and 567 ± 5 Ma) (Blein et al., 2014a), consists of ignimbritic pyroclastic flows, of dacitic to rhyolitic composition, associated with pyroclastic tuffs and breccias and volcano-sedimentary deposits. The top of this group is characterized by andesitic flows interlayered with ignimbrite pyroclastic flows. 2.2. Local geology The Bou Azzer East deposits are located in the western part of the Bou Azzer inlier (Figs. 1, 2). Its geology consists of: (i) Lower Cryogenian rocks outcrop in the southwestern part of the Bou Azzer.
(3) Multivariate statistics and Geostatistical Analysis of Co, Ni, As and Au, Ag mineralization .... 365. Fig. 1. Simplified geological map of the Bou Azzer–El Graara inlier showing the main lithotectonic units (after Blein et al., 2014a).. East deposit. They consist of gneiss and amphibolite rocks. The contacts between these two units are often faulted along the NE–SW direction; (ii) Middle Cryogenian terrains occupy the central part of the study area. They are represented by serpentinized harzburgite (Leblanc, 1981; Bodinier et al., 1984) and green rocks corresponding to metamorphosed micro–gabbro and diabases; (iii) Upper Cryogenian rocks are represented by quartz–diorite massif outcropping in the western part of the deposit, intruding the serpentinites; (iv) The Late Ediacaran terrains are exposed in the north and east of the study area. They overlay, with angular unconformity, the Cryogenian terrains and consist of volcanic and volcanoclastic sequences of the Ouarzazate Group (Thomas et al., 2002), which in turn consist of a succession of rhyolites, dacites, andesites and tuffs, associated with interbedded microconglomerate levels. This complex is capped by the infracambrian formations that occupy the northern part of the deposit comprising the lower dolomites, surmounted by trachy–andesites and conglomerates.. On a large scale, the Precambrian basement of the studied area is affected by numerous fractures systems (faults/veins) systems that mostly show an important hydrothermal circulation. The majority of the faults show normal to strike–slip motion. Statistical analysis shows three main vein systems with various filling motions. The E–W to ESE– WNW system, are quartz–carbonate–filled veins. The NE–SW system is the most abundant one in the field, which mainly show sinistral normal motion. It is considered as the main cause for the controlling and outcropping of the serpentinite massifs (Maacha, 2013). The N–S to NNW–SSE system is associated with brecciated faults zone with quartz and quartz–carbonate–filled veins. It is commonly developed at the serpentinite contact zone. In the Bou Azzer East sector, mineralization is controlled by brittle tectonics. A new deposit was discovered in 2012 by Tifnout Tiranimine Company (CTT) geologists as a result of compilation and prediction of gitological work. At outcrop, the study area is characterized by the staking of a.
(4) 366. Muhammad Souiri et al.. Fig. 2. Geological map of the Bou Azzer–East deposit.. serpentine scale over 350 m length and between 40 m and 70 m width. It is in tectonic contact with the ediacaran cover. This slice of serpentinite is controlled by a narrow thrust corridor of major NESW trending faults. These formations are affected by a hydrothermal activity often guided by the quartz-carbonated vein structures. At surface level, serpentinite outcrops within the Ediacaran volcanosedimentary formations of the Ouarzazate Group. It is structured by EW and NE faults in juxtaposed blocks. A network of NE and NS veins are as-. sociated with these faults with a quartz and/or quartz-carbonate filling and sometimes oligistic clusters (Maacha, 2013). The structural analysis of this vein system showed that it is integrated into the same opening kinematics according to an NNE-SSW compression responsible for a sinistral movement of NE accidents. At the depth level, drill holes and the results of the geophysical study (Maacha, 2013) show the connection of this serpentinite flake with the main Bou Azzer East massif, this is in contact with Middle Ediacaran.
(5) Multivariate statistics and Geostatistical Analysis of Co, Ni, As and Au, Ag mineralization .... quartz diorites and amphibolites.. 3. Sampling and Analytical Methods In this work, we have exploited the chemical. 367. data suplyed by CTT, corresponding to 501 samples from 13 drill cores. Rock powders were obtained using a jaw crusher and an agate ring mill. Whole rock analyses of As, Co, Ni, Au and Ag elements were measured after acid digestion dissolution. Fig. 3. Mine survey projection of the Bou Azzer East deposit drifts..
(6) 368. Muhammad Souiri et al.. using multi–acids (HCl, HNO3, HF, HClO4), and determination by ICP MS Thermo X series2 at the Managem center for research and development, Reminex (Morocco). The petrographic study was carried out on more than 100 samples taken from drill core that traversed the mineralized structures. The petro-mineralogical and metallographic studies were carried out in the laboratory of Studies of Mineral and Energy Resources (LERME) at the Faculty of Sciences in Meknes (Morocco). Semiquantitative chemical analyses were performed using the Philips XL30 scanning electron microscope (SEM) at the Reminex/Managem Research and Development Centre (Morocco). Mineral chemistry was conducted using the electron probe microanalyzer (EPMA) technique of JEOL JXA–8200 at the Department of Mineral Resources and Rocks, Faculty of Earth Sciences, King Abdulaziz University (Saudi Arabia).. 4. Mineralization in the Bou Azzer East deposit 4.1. Morphology of ore bodies The Co–Ni–arsenides mineralization at the Bou– Azzer East occurs in two geoenvironments: (i) in contact with serpentinite and quartz diorite (contact type) and (ii) intra–diorite (cross–cutting type), these veins are orthogonal to the contact of serpentinites, (Leblanc, 1975) (Figs. 3(b), (c)). The first type appears in clusters and veins and its mineralization is associated with quartz–carbonate and/or chlorite structures (Souiri et al., 2020 in review). The orebodies in the Bou Azzer-East deposit are mined to significant depths (below 570m depth). (Figs. 3(a), (b), (c), (d), (e), (f)) The massive mineralization is related to the brecciated subvertical contact between the serpentinite and the adjacent quartz diorite. It occurs in different forms: i) as lenses at the contact, ii) as vein structures with openings orthogonal to the contact, iii) as weak veins, veins, or disseminated in the volcanosedimentary rock of the late Ediacaran. 4.2. Mineralogy of the Ores The Bou Azzer Co-Ni arsenide ores have complex mineral assemblages and textures, reflecting several stages of mineralization. Generally, previous studies. have agreed on the paragenetic succession of the mineralization of this deposit which consists of the formation of arsenides, followed by sulfarsenides and then sulfides (En–Naciri et al., 1997; Dolansky et al., 2007; Ahmed et al., 2009; Gervilla et al., 2012; Bouabdellah et al., 2016). The microscopic investigation has revealed that Co-bearing arsenide minerals are predominant over the Ni and Fe bearing ore minerals. Both, Native gold and electrum Au-Ag are the precious metals found in the ore of Bou Azzer East deposit. Nickeline: (Ni0.92Co0.11Fe0.04)As0.9S0.03, rarely observed in the ore, it is the first Ni-bearing arsenide minerals formed from these parageneses. It occurs as inclusions in rammelsbergite and found in calcite veinlets which cross the serpentinite. In the studied samples, the nickeline has a wide range of Co, Fe, and S contents. They are respectively in the range of 10.66 to 0.64 at%, 6.56 to 0.06 at%, and 4.57 to 0.04 at% for S. Ni also reveals traces of Sb varying between zero and 0.36 wt% and 0.04 wt% for Bi. Rammelsbergite is comparatively rare; it is found as metallic gray masses (silver-white color). It occurs, in two separate generations, as aggregates of minerals, in clusters, and often aneuhedral crystals. It is often associated with nickel skutterudite (Skt I) and safflorite (Fig. 4(a)) and contains unusual fine Au-Ag amalgam inclusions. It is frequently larded with microcracks filled with löllingite and gersdorffite (Fig. 4(a)). In some sections, rammelsbergite is replaced by nickel arsenopyrite (Fig. 4(b)). These two generations show two different chemical compositions: i) (Ni1.02Co0.14Fe0.01) As1.79S0.03, with a Ni/As ratio between 0.41 and 0.5 wt% and Ni and Co contents which vary respectively from 37.85 to 30.97 at% and from 8.21 to 1.61 at%. Their Fe and S grades range respectively from nil to 2.05 at% and 6.17 to 0.24 at%. ii) (Ni0.79Co0.36Fe0.02) As1.8S0.03 (rammelsbergiteCo) has a low Ni/As ratio ranging from 0.26 to 0.40 wt%. It differs from the first generation by its Ni and Co contents which are respectively (19.77 to 30.93 at%) and (5.79 to 17.86 at%) and much lower Fe and S contents (0.11 to 2.98 at%) and (0.25 to 3.14 at%). Both of them contain small amounts of Sb (0 and 0.07 wt%), Bi (0.02-0.13 wt%), Sb (0 and 0.07 wt%), Bi (0.02-0.13 wt%), Sb (0 and 0.07 wt%) and Fe (0.11-2.98 at%)..
(7) Multivariate statistics and Geostatistical Analysis of Co, Ni, As and Au, Ag mineralization .... 369. Fig. 4. Photomicrographs showing the mineral assemblage in reflected light microscopy and SEM (a) SEM image of rammelsbergite and safflorite diarsenides crosscut by sulfoarsenides (gersdorffite and arsenopyrite). (b) SEM image of Arsenopyrite I which tends to replace rammelsbergite. (c) Image in reflected light microscopy of Skutterudite I with inclusion of Au-Ag amalgam in association with rammelsbergite. (d) SEM image of Skutterudite associated with slfarsenides. (e) SEM image of Skutterudite with inclusions of native gold and Au-Ag amalgam. (f) Image in reflected light microscopy of Cobaltite in association with native gold in skutterudite inclusions, and microcracks with Au-Ag amalgam and sphalerite fillings. Ram: rammelsbergite, Saf: safflorite, Skt I: skutterudite I, Skt II: skutterudite II, Ger :gersdorffite, Gold: native gold, Au-Ag: Electrum Au-Ag, Cpy: Chalcopyrite, Cob: cobaltite, Mol: molybdenite, Cal: calcite, Sph: sphalerite..
(8) 370. Muhammad Souiri et al.. Lollingite (Fe0.89, Ni0.14) As1.85, S0.11: It fills micro-cracks that affects the Co-Ni diarsenides (rammelsbergite and safflorite), and as clusters, millimeter size range enclosing diarsenide crystals. EPMA analyses of löllingite show Ni grades ranging from 1.98 to 7.13 at%. Skutterudite: is one of the most common arsenide minerals in the Bou Azzer East. It occurs in various shapes: in subhedral to euhedral clusters (cube, diamond-shaped) ranging in size from micrometer to millimeter (750 µm on average) and massive ranges of centimeter size. There are two generations of skutterudite: i) Skutterudite I: nickelenriched, it tends to develop with the diarsenides and often contains inclusions of electrum Au-Ag (Fig. 4(c)). ii) Skuttérudite II: more abundant than the first one, it occurs in euhedral crystals and centimetric clusters. It is a skutterudite (cobaltiferous) enriched in native gold and electrum inclusions (Fig. 4(e)), arsenopyrite, cobaltite, native bismuth, rutile, and brannerite (Figs. 4(d), (f)). It also shows sulfide-filled microcavities (Fig. 4(d)). The chemical formula of skutterudite ranges from ((Co0.92Ni0.17Fe0.06) As2.75S0.05 and ((Co1.08Ni0.05Fe0.06) As2.72S0.09). Elements such as S, Sb, Te, and Bi are found in trace amounts in some skutterudites. with significant contents of Sb and Te respectively between 0.01-0.06 wt% and 0.01-0.09 wt%, S and Bi respectively between 0.02 wt% and 2.81 wt% and between 0.01 wt% and 0.1 wt%. Gersdorffite (Ni0.85Co0.20Fe0.11) As1.19S0.63: only recognized in a few samples. It occurs as subhedral to euhedral crystals (Fig. 4(a)). The gersdorffite exhibits Co contents ranging from 2.71 at.% to 16.37 at.%, Fe contents varying from 0.51 to 9.97 at.% and S contents ranging from 15.50 to 26.7 at.%. Arsenopyrite (Fe0.71Ni0.28Co0.06) As1.02S0.92: well-expressed, it occurs in different shapes, as euhedral (diamond-shaped) crystals as inclusions in skutterudite II (Fig. 4(d)), or as aggregates of isolated crystals in the carbonate gangue. Nickel arsenopyrite develops at the expense of rammelsbergite (Figs. 4(a), (b)) and has also been observed in association with gersdorffite, filling geodic microcavities within Co-Ni di-triarsenides. Cobaltite (Co0.99Ni0.09Fe0.08) As0.94S0.89: abundant in clusters and euhedral to subhedral crystals within skutterudite II (Fig. 4(d)). Cobaltite I contains. inclusions (of the order of 30 µm) of native gold and electrum in globular or acicular grains (Fig. 4(f)). Molybdenite (MoS2): frequent, it occurs in clusters and twisted fibers of millimeter size associated with chlorite. It has been observed also as filling of late fractures and arsenide cavities (Fig. 5(a)). Molybdenite develops before copper sulfides. It often includes inclusions of brannerite and native gold of micrometer size. Pyrite (Fe0.98, S1.99): always occurs as cubic crystals in inclusions in the chalcopyrite and sphalerite veins (Fig. 5(b)). Chalcopyrite (Cu0.98Fe1.01S1.99): is the most expressed phase of all sulfides. It appears as clusters filling the microcavities of the arsenides and the veinlets that cross them (Fig. 5(a)) in association with a calcite gangue. Chalcopyrite shows textures of replacement by bornite (Fig. 5(c)) and has euhedral inclusions of pyrite (Fig. 5(d)). Chemical analyses of this mineral show contents of Cu (23.98 to 24.89 at%), Fe (24.83 and 25.36 at%) and S (49.12 to 50 at%) and other trace elements such as Co (0.08 to 0.41 at%), As (0.1 to 1.07 at%) and contents of Zn, Pb, Sb, Te lower than 0.03 at%. Sphalerite (Zn0.9S1.00): appears either as clusters filling geodic cavities within cobalt and nickel arsenides or as a fissured mass plugging the microfractures which affect them (Fig. 5(d)). The chemical composition of sphalerite shows Zn contents ranging from 42.54 to 47.01 at%, S from 42.51 to 52.0 at%, and minor amounts of Co (0.71 to 2.65 at%) and As (0.06 to 2.48 at%). Galena (Pb0.90S0.95), its expression is limited. It occurs as small crystals (45 µm) in carbonates filling the microcracks affecting the arsenides or it appears accidentally with sphalerite (Fig. 5(d)). Chemical analyses of the galena show contents of Zn (5.27-6.35 at.%). Bornite (Cu4.87Fe1.01S4.03): develops to the expense of chalcopyrite and as a fill in the geodetic open spaces in arsenides. It contains the electrum micro-inclusions (Fig. 5(c)). Bornite shows Cu grades ranging from 47.75 at% to 49.41 at%, Fe from 9.59 to 10.82 at%, S from 39.63 to 41.36 at%. Trace elements such as As, Zn, Au, and Ag are present in minor amounts in bornite. Chalcocite (Cu2S): develops at the edges of the.
(9) Multivariate statistics and Geostatistical Analysis of Co, Ni, As and Au, Ag mineralization .... 371. Fig. 5. Photomicrographs showing the mineral assemblage of sulfide in reflected light microscopy and SEM (a) Molybdenite with brannerite inclusions corroding skutterudite and chalcopyrite; (b) SEM image showing microcavities in skutterudite filled with chalcopyrite with pyrite inclusions; (c) Image in reflected light microscopy showing microcracks with bornite filling crossing the arsenides (skutterudite); (d) SEM image showing Small euhedral of galena entirely imbedded within sphalerite.. chalcopyrite and bornite minerals and borrows the microfractures that affect these two minerals. Sometimes chalcocite is surrounded by late covellite. Precious metals (native gold and electrum AuAg) are an important byproduct of the Bou Azzer district and has been the object of numerous investigations (Leblanc and Fischer, 1990; En-Naciri, 1995; Ghorfi et al., 2005; Ahmed et al., 2009) observed as inclusions of various sizes and shapes). Native gold occurs as microinclusions of in skutterudite II, Co–bearing rammelsbergite, and cobaltite I. It has also been observed in the supergene alteration zones as fine inclusions (< 20 µm) in erythrite. Electrum is the most expressed type of. gold in the Bou–Azzer East ore, it occurs as inclusions in diarsenides (Ni–bearing safflorite, Co– bearing rammelsbergite), triarsenides (Ni–bearing skutterudite I, skutterudite II and cobaltite II, as well as in late sulfides vein–filling: sphalerite, molybdenite, chalcopyrite, and bornite. 4.3. Paragenetic Sequence Textural relationships suggest a depositional sequence proceeding from Ni arsenides (nickeline and rammelsbergite) to Co-Fe diarsenides (Ni-Co diarsenides, Co-Fe diarsenides) to cobalt triarsenide (skutterudite) reflecting progressive increase in Co and As concentrations (Ahmed et al., 2009; Souiri.
(10) 372. Muhammad Souiri et al.. Fig. 6. Paragenetic sequences of mineralization in the Bou Azzer–East Co-Ni Au and Ag arsenide ore deposits.. et al., 2019). Six stages of mineral formation can be distinguished based on the mineral textures and associations (Fig. 6): Stage I, consists mainly to neckline and rammelsbergite; Stage II, with Co and Fe diarsenides, represented by safflorite, Ni– skuttérudite, lollingite and to a lesser extent skutterudite; Stage III, with Co arsenides, represented by skutterudite, cobaltite I and arsenopyrite I; Stage IV, with sulfarsenides, represented by cobaltite II, arsenopyrite II and gersdorffite, and (v) Stage V, with sulfides, corresponding to a mineralogical. assemblage composed of molybdenite, pyrite, chalcopyrite, galena, sphalerite, and bornite; Stage VI, corresponding to supergene alteration minerals deriving from the oxidation of the arsenides (erythrite, annabergite, heterogenite) or sulfides (bornite, covellite, and chalcocite). Type II (transverse); is represented, in some details, by mineral parageneses, corresponding to the last 5 stages of the previous type (contact), with a particular abundance of skutterudite, cobaltite, arsenopyrite, and sulfides. The absence of nickeline and rammelsbergite and safflorite diarsenides is very.
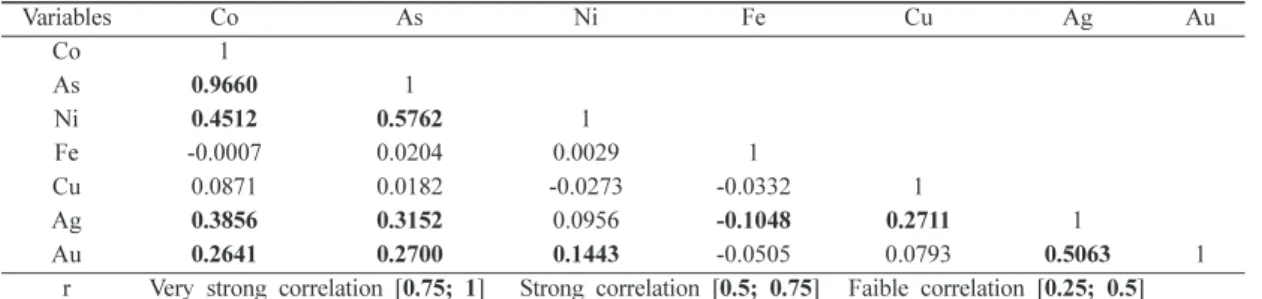
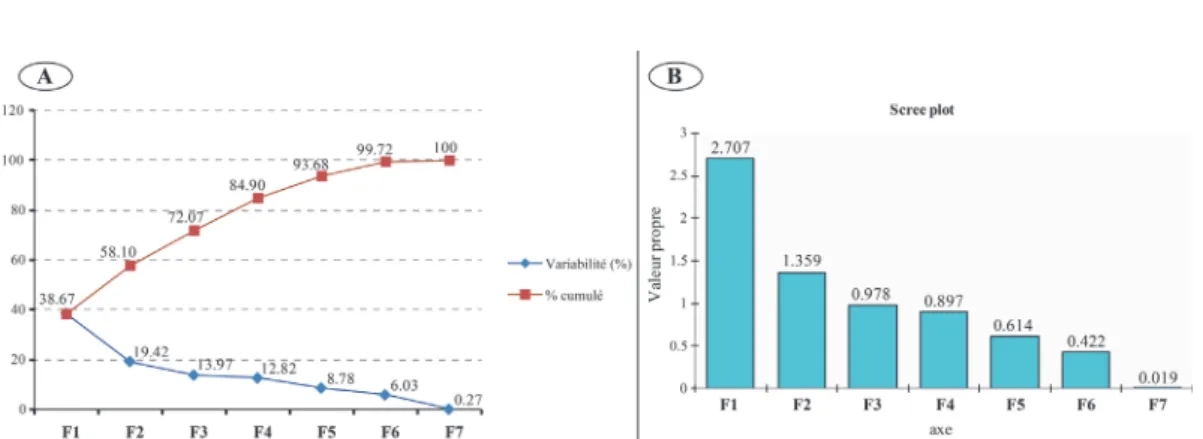
(11) Multivariate statistics and Geostatistical Analysis of Co, Ni, As and Au, Ag mineralization .... remarkable. 5. Statistical and Geostatistical Analysis 5.1. Binary correlation matrix The Pearson correlation coefficient results (Table 1) are calculated based on the bulk chemical data (501 samples). They highlighted the different degrees of correlation between the variables with: r = [0.75-1] is considered a very strong correlation, r = [0.5-0.75] strong correlation and r = [0.25-0.5] low correlation. The high correlation coefficient (r = 0.966) links both Co and As, reflecting the close association of these elements in cobalt minerals such as skutterudite, cobaltite and safflorite which are the main cobalt arsenides. The coefficient between As and Ni is r = 0.576, which is high can also be attributed to the presence of mineralogical supports whose association between these two elements is well established. These are mainly rammelsbergite, gersdorffite and nickelin. Also, the precious metals gold (Au) and silver (Ag) show a coefficient: r = 0.5063 and therefore a fairly good correlation. The mineralogical and chemical analysis of the gold grains of this mineralization shows that the mineralogical expression of Au is mainly in the form of electrum (Au-Ag) and would explain the positive correlation shown by these elements. Another value of the average correlation coefficient (r = 0.451) relating the variables Co and Ni can probably be explained by the presence of minerals with a chemical composition showing a progressive enrichment in these two elements. The Pearson correlation coefficients of Au and Ag with the other elements show low values (CoAg, r = 0.386), (As-Ag, r = 0.315), (Cu-Ag, r = 0.271), (As-Au, r = 0.27) and (Co-Au, r = 0.2641) and, therefore, the absence of a particular association of. 373. Au and Ag with the main constituent elements of the other metallic phases (Co, As, Cu). This probably explains the indifferent presence of gold in all of the previously defined paragenetic stages, in association with cobalt arsenides, copper sulphides and to a lesser extent nickel arsenides (rammelsbergite). Bold values represent the pairs of variables in which the H0 - null hypothesis of the independence of the pairs of variables (Fisher Snedecor test) is rejected very significantly (p=0.005). 5.2. Principal Component Analysis 5.2.1. Proper values and factor axes: (Table 2; Figs. 7(a), (b)) show that the first F1 axis accounts for 38.67% of the total variance, which means that if the data are represented on a single axis, 61.33% of the dispersion of the data will be lost. The proportion of variance absorbed by the factors decreases slightly; it is necessary to observe four factors (out of a total of seven) to absorb 84.90% of the total variance (total variance here is 7). The choice of axes to be retained followed Kaiser's criterion (Kaiser, 1958), which indicates that axes whose eigenvalue is greater than 1 must be retained. However, it is useful to check whether a variable with, for example, a high value for one of the non-extracted main components might not be well represented in the space of the first q Table 2. Representation of the individual and cumulative percentages of the absorbed variance for each eigenvalues Eigenvalue Individual explained variance (%) Cumulative explained variance (%). F1 2.71. F2 1.36. F3 0.98. F4 0.90. 38.7. 19.4. 14.0. 12.8. 38.7. 58.1. 72.1. 84.9. Table 1. Pearson correlation coefficient matrix result Variables Co As Ni Fe Cu Ag Au r. Co As 1 0.9660 1 0.4512 0.5762 -0.0007 0.0204 0.0871 0.0182 0.3856 0.3152 0.2641 0.2700 Very strong correlation [0.75; 1]. Ni. 1 0.0029 -0.0273 0.0956 0.1443 Strong correlation. Fe. 1 -0.0332 -0.1048 -0.0505 [0.5; 0.75]. Cu. Ag. 1 0.2711 1 0.0793 0.5063 Faible correlation [0.25; 0.5]. Au. 1.
(12) Muhammad Souiri et al.. 374. Fig. 7. Graphical representation of the individual and cumulative percentages of the absorbed variance by its each eigenvalues, B: Graph of eigenvalues. Table 3. Correlations of variables and factors Fatorial Axes → F1 Variables ↓ Co 0.9070 As 0.9171 Ni 0.6239 Fe -0.0434 Cu 0.1654 Ag 0.5930 Au 0.5229. F2. F3. F4. -0.2001 0.0146 0.1190 -0.3055 -0.0098 0.0845 -0.4271 -0.1101 0.1181 -0.3208 0.9159 -0.2312 0.5694 0.3504 0.6920 0.6148 0.0647 -0.1606 0.4885 0.0150 -0.5514. factors. For this reason, we considered the following factorial plans: F1-F2, F1-F3, F1-F4. 5.2.2. Correlation circle analysis The PCA is conducted on reduced centred data. Table 3 allows the correlations between variables and factors to be determined. The factor F1 accounts for 38.67%, it is positively correlated with its variables which are in order of importance As, Co, Ni, Ag, Au. The F2 factor represents 19.42%. It is positively correlated with the variables Ag, Au and Cu. Iron is highly correlated with F3 while Co and Au have high value with F4 (the Co and Au are in opposition in F4, which means a negative correlation between them). The correlation circles (Fig. 8) facilitating to read of variables which have positive or negative components on the factorial axes can explain the following metallic associations (a variable correlated with the factor is considered when the value of the correlation is close to or above 0.5 (Table 3). The F1-F2 plane: The F2 axis opposes the group of Au-Ag-Cu variables, positively correlated to the. F1 and F2 axes and the group of As-Co-Ni variables positively correlated to the F1 axis but negatively correlated to the F2 axis. As for Fe, it is negatively correlated with both axes. The F1-F3 plane shows that copper opposes Fe with respect to the F1 axis, the other variables As, Co, Ni, Au and Ag are not expressed on F3. The F1-F3 plane shows that copper opposes Fe with respect to the F1 axis, the other variables As, Co, Ni, Au and Ag are not expressed on F3. The F1-F4 plane shows the opposition between Fe and Ag with respect to the F1 axis and the opposition between copper and Au with respect to the F4 axis. We also note that Co, Ni and As are not expressed on the F4 axis. 5.2.3. Simultaneous analysis of variables and samples in factorial plans In this section, we analyze the two domains simultaneously: that of the variables (correlation circles in Fig. 7) and that of the samples (factorial plans), not given due to congestion. The variables (As, Co, Ni, Ag and Au) possess a positive component on the F1 axis. They indicate that on the projection plane of the individuals (samples), the contents of these five variables increase with their increasing components on the F1 axis. Among the individuals characterized by high levels of these variables are SC31-551.1, SC31-552.2, SC31560.49, SC31-561.07, SC42-261.3, SC55-481.9, with regard to the F2 axis, and considering the projection of individuals with a positive component on the F1 axis, two cases arise: Individuals with the highest positive components on F2, tend to be the richest in Ag and Au (e.g. SC6-589, SC14bis-.
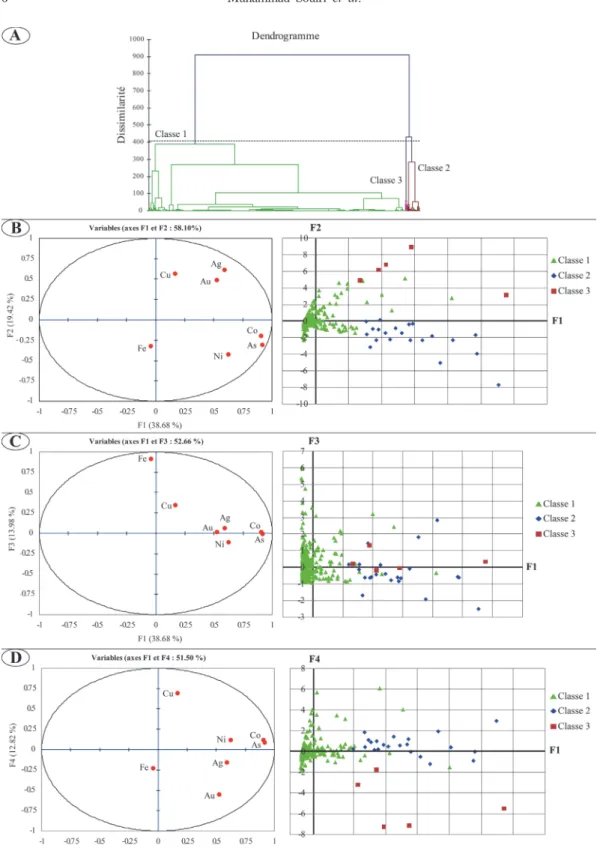
(13) Multivariate statistics and Geostatistical Analysis of Co, Ni, As and Au, Ag mineralization .... 375. Fig. 8. Graphical representation of correlation circles (factor variables).. 469, SC14bis-470, SC42-263.45 and SC47-239.8); Individuals with the most negative components on F2, tend to be the most negative in Ni, Co and As. On the F3 axis, Iron has a high positive component, and to a lesser extent copper; while the component of the other variables is insignificant or almost nil. The existence of samples with low levels of these elements can be inferred from this, such as samples SC31-552.2, SC31-551.1, SC31561.07, SC49-322.3, SC47-239.8, SC31-563.89 and SC31-560.49. On F4, copper is expressed with a high positive component while Au has a strongly negative component. In other words, samples with a positive component on F4 will be enriched in copper and poor in Au (SC14bis-476, SC14bis-465, SC46482.4, SC14bis-469, SC14bis-470 and SC42263.45).. 6. The Ascendant Hierarchical Classification To understand the relationship between the. variables, we used the ascendant hierarchical classification method, considering reduced centered data, Euclidean distance and Ward's criteria. These parameters let us make a significant classification and define the number of classes that represent a better distribution of the variables. 3 individual classes have been identified (Fig. 9(a)). The F1-F2 plane (Fig. 9(b)) shows that: - class 1 (94% of individuals), corresponds to the samples with the lower values of the variables positively correlated to F1; - Individuals in classes 2 (4%) and 3 (2%) show high components on F1. These are globally positive on F2 for class 3 and negative on F2 for class 2. This last class is characterized by samples with high values essentially in As, Co and Ni, while class 3 contains samples with high grades of Au, Ag and, to a lesser extent, Cu. In the F1-F3 plane, we discover that class 2 and class 3 combine samples with positive components on the F1 axis, which tend to be weak on the F3.
(14) 376. Muhammad Souiri et al.. Fig. 9. (A) hierarchical ascending classification, (B) Comparison of the results of the PCA and the HCA along the F1-F2 axis, (C) Comparison of the results of the PCA and the HCA along the F1-F3 axis, (D) Comparison of the results of the PCA and the HCA along the F1-F4 axis..
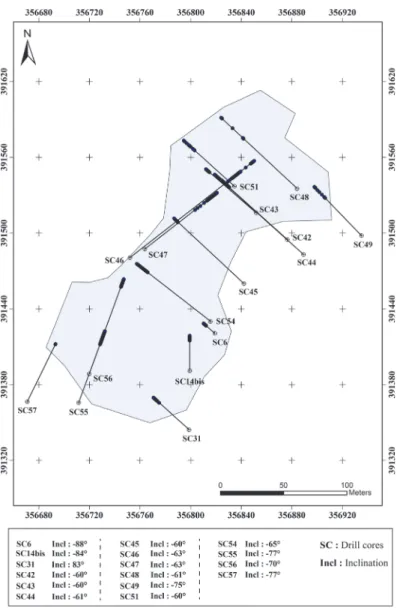
(15) Multivariate statistics and Geostatistical Analysis of Co, Ni, As and Au, Ag mineralization .... 377. Fig. 10. Location map of drill cores with report of analyzed samples.. axis. For class 1, we note that some samples show a positive component on the F3 axis reflecting their high Fe content. In plane F1-F4, it can be seen that class 2 is not expressed while class 3 consists of samples with negative components on the F4 axis. Some samples of class 1 show a positive component on the F4 axis indicating their high Cu content.. 7. Kriging Fig. 10 represents a map showing the distribution of the considered drill holes and the position of the. analyzed samples on each drill hole. For the kriging maps, we used the grades (in %) for the variables (As, Co, Ni) and (ppm) for the variables (Au, Ag). These grades were projected vertically on a horizontal plane. The variograms of variables and model adjustments necessary for the calculation of the kriging maps (not presented here), were calculated after the normalization of the data using the GA/ArcGIS tool in the "Maroc Lambert Conformal Conic Zone 2" coordinate system. The variograms adopted for the variables are of the spherical type for the variables Co, Ni, Au and Ag, while As is represent-.
(16) 378. Muhammad Souiri et al.. Fig. 11. (a) Co kriging map, (b) As kriging map, (c) Ni kriging map, (d) Au kriging map, (e) Ag kriging map (ppm).. ed by an exponential type variogram. The applied kriging for these variables is ordinary and the kriging maps have been limited to the neighborhood of the geochemical profiles. The obtained maps for Co, As, Ni, Au and Ag (Fig. 11) provide, on the one hand, the main distribution areas of each variable (regrouping contents of different depths) and, on the other hand, the corresponding directions. 7.1. As, Co and Ni kriging map The kriging maps established for As, Co and Ni elements are characterized by four high-grade distribution zones (anomalies). These zones are located in the same location and have the same directions (Fig. 11(a), (b), (c)). They show two main directions N150° E to N175° E for zones A,. B and D and N0 to N05°E for zone C (Fig. 11(c)). The distribution of para-anomalous zones obtained by kriging for these elements is concordant with each other and in conformity with those of the mineralized serpentinite-quartz diorite contact veins which are NW-SE to NNE-SSW direction. 7.2. Au and Ag kriging map The kriging maps of Au and Ag elements (Figs. 11A, B) illustrate two distribution zones with high grades (anomalies) (Zone A and B). The spatial distribution of the para-anomalous zones shows two distribution patterns with linear structures of N40-50°E and N145°E directions. Comparing the Au and Ag kriging maps, it can be seen that gold's A, B and C anomalies are in perfect agreement with their silver equivalents. The high correlation.
(17) Multivariate statistics and Geostatistical Analysis of Co, Ni, As and Au, Ag mineralization .... of these elements has already been demonstrated by the high correlation coefficients that bind them together. The projection of the kriging paraanomalous zones on the map shows that they are perfectly contiguous with those of the mineralized serpentinite-quartz diorite contact veins NE-SW and those of the transverse type NNW-SSE to NNE-SSW.. 8. Discussion PCA defined two main groups of variables, according to the F1-F2 correlation plan: (Co-AsNi), (Au-Ag-Cu). It is noted that Cu opposes the couple Au-Ag on the F1-F4 correlation plane. These are characterized by correlation coefficients r = 0.27 for Ag-Cu and r = 0.079 for Au-Cu. The association of copper sulphides (chalcopyrite and Bornite) with the Au-Ag amalgam was only observed in a few samples, where there was a clear increase in the Ag content compared to Au. The Au and Ag association, which has a high correlation coefficient in the range of r = 0.506, was confirmed by the chemical-mineralogical study (electrum Au-Ag with up to 50 at.% Ag content). The grouping (Co-As-Ni), can be explained either by i) two cases: the proximity As-Co and As-Ni as well as Co-Ni. The correlation matrix obtained from the raw data shows strong correlations, they are respectively: r = 0.96, r = 0.57 and r = 0.45. Indeed, the mineralogical study has shown the existence of two main mineralogical paragenetic stages, the first of which is nickel-bearing marked by nickel arsenides such as nickeline and rammelsbergite, and the second, more important cobalt-bearing stage, marked by different cobaltbearing minerals such as skutterudite, cobaltite and safflorite. Regarding the correlation coefficient linking respectively Ag-Co, Au-Co which are: r = 0.385, r = 0. 264, it could be explained, on the one hand, i) by inclusions of Au-Ag amalgam and native gold in the cobalt arsenides (skutterudite and cobaltite), which has been proven by both metallographic and chemical (SEM & EPMA) studies of these precious metal inclusions and ii) the existence of a refractory gold type in skutterudite (En-Naciri et al., 1995b). A comparison of variables and samples in the factorial plans allows us to deduce the following. 379. (Fig. 9): i) the existence of distinct samples by their enrichment in Co, As, Ni and Au, Ag, the contents of these elements increase according to their components following the F1 axis; ii) Onaxis F2, a distinction between individuals characterized by Au, Ag and those with As-Co, on the one hand, and an inverse behavior in terms of contents, on the other hand, is highlighted. iii) The results of the hierarchical classification are in agreement with those of the PCA. Thus, three classes of samples were distinguished (Fig. 7): class 1 in which the average grades of (Fe, Cu) are slightly high and lower for (As, Co, Ni, Au and Ag), class 2 in which the average grades of (Co, As and Ni) are the highest and class 3 in which the grades of (Au, Ag) are the most important. Mineralogically, the main silver and gold minerals are electrum (Au-Ag) and Native Gold. They are often found as inclusions in the cobalt arsenides skutterudite and cobaltite. En-Naciri (1995) has reported the presence of a skutterudite which contains a refractory gold. However, our results of the statistical analysis show an opposition between Au, Ag and Co, Ni and As which reveals that these phases are independent. The kriging maps highlight "anomalies" defined by vertical projection of which the higher grades: (i) Au appears essentially in the extreme north-east and to a lesser extent in the central part of the studied area, (ii) Ag appears essentially in the central part and to a lesser extent in the south of the investigated area. The compared maps of gold and silver (Fig. 11D, E) show a similarity of directions: the distribution of gold projects in the continuity of the N40°E vein towards the NE and N140°E in the central part while that of Ag is concentrated in the central part but with the same directions as gold. Whether for gold or silver, another anomaly of average grade appears in the southern part under an N50°E direction. The individualization of these Au and Ag-rich anomalous zones may be due to effects of hydrothermal alterations such as silicification and carbonation of serpentinites which are both rich in Au and Ag (Souiri et al., 2020) and are due to development of roddingite facies which are associated to silver as in Tizi deposit a 3km faraway of the bou Azzer East (Essaraj et al., 2005; Leblanc and Lbouabi, 1988). Similarly for Co, As and Ni, kriging maps show anomalies with.
(18) Muhammad Souiri et al.. 380. the highest grades for cobalt, followed by arsenic and then finally nickel. However, the similarity between the different anomalies for these elements is very evident.. 9. Conclusion The emplacement of the polymetallic mineralization at Bou Azzer East has been defined by six paragenetic stages, the last five of which are AuAg precious metals. These can be grouped, depending on the nature of the mineralization developed in two sets: the first with cobalt and nickel arsenides in association with a quartz-carbonate gangue and the second mainly with copper, iron, zinc and molybdenum sulphides in association with carbonates and chlorites. Skutterudite and cobaltite are the two main cobalt arsenides that contain the most precious metal inclusions (native gold and Au-Ag amalgam). However, Au-Ag electrum grains are present in association with sulphides (molybdenite, sphalerite, chalcopyrite). The geostatistical study of the kriging distribution of metals in this deposit has identified the main directions: N150°E to N175°E and N5°E for Co, As and Ni, and N40°E to N50°E and N145°E for Au and Ag. The comparison between the different kriging maps of Au and Ag elements on the one hand and Co, Ni and As on the other hand reveals a perfect concordance of the distribution of these elements and confirms the strong correlations highlighted between these elements by PCA. The results of the present study suggest that an extension of the mineralization to the South East, following the outcrops of the quartz veins, and still in contact with the serpentine blade, would be possible.. Acknowledgments We are thankful to anonymous reviewers. We also express our gratitude to the staff members of the CTT Company for their hospitality and guidance during the field work.. References Admou, H., Fekkak, A., Razin, P., Egal, E., Youbi, N., Soulaimani, A., Blein, O., Baudin, T., Chèvremont and ANZAR–Conseil. (2013) Carte géologique du Maroc. (1:50,000), feuille Aït Ahmane. Notes et Mémoires Service Géologique du Maroc., n.533, 142p. Ahmed, A.H., Arai, S. and Ikenne, M. (2009a) Mineralogy and paragenesis of the Co–Ni arsenide ores of Bou Azzer, Anti–Atlas, Morocco. Economic Geology., v.104, p.249-266. Ait Lahna, A., Tassinari, C.G.C., Youbi, N., Admou, H., Mata, J., Bouougri, H., Latifa, C, Ernst, R.E., Boumehdi, M.A., Maacha, L., Bodinier, J.L., El Messbahi, H., Ikenne, M., Bensalah, M. and Aarab, M. (2016) U-Pb Geochronology of the Taghdout Sill (Zenaga inlier, Anti-Atlas, Morocco): Refining the stratigraphy of the Taghdout Group. Proceedings of the: Resources and Innovative Geology - RIG2016. Montpellier, France, p.31. Blein, O., Baudin, T., Chevremont, P., Soulaimani, A., Admou, H., Gasquet, P., Cocherie, A., Egal, E., Youbi, N., Razin, P., Gombert, P. and Bouabdelli, M. (2014a) Geochronological constraints on the polycyclic magmatism in the Bou Azzer–El Graara inlier (central Anti– Atlas Morocco). Journal of African Earth Sciences, v.99, p.287-306. Blein, O., Baudin, T., Soulaimani, A., Cocherie, A., Ch evremont, P., Admou, H., Ouanaimi, H., Hafid, A., Razin, P., Bouabdelli, M. and Roger, J. (2014b) New geochemical, geochronological and structural constraints on the Ediacaran evolution of the south Sirwa, Agadir-Melloul and Iguerda inliers, Anti-Atlas, Morocco. Journal of Africain. Earth Sciences, v.98, p.47-71. Bodinier, J.L., Dupuy, C. and Dostal, J. (1984) Geochemistry of precambrian ophiolites from Bou Azzer, Morocco. Contributions to Mineralogy and Petrology, v.87, p.4350. Bouabdellah, M., Maacha, L., Levresse, G. and Saddiqi, O. (2016) The Bou Azzer Co-Ni-Fe-As (± Au, ± Ag) district of Central Anti-Atlas (Morocco): A long-lived late Hercynian to Triassic magmatic-hydrothermal to lowsulphidation epithermal system. In: Bouabdellah M and Slack JF (eds), Mineral Deposits of North Africa, Mineral Resource Reviews, Springer International Publishing, Switzerland, p.229-247. Bouougri, E.H. and Saquaque, A. (2004) Lithostratigraphic framework and correlation of the Neoproterozoic northern West African Craton passive margin sequence (Siroua–Zenaga–Bouazzer Elgraara Inliers, Central AntiAtlas, Morocco): an integrated approach. Journal of African Earth Sciences, v.39, p.227-238. Chevremont, P., Belin, O., Razin, P., Baudin. T,. Barbanson, L., Gasquet, D., Soulaimani, A., Admou, H., Youbi, N., Bouabdelli, M. and anzar–conseil. (2013) Notice explicative, carte géologique de. Maroc (1:50,000). Feuille Bou Azzer Notes et Mémoires Service. Géologique. n.535 bis, 153p. Clauer, N. (1974) Utilisation de la méthode rubidium-strontium pour la datation d’une schistosité de sédiments peu métamorphisés: application au Précambrien II de la boutonnière de Bou Azzer–El Graara (Anti-Atlas, Maroc). Earth Plan. Sci. Letters, v.22, p.404-412. Dolansky, L.M. (2007) Controls on the genesis of hydrothermal cobalt mineralization: insights from the mineralogy and geochemistry of the Bou Azzer deposits, Morocco. Unpublished Ph.D. Thesis, McGill Univer-.
(19) Multivariate statistics and Geostatistical Analysis of Co, Ni, As and Au, Ag mineralization ... sity, Montreal, 192p. En–Naciri, A. (1995) Contribution à l’étude du district a Co, As, (Ni, Au, Ag) de Bou Azzer, Anti Atlas (Maroc), données mineralogiques et geochimiques; étude des inclusions fluides. Unpublished P.h.D thesis, Université Orleans, France, 238p. Ennaciri, A., Barbanson, L. and Touray, J.C. (1995b) Mineralized hydrothermal solution cavities in the Co–As Ait Ahmane mine (Bou Azzer, Morocco). Mineralium Deposita, v.30, p.75-77. En–Naciri, A., Barbanson, L. and Touray, J.C. (1997) Brine inclusions from the Co–As (Au) Bou Azzer district, Anti–Atlas Mountains, Morocco. Economic Geology, v.92, p.360-367. Essarraj, S., Boiron, M.C., Cathelineau, M., Banks, D.A. and Benharref, M. (2005) Penetration of surface–evaporated brines into the Proterozoic basement and deposition of Co and Ag at Bou Azzer (Morocco): Evidence from fluid inclusions. Journal of African Earth Sciences, v.41, p.25-39. Gervilla, F., Fanlo, I., Colás, V. and Subias, I. (2012) Mineral compositions and phase relations of Ni-Co-Fe arsenide ores from the Aghbar mine, Bou Azzer, Morocco. The Canadian Mineralogist, v.50, p.447-470. Hassenforder, B. (1987) La Tectonique Panafricaine et Varisque de l’Anti-Atlas dans le Massif du Kerdous (Maroc). Thèse de doctorat Es-Sciences. Université de Strasbourg, 220p. Ikenne, M., Söderlund, U., Ernst, R.E., Pin, C., Youbi, N., El Aouli, E.H. and Hafid, A. (2017) A c. 1710 Ma mafic sill emplaced into a quartzite and calcareous series from Ighrem, Anti-Atlas - Morocco: Evidence that the Taghdout passive margin sedimentary group is nearly 1 Ga older than previously thought. Journal of African Earth Sciences, v.127, p.62-76. Kaiser, H.F. (1958) The varimax criteria for analytical rotation in factor analysis, Psychometrica, v.23, p.141-51. Leblanc, M. (1975) Ophiolites précambriennes et gites arseniés de cobalt: Bou Azzer (Maroc). Unpublished Ph.D. thesis, Université de Paris VI, Paris, France, p.367. Leblanc, M. (1981) The late Proterozoic ophiolites of Bou. 381. Azzer (Morocco): evidence for Pan–African plate tectonics. Developments in Precambrian Geology, v.4, p.435-451. Leblanc, M. and Billaud, P. (1982) Cobalt arsenide ore bodies related to an upper Proterozoic ophiolite; Bou Azzer (Morocco). Economic Geology, v.77, p.162-175. Leblanc, M. and Lbouabi, M. (1988) Native silver mineralisation along a rodingite tectonic contact between serpentinite and quartz–diorite (Bou Azzer, Morocco). Economic Geology, v.83, p.1379-1391. Maacha, L. (2013) Etudes Métallogéniques Et Géophysiques des Minéralisations Cobaltifères et Cuprifères de Bou–Azzer El Graara Anti–Atlas Maroc: Les Minéralisations de Cobalt, Arsenic, Nickel et Or associées à la série ophiolitique. Unpublished Ph.D. Thesis, Université Cadi Ayyad, Marrakech, 748p. Soulaimani, A., Razin, P., Youbi, N., Barbanson, L., Admou, H., Blein, O., Gasquet, D., Bouabdelli, M. and Anzar, C. (2013) Notice explicative de la Carte géologique du Maroc (1:50,000), feuille Al Gloa. Notes et Mémoires du service Géologique du Maroc, n.532bis. Souiri, M., Aissa, M., Ahmed, H.A., El Azmi., Mezougane, H., Moussaid, A. and El Basbas, A. (2020) Hydrothermal alterations of the Bou Azzer–East Co–Ni–As– Au deposits (Central Anti–Atlas, Morocco). Geosciences Journal (In review) Souiri, M., Aissa, M., Ouguir, H., El Azmi, M., El Basbas, A., Mezougane, H., Moussaid, A. and Zouhair, M. (2019) Métaux précieux (Au–Ag) dans le gisement à Co–Ni–Fe–As de Bou Azzer Est (Anti Atlas central, Maroc). Magmatisme, Métamorphisme et Minéralisations Associées (3MA–11) (Abstract), El Jadida Avril 23-24, p.52-53. Thomas, R.J., Chevallier, L.P., Gresse, P.G., Harmer, R.E., Eglington, B.M., Armstrong, R.A., de Beer, C.H., Martini, J.E.J., de Kock, G.S., Macey, P.H. and Ingram, B.A. (2002) Precambrian evolution of the Sirwa window, Anti–Atlas orogen, Morocco. Precambrian Research, v.118, p.1-57. Webographie Johnston, K., Hoef, JMV., Krivoruchko, K. and Lucas, N. (2001). ArcGIS® 9: using ArcGIS®..
(20)
수치


+3
관련 문서
pISSN 1225 7281 eISSN 2288 7962 자원환경지질, 제53권, 제6호, 781 792, 2020 Econ Environ Geol , 53(6), 781 792, 2020 http //dx doi org/10 9719/EEG 2020 53 6 781
pISSN 1225 7281 eISSN 2288 7962 자원환경지질, 제53권, 제5호, 585 596, 2020 Econ Environ Geol , 53(5), 585 596, 2020 http //dx doi org/10 9719/EEG 2020 53 5 585 Large scale,
pISSN 1225 7281 eISSN 2288 7962 자원환경지질, 제53권, 제5호, 553 564, 2020 Econ Environ Geol , 53(5), 553 564, 2020 http //dx doi org/10 9719/EEG 2020 53 5 553 울릉도
pISSN 1225 7281 eISSN 2288 7962 자원환경지질, 제53권, 제5호, 505 515, 2020 Econ Environ Geol , 53(5), 505 515, 2020 http //dx doi org/10 9719/EEG 2020 53 5 505 황해
pISSN 1225 7281 eISSN 2288 7962 자원환경지질, 제53권, 제5호, 565 583, 2020 Econ Environ Geol , 53(5), 565 583, 2020 http //dx doi org/10 9719/EEG 2020 53 5 565 국내
pISSN 1225 7281 eISSN 2288 7962 자원환경지질, 제53권, 제3호, 271 285, 2020 Econ Environ Geol , 53(3), 271 285, 2020 http //dx doi org/10 9719/EEG 2020 53 3 271
pISSN 1225 7281 eISSN 2288 7962 자원환경지질, 제53권, 제2호, 147 157, 2020 Econ Environ Geol , 53(2), 147 157, 2020 http //dx doi org/10 9719/EEG 2020 53 2 147 RACMO
pISSN 1225 7281 eISSN 2288 7962 자원환경지질, 제53권, 제1호, 11 21, 2020 Econ Environ Geol , 53(1), 11 21, 2020 http //dx doi org/10 9719/EEG 2020 53 1 11 1차원
