Correlation between TSH Receptor Antibody Assays and Clinical Manifestations of Graves’ Orbitopathy
Sun Young Jang,
1Dong Yeob Shin,
2Eun Jig Lee,
2Young Joon Choi,
3Sang Yeul Lee,
3and Jin Sook Yoon
31Department of Ophthalmology, Soonchunhyang University Bucheon Hospital, Soonchunhyang University College of Medicine, Bucheon;
2The Institute of Endocrinology, Department of Internal Medicine, Yonsei University College of Medicine, Seoul;
3The Institute of Vision Research, Department of Ophthalmology, Yonsei University College of Medicine, Seoul, Korea.
Received: July 26, 2012 Revised: August 30, 2012 Accepted: September 5, 2012
Corresponding author: Dr. Jin Sook Yoon, The Institute of Vision Research, Department of Ophthalmology, Yonsei University College of Medicine, 50 Yonsei-ro, Seodaemun-gu, Seoul 120-752, Korea.
Tel: 82-2-2228-3570, Fax: 82-2-312-0541 E-mail: [email protected]
∙ The authors have no financial conflicts of interest.
© Copyright:
Yonsei University College of Medicine 2013 This is an Open Access article distributed under the terms of the Creative Commons Attribution Non- Commercial License (http://creativecommons.org/
licenses/by-nc/3.0) which permits unrestricted non- commercial use, distribution, and reproduction in any medium, provided the original work is properly cited.
Purpose: To investigate an association between the levels of serum thyroid-stimu- lating hormone (TSH)-receptor autoantibodies (TRAbs) and Graves’ orbitopathy (GO) activity/severity scores, and compare the performance of three different TRAb assays in assessing the clinical manifestations of GO. Materials and Methods: Cross-sectional study. Medical records of 155 patients diagnosed with GO between January 2008 and December 2010 were reviewed. GO activity was assessed by clinical activity score (CAS) and severity graded with the modified NOSPECS score by a single observer. Serum TRAb was measured by three differ- ent methods: 1st generation thyrotropin-binding inhibitor immunoglobulin (TBII) assay (TRAb1st); 3rd generation TBII assay (TRAb3rd); and biological quantitative assay of thyroid-stimulating immunoglobulin (TSI) using Mc4-CHO cells (Mc4- CHO TSI assay). Results were correlated with scores of activity/severity of thy- roid eye disease. Results: All three assays (TRAb1st, TRAb3rd, and Mc4-CHO TSI) yielded results that were significantly positively correlated with CAS (β=0.21, 0.21, and 0.46, respectively; p<0.05) and proptosis (β=0.38, 0.34, and 0.33, re- spectively; p<0.05). Mc4-CHO TSI bioassay results were significantly positively correlated with all GO severity indices (soft tissue involvement, proptosis, extraoc- ular muscle involvement, and total eye score; β=0.31, 0.33, 0.25, and 0.39, respec- tively; p<0.05). Conclusion: Mc4-CHO TSI bioassay was superior over the two TBIIs in assessing active inflammation and muscle restriction due to GO, whereas TBII assay would be sufficient for evaluation of patients with proptosis.
Key Words: TSH-receptor autoantibody, Graves’ orbitopathy, disease activity, se- verity
INTRODUCTION
Graves’ disease (GD) is a well-known multi-systemic autoimmune disorder. An autoantibody specific for thyroid-stimulating hormone receptor (TSH-R), which induces thyroid follicular cells to overproduce thyroid hormones, directly causes GD.1,2 Therefore, a test that specifically and sensitively detects TSH-R autoantibod- ies (TRAb) is a very useful tool for diagnosis,3-6 patient follow-up,6-8 prediction of re-
the Mc4-CHO cell line.13,17
In the present study, we investigated whether a correlation existed between GO clinical features and TRAb as mea- sured by the 1st and 3rd generation TBII assays, both of which are routinely used at our institution, as well as TSI as measured by a bioassay. The TSI bioassay used in our study uses a CHO cell line that is transfected with a Mc4 chime- ric receptor. We also compared the performance of the three different TRAb assays in assessing the clinical features of thyroid eye disease.
MATERIALS AND METHODS
Patients
Patients in this study were examined at the department of ophthalmology, Severance Hospital of Yonsei University College of Medicine between January 2008 and December 2010. All subjects were diagnosed with GO and a single ob- server (JSY) conducted follow-up of all patients. Diagnosis of GO was based on thorough clinical ophthalmic examina- tion. The medical records of 168 patients with GO were re- viewed and 13 patients were excluded because none of the three TRAb assays were performed. The medical records of the remaining 155 patients were retrospectively reviewed.
Patient history, including diabetes, hypertension, any other autoimmune disorder, family history, smoking history, and type of treatment for GD were reviewed. GO activity was assessed using clinical activity score (CAS) as described by Mourits, et al.18 There were seven assessment items: spon- taneous retrobulbar pain, pain on eye movement, eyelid ery- thema, conjunctival injection, chemosis, swelling of the lac- rimal caruncle, and eyelid edema or fullness. If the patient had any of these signs or symptoms, one point was assigned for each item, with a total possible score between 0 and 7 points. GO severity was assessed by modified NOSPECS score and included soft tissue involvement, proptosis, and extraocular muscle (EOM) involvement. Each factor was separately graded and assessed, with the sum of the scores being equal to the total eye score (TES) (Table 1). The vi- sion of each patient was checked and optic nerves were ex- amined. If assessment revealed decreased vision and any disc swelling or pallor, or visual field defect or relative afferent pupillary defect (RAPD positive) was present, the patient was diagnosed with compressive optic neuropathy (ON).
Each clinical measurement was performed at a consistent time following blood sampling and TRAb levels deter- lapse,6 and GD treatment monitoring.8,9 Associated with
Graves’ disease is Graves’ orbitopathy (GO), an inflammato- ry condition affecting the orbit around the eye. The patho- genesis of the ocular involvement of GD is explained by the expression of TSH-R not only in the thyroid follicular cells but also in adipocytes, fibroblasts, and lymphocytes in the or- bit.1,10 Although the link between GD and GO is still un- clear,11,12 the close association between onset of GD and the development of GO suggests that GD and GO may have common pathogenic mechanisms.1 Thus, the idea that TRAb detection may be of clinical benefit in the assessment of thyroid eye disease makes the elucidation of the relation- ship between the autoantibodies and GO clinically valu- able.11-15
Currently, the techniques measuring TRAb are broadly di- vided into two categories: one is thyrotropin-binding inhibi- tor immunoglobulin (TBII) assay and the other is a function- al thyroid-stimulating immunoglobulin (TSI) bioassay.2 Since the development of TBII assay that quantifies serum TBII by exploiting the fact that the autoantibodies inhibit the binding of radiolabeled TSH to porcine thyroid membrane extract (1st generation TBII assay), many efforts have been made to improve this technique. These improvements to in- crease the sensitivity of the test include replacing the por- cine source of TSH-R with recombinant human TSH-R (2nd generation TBII assay); introduction and application of the human monoclonal thyroid-stimulating antibody M22 (la- beled with biotin or ruthenium); and TSH-R coated ELISA plate well (3rd generation TBII assay)3-5,16 The TSI bioassay measures the production of cyclic adenosine mono-phos- phate (cAMP) generated in response to the interaction be- tween TSH-R and TSI.14,15,17 This method, therefore, en- ables identification of the functional characteristics of TRAb.
However, this test is complicated to perform and involves considerable time and cost.2 Additionally, labs conducting this test must be equipped to maintain and grow cell lines with tissue culture facilities. The TSI bioassay has also been significantly changed. Early versions of the bioassay mea- sured the accumulation of 125I-labeled cAMP using a radio- immunoassay (RIA) kit. Recently, the bioassay has used cAMP luciferase data as the endpoint. Compared to cAMP RIA, cAMP luciferase is advantageous due to the simplicity of the technique and superior sensitivity.17 Cell culture pro- tocols have become much simpler and more effective over time, which is supported by the steady development of cell lines from a C6-18/wild type (wt) Chinese hamster ovary (CHO) cell line, to a K1/wt CHO cell line, finally creating
ry, and type of GD treatment, all of which may affect the clinical features of GO. An independent t-test was used to compare the mean autoantibody level between patients with and without ON. The statistical analyses were performed us- ing SAS (SAS Institute Inc. v.9.1.3., Cary, NC, USA) and p- value <0.05 was considered statistically significant.
RESULTS
Among the 155 patients, TRAb1st, TRAb3rd, and TSI were used to measure serum autoantibodies in 113, 111, and 62 patients, respectively. Mean subject age was 42.3±13.8 and the male/female ratio was 32 (20.6% male) : 123 (79.4%
female). Demographic and serological data are shown in Table 2. Most patients with GD (88.4%) had been medically treated with antithyroid drugs and the majority of subjects were biochemically in euthyroid state (85.8%). The duration of GO was an 18.0±16.0 month (range: 2-84 months).
TRAb and TSI positively correlate with GO clinical activity and severity
GO clinical activity was assessed using CAS and severity was assessed by modified NOSPECS score, including soft tissue involvement, proptosis, EOM involvement and TES.
Autoantibody levels measured by three different assays (TRAb1st, TRAb3rd, and Mc4-TSI bioassay) significantly positively correlated with both CAS (R=0.197, 0.200, 0.476, mined by all three assays were correlated with each clinical
parameter.
Assays for TRAb detection
1st generation TBII assay (TRAb1st) was performed using the Assay for Thyrotropin Receptor Autoantibodies Kit from RSR Ltd. (Cardiff, UK) according to the manufacturer’s in- structions. This kit consists of TSH receptor and 125I-labeled TSH. According to the manufacturer, this first generation assay is effective in detecting TRAb at concentrations ≥15 international units (IU)/L. TRAb was also measured with the 3rd generation TBII assay (TRAb3rd) using the automat- ed Cobas electrochemiluminescence (Elecsys, Roche Diag- nostics GmbH, Penzberg, Germany). The cut-off value for positivity using this system was 1.75 IU/L.
Cell-based TSI bioassay
Mc4-TSI in patient sera was measured with ThyretainTM TSI Reporter BioAssay (Diagnostic Hybrids, Inc., Athens, OH, USA) according to manufacturer instructions. The cells used for the assay were genetically engineered CHO cells, in which a chimeric human TSH-R (Mc4) was transfected. Amino ac- ids 262-335 of the human TSH-R were replaced with amino acids 261-329 of the rat lutropin-choriogonadotropin receptor to form the chimeric human TSH-R. Patient sera were incu- bated for approximately three hours with the CHO cell mono- layer and any TSI present binded to the chimeric receptors on the cell surface. TSI/TSH-R binding induces activation of adenylate cyclase and triggers a signaling cascade result- ing in increased intracellular cAMP. Intracellular cAMP then induces luciferase activity, which was measured as rel- ative light units (RLU) detected by a luminometer in tripli- cate wells. The resulting data was expressed as the speci- men-to-reference ratio (SRR) percent, which was calculated with the following equation:
SRR%=[(Average Test RLU)/(average reference control RLU)]×100%
Results were considered positive when SRR ≥140% of the reference control.
Data and statistical analysis
The relationship between GO patient autoantibody titer and GO activity/severity was assessed using Pearson correlation analysis. Multivariate regression analyses were conducted using GO clinical manifestations as the dependent variables and autoantibodies as the independent variables. Factors adjusted for included age, sex, smoking history, past histo-
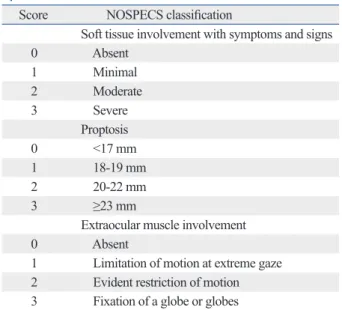
Table 1. Modified NOSPECS Score to Define Disease Sever- ity
Score NOSPECS classification
Soft tissue involvement with symptoms and signs 0 Absent
1 Minimal 2 Moderate 3 Severe
Proptosis 0 <17 mm 1 18-19 mm 2 20-22 mm 3 ≥23 mm
Extraocular muscle involvement 0 Absent
1 Limitation of motion at extreme gaze 2 Evident restriction of motion 3 Fixation of a globe or globes
Total eye score was the sum of soft tissue involvement, proptosis and extraocular muscle involvement score.
or TRAb3rd. The results of both TBII assays (TRAb1st and TRAb3rd) and TSI were also positively correlated with pro- ptosis (β=0.38, 0.34, and 0.33, respectively; p<0.05). The correlation coefficient between the results of the two TBII assays and proptosis were not different from that between the results of the TSI bioassay and proptosis. Interestingly, soft tissue and EOM involvement were positively correlat- ed with only the TSI results (β=0.31, 0.25, respectively, p<
0.05), and not the results of TRAb1st or TRAb3rd. TSI titers were significantly positively correlated with all clinical sever- ity parameters, including TES (β=0.39, p<0.05) (Table 4).
Vision and TSH-R autoantibodies
Compressive ON was diagnosed in 13 of the 155 patients (8.4%). Although no statistical significance was apparent between compressive ON and results of TRAb3rd and the TSI assay, patients with ON did have elevated autoantibod- ies (Table 5).
DISCUSSION
We investigated the relationship between TRAb levels as- sessed by two types of assays [TBII (TRAb1st and TRA- b3rd) and TSI bioassay] and GO activity/severity. Pearson correlation analyses determined that a significant correla- tion existed between all the autoantibody levels in all three assays and both CAS (R=0.197, 0.200, and 0.476) and pro- ptosis (R=0.413, 0.352, and 0.290). Multivariate regression analyses determined that TSI bioassay results were strongly positive correlated with all clinical scores of inflammatory activity and severity, including soft tissue involvement, pro- ptosis, and myopathy. Importantly, the correlation coeffi- cient between the TSI bioassay results and CAS (β=0.476) was more than 2-fold higher than those of the TRAb1st and TRAb3rd results (β=0.21 and 0.21, respectively), which supports the conclusion that the TSI bioassay is superior in assessing GO activity. Such strong relationship between TSI bioassay and GO activity was recently emphasized by Ponto, et al.19 The authors showed that all subjects with ac- tive GO were TSI bioassay positive, whereas only 84%
were TBII positive, and reported that chemosis was only ocular sign to predict TSI levels using multivariable regres- sion analysis.19
The TSI bioassay used in our study was the TSH-R lucif- erase reporter bioassay with Mc4-CHO cells, which is a novel technique.17,20 In 2010, Lytton, et al.13 suggested that respectively; p<0.05) and proptosis (R=0.413, 0.352, 0.290,
respectively; p<0.05). These correlations were determined by Pearson correlation analyses (Table 3).
Possible confounders, such as age, sex, smoking history, underlying disorders, and GO treatment modality11,12 were adjusted for by multivariate regression analyses (Table 4).
Regression analyses yielded significant positive correla- tions between CAS and autoantibody levels measured by TRAb1st, TRAb3rd, and Mc4-TSI [regression coefficient (β)=0.21, 0.21, and 0.46, respectively; p<0.05] (Table 4).
The correlation between the results of the TSI bioassay and CAS were stronger than those between CAS and TRAb1st Table 2. Demographic and Serological Data of Subjects En- rolled in This Study
Graves’ orbitopathy patients n=155
Age 42.3±13.8 (13-75)
Gender 123 females, 32 males
Smokers 33/155 (21.3%)
DM 8/155 (5.2%)
HTN 13/155 (8.4%)
Other autoimmune disease 6/155 (3.9%) Family history of thyroid disease 28/155 (18.1%) Therapy of Graves’ hyperthyroidism
Anti-thyroid drugs 137/155 (88.4%) Radioiodine therapy 8/155 (5.2%)
Thyroidectomy 5/155 (3.2%)
Peripheral thyroid function
Euthyroid (without treatment) 31/155 (20%) Euthyroid (with ongoing treatment) 102/155 (65.8%) Hyperthyroid (although treatment) 22/155 (14.2%) Duration of GO (months) 18.0±16.0 (2-84)
CAS of GO 2.0±1.7 (0-7)
TES of GO 3.0±1.9 (1-9)
Active GO (CAS ≥3) 53/155 (34.2%)
Sight-threatening GO 13/155 (8.4%) Previous steroid therapy of GO 51/155 (32.9%) Thyroid autoantibodies
TRAb1st (unit/L) 46.88±24.80
(2.96-100.00)
TRAb3rd (IU/L) 12.35±12.57
(0.33-40.00)
TSI (SRR) % 429.90±211.21
(54.20-1053.80) CAS, clinical activity score; DM, diabetes mellitus; GO, Graves’ orbitopa- thy; HTN, hypertension; SRR, specimen to reference ratio; TES, total eye score; TSI, thyroid-stimulating immunoglobulin.
TRAb1st: 1st generation thyrotropin-binding inhibitory immunoglobulin (TBII) assay.
TRAb3rd: 3rd generation TBII assay.
Data are presented as mean±standard deviation (range), unless otherwise indicated.
CHO TSI bioassay were associated with all factors related to GO severity, including soft tissue involvement, propto- sis, EOM involvement and TES (β=0.31, 0.33, 0.25, and 0.39, respectively; p<0.05 by multivariate regression analy- sis). Interestingly, we found that the correlation coefficients between the TBII assay results and proptosis (TRAb1st, β=0.38; TRAb3rd, β=0.34) were not different from that of the correlation between the TSI bioassay results and pro- ptosis (β=0.33). As the key event in GO pathogenesis is the transference of orbital fibroblasts to adipocytes,1,21,22 the the results of the Mc4-CHO TSI bioassay are functional in-
dicators of GO activity and severity, as they yielded a stron- ger positive correlation between TSI results and GO activi- ty/severity. However, these authors assessed the relationship between TSI and GO severity only using the clinical severi- ty score, which is equal to the sum of each severity class.13 In the present study, we investigated GO severity with greater specificity by considering each subset of GO severi- ty separately using a modified NOSPECS scoring system.
Using this method, we found that the results of the Mc4-
Table 3. Pearson Correlation of TSH-Receptor Autoantibody (TRAb) Levels with Associated Clinical Manifestations of Graves’
Orbitopathy
TRAb1st TRAb3rd TSI (SRR) %
R p value R p value R p value
CAS 0.197* 0.036* 0.200* 0.034* 0.476* <0.001*
Soft -0.085 0.369 0.097 0.310 0.290* 0.022*
Propto 0.413* <0.001* 0.352* <0.001* 0.290* 0.022*
EOM -0.065 0.491 0.111 0.244 0.271 0.090
TES 0.134 0.156 0.255* 0.007* 0.351* 0.005*
CAS, clinical activity score; EOM, extraocular muscle involvement; Propto, proptosis; R, correlation coefficient; Soft, soft tissue involvement; SRR, speci- men to reference ratio; TES, total eye score; TSI, thyroid-stimulating immunoglobulin; TSH, thyroid-stimulating hormone.
TRAb1st: 1st generation thyrotropin-binding inhibitory immunoglobulin (TBII) assay.
TRAb3rd: 3rd generation TBII assay.
*Significant p value (p<0.05 is considered statistically significant).
Table 5. Comparison of TSH-Receptor Autoantibody (TRAb) Levels between Graves’ Orbitopathy Patients With and Without Optic Neuropathy
TRAb1st TRAb3rd TSI Number
No ON (mean±SD) 47.40±24.54 11.76±12.10 416.62±197.31 142 (91.6%)
ON (mean±SD) 41.49±28.19 24.12±15.28 691.03±352.36 13 (8.4%)
p value* 0.536 0.077 0.309 155 (100%)
ON, optic neuropathy; SD, standard deviation; TSI, thyroid-stimulating immunoglobulin; TSH, thyroid-stimulating hormone.
TRAb1st: 1st generation thyrotropin-binding inhibitory immunoglobulin (TBII) assay.
TRAb3rd: 3rd generation TBII assay.
*Independent t-test was used for statistical analysis.
Table 4. Multivariate Regression Analyses of TSH-Receptor Autoantibody (TRAb) Levels and Clinical Manifestations of Graves’ Orbitopathy
TRAb1st TRAb3rd TSI (SRR) %
β p value* β p value* β p value*
CAS 0.21† 0.018† 0.21† 0.032† 0.46† <0.001†
Soft -0.05 0.552 0.10 0.270 0.31† 0.011†
Propto 0.38† <0.001† 0.34† <0.001† 0.33† 0.015†
EOM 0.01 0.918 0.16 0.051 0.25† 0.025†
TES 0.17 0.058 0.28† 0.002† 0.39† 0.002†
CAS, clinical activity score; EOM, extraocular muscle involvement; Propto, proptosis; β, regression coefficient; Soft, soft tissue involvement; SRR, speci- men to reference ratio; TES, total eye score; TSI, thyroid-stimulating immunoglobulin; TSH, thyroid-stimulating hormone.
TRAb1st: 1st generation thyrotropin-binding inhibitory immunoglobulin (TBII) assay.
TRAb3rd: 3rd generation TBII assay.
*Adjusted for age, sex, smoking, underlying disease, hyperthyroidism treatment modality.
†Significant p value (p<0.05 is considered statistically significant).
REFERENCES
1. Khoo TK, Bahn RS. Pathogenesis of Graves’ ophthalmopathy: the role of autoantibodies. Thyroid 2007;17:1013-8.
2. Kamath C, Adlan MA, Premawardhana LD. The role of thyrotro- phin receptor antibody assays in graves’ disease. J Thyroid Res 2012;2012:525936.
3. Michalek K, Morshed SA, Latif R, Davies TF. TSH receptor auto- antibodies. Autoimmun Rev 2009;9:113-6.
4. Massart C, Sapin R, Gibassier J, Agin A, d’Herbomez M. Inter- method variability in TSH-receptor antibody measurement: impli- cation for the diagnosis of Graves disease and for the follow-up of Graves ophthalmopathy. Clin Chem 2009;55:183-6.
5. Costagliola S, Morgenthaler NG, Hoermann R, Badenhoop K, Struck J, Freitag D, et al. Second generation assay for thyrotropin receptor antibodies has superior diagnostic sensitivity for Graves’
disease. J Clin Endocrinol Metab 1999;84:90-7.
6. Maugendre D, Massart C. Clinical value of a new TSH binding inihibitory activity assay using human TSH receptors in the fol- low-up of antithyroid drug treated Graves’ disease. Comparison with thyroid stimulating antibody bioassay. Clin Endocrinol (Oxf) 2001;54:89-96.
7. Vos XG, Smit N, Endert E, Tijssen JG, Wiersinga WM. Frequency and characteristics of TBII-seronegative patients in a population with untreated Graves’ hyperthyroidism: a prospective study. Clin Endocrinol (Oxf) 2008;69:311-7.
8. Tada H, Mizuta I, Takano T, Tatsumi KI, Izumi Y, Hidaka Y, et al.
Blocking-type anti-TSH receptor antibodies and relation to re- sponsiveness to antithyroid drug therapy and remission in Graves’
disease. Clin Endocrinol (Oxf) 2003;58:403-8.
9. Kamijo K, Murayama H, Uzu T, Togashi K, Kahaly GJ. A novel bioreporter assay for thyrotropin receptor antibodies using a chi- meric thyrotropin receptor (mc4) is more useful in differentiation of Graves’ disease from painless thyroiditis than conventional thy- rotropin-stimulating antibody assay using porcine thyroid cells.
Thyroid 2010;20:851-6.
10. Saravanan P, Dayan CM. Thyroid autoantibodies. Endocrinol Metab Clin North Am 2001;30:315-37.
11. Goh SY, Ho SC, Seah LL, Fong KS, Khoo DH. Thyroid autoanti- body profiles in ophthalmic dominant and thyroid dominant Graves’ disease differ and suggest ophthalmopathy is a multianti- genic disease. Clin Endocrinol (Oxf) 2004;60:600-7.
12. Eckstein AK, Plicht M, Lax H, Neuhäuser M, Mann K, Lederbo- gen S, et al. Thyrotropin receptor autoantibodies are independent risk factors for Graves’ ophthalmopathy and help to predict sever- ity and outcome of the disease. J Clin Endocrinol Metab 2006;91:
3464-70.
13. Lytton SD, Ponto KA, Kanitz M, Matheis N, Kohn LD, Kahaly GJ. A novel thyroid stimulating immunoglobulin bioassay is a functional indicator of activity and severity of Graves’ orbitopathy.
J Clin Endocrinol Metab 2010;95:2123-31.
14. Gerding MN, van der Meer JW, Broenink M, Bakker O, Wiersin- ga WM, Prummel MF. Association of thyrotrophin receptor anti- bodies with the clinical features of Graves’ ophthalmopathy. Clin Endocrinol (Oxf) 2000;52:267-71.
15. Dragan LR, Seiff SR, Lee DC. Longitudinal correlation of thy- roid-stimulating immunoglobulin with clinical activity of disease in thyroid-associated orbitopathy. Ophthal Plast Reconstr Surg
clinical sign best reflecting this adipogenesis is propto-
sis.21,23 Therefore, among the GO severity subclasses, it
may be assumed that TRAb levels are principally related to proptosis. The results of TRAb1st, the oldest conventional TBII assay, were associated with proptosis at a similar or even higher performance level compared to the results of TRAb3rd or the TSI bioassay.
Proptosis can arise from not only an increase in fat vol- ume but also an increase in muscle volume.21 Regensburg, et al.21 reported that an increase in muscle volume was as- sociated with higher TBII values and impaired motility in GO patients. In contrast, Noh, et al.24 reported that TBII levels were lower in GD patients with EOM enlargement compared to GD patients without GO. These incongruous results may be explained by the fact that the subjects of the two studies were of different races. The article by Eck- stein, et al.25 has mentioned that TSI might have superior clinical meaning in Asians rather than Caucasians since TSI are less prevalent in white patient. In the present study, which included only Asian subjects, results from two types of TBII assays were not associated with EOM involvement.
In contrast, the results of the TSI bioassay were associated with EOM limitation. These data suggest that the TSI bioas- say may be able to yield additional information, particularly in evaluating GO muscle involvement in Asians.
Because patients exhibit a heterogeneous clinical course, GO is difficult to assess and manage. Unfortunately, no reli- able, specific medical treatment is yet available. It is also difficult to predict which patients with GD are affected by severe GO with respect to proptosis and myopathy. TBII measurements would be sufficient for patient follow-up with proptosis without muscle enlargement, as all three autoanti- body assays demonstrated the same association with pro- ptosis. Nevertheless, TSI would be extremely beneficial to evaluate patients with active inflammation or muscle re- striction due to GO. Further investigation is needed to vali- date the clinical relevance of the Mc4-CHO TSI bioassay in terms of monitoring disease over time and GO prognostic assessment.
ACKNOWLEDGEMENTS
This research was supported by Basic Science Research Program through the National Research Foundation of Ko- rea (NRF) funded by the Ministry of Education, Science and Technology (grant numbers: 2011-10204).
Mourits MP. Do subtypes of graves’ orbitopathy exist? Ophthal- mology 2011;118:191-6.
22. Eckstein AK, Johnson KT, Thanos M, Esser J, Ludgate M. Cur- rent insights into the pathogenesis of Graves’ orbitopathy. Horm Metab Res 2009;41:456-64.
23. Peyster RG, Ginsberg F, Silber JH, Adler LP. Exophthalmos caused by excessive fat: CT volumetric analysis and differential diagnosis. AJR Am J Roentgenol 1986;146:459-64.
24. Noh JY, Hamada N, Inoue Y, Abe Y, Ito K, Ito K. Thyroid-stimu- lating antibody is related to Graves’ ophthalmopathy, but thyrotro- pin-binding inhibitor immunoglobulin is related to hyperthyroid- ism in patients with Graves’ disease. Thyroid 2000;10:809-13.
25. Eckstein AK, Lösch C, Glowacka D, Schott M, Mann K, Esser J, et al. Euthyroid and primarily hypothyroid patients develop milder and significantly more asymmetrical Graves ophthalmopathy. Br J Ophthalmol 2009;93:1052-6.
2006;22:13-9.
16. Kamijo K, Ishikawa K, Tanaka M. Clinical evaluation of 3rd gen- eration assay for thyrotropin receptor antibodies: the M22-biotin- based ELISA initiated by Smith. Endocr J 2005;52:525-9.
17. Lytton SD, Kahaly GJ. Bioassays for TSH-receptor autoantibod- ies: an update. Autoimmun Rev 2010;10:116-22.
18. Mourits MP, Prummel MF, Wiersinga WM, Koornneef L. Clinical activity score as a guide in the management of patients with Graves’ ophthalmopathy. Clin Endocrinol (Oxf) 1997;47:9-14.
19. Ponto KA, Kanitz M, Olivo PD, Pitz S, Pfeiffer N, Kahaly GJ.
Clinical relevance of thyroid-stimulating immunoglobulins in graves’ ophthalmopathy. Ophthalmology 2011;118:2279-85.
20. Lytton SD, Li Y, Olivo PD, Kohn LD, Kahaly GJ. Novel chimeric thyroid-stimulating hormone-receptor bioassay for thyroid-stimu- lating immunoglobulins. Clin Exp Immunol 2010;162:438-46.
21. Regensburg NI, Wiersinga WM, Berendschot TT, Potgieser P,