실내 모형실험을 통한 토석류 흐름 특성 연구
유국현, 장형준*, 이호진
충북대학교 토목공학부
A Study on the Flow Characteristics of Debris Flow Using
Small-scaled Laboratory Test
Kukhyun Ryou, Hyungjoon Chang*, Hojin Lee
School of Civil Engineering, Chungbuk National University
요 약 최근 기후변화의 영향으로 집중호우의 발생빈도가 증가하여 많은 양의 토석류가 발생하고 있다. 본 연구의 목적 은 수로경사와 토사체적농도의 변화에 따른 토석류의 흐름 특성을 파악하고, 소단의 설치가 토석류 흐름 특성에 미치는 영향을 분석하는 것이다. 본 연구에서는 실내 모형실험을 통해 토석류의 흐름 특성 중 유속, 흐름 깊이, Froude 수, 흐름 저항계수를 산정하였으며, 소단의 영향을 확인하기 위해 소단을 설치하지 않은 직선수로와 소단을 설치한 1단 수로의 실험결과를 비교하였다. 실험결과, 수로경사가 토석류의 유속과 흐름 깊이에 영향을 미치는 것을 확인하였으며, 토사체 적농도가 토석류의 유속, 흐름 깊이, Froude 수 및 흐름 저항계수에 영향을 미치는 것을 확인하였다. 또한, 소단을 설치 함에 따라 토석류의 유속과 흐름 깊이가 최대 26.1%, 71.2%씩 감소하는 것을 확인하였다. 이는 소단을 설치하는 것이 토석류의 유속을 감소시켜 토석류의 이동성과 운동에너지를 감소시키는 것을 의미한다. 본 연구의 결과는 토석류의 흐름 특성을 파악하는 데 유용한 정보를 제공하며, 사면에서 소단의 효용성에 대한 정보를 제공한다.
Abstract Recently, the frequency of torrential rain is increasing due to climate change, which causes a large amount of debris flows. The purpose of this study was to understand the flow characteristics of debris flow according to the change in channel slope and volumetric sediment concentration and to analyze the effects of a berm on the flow characteristics of debris flow. The flow characteristics of debris flow, such as flow velocity, flow depth, Froude number, and flow resistance coefficients, were calculated using laboratory tests. The effect of a berm was analyzed by comparing the experimental results of a linear channel with those of a one-stepped channel. The results showed that the channel slope affected the flow velocity and flow depth, and the volumetric sediment concentration affected the flow velocity and flow depth, Froude number, and flow resistance coefficient. Moreover, as a berm was installed, the flow velocity and flow depth decreased by up to 26.1% and 71.2%, respectively. This means that installing a berm reduces the flow velocity, thereby reducing the mobility and kinetic energy. These results provide useful information to understand better the flow characteristics of debris flow and the effectiveness of a berm.
Keywords : Debris Flow, Flow Characteristic, Volumetric Sediment Concentration, Berm, Flow Resistance Coefficient
이 논문은 2017년도 정부(교육부)의 재원으로 한국연구재단의 지원을 받아 수행된 기초연구사업(NRF-2017R1D1A3B03035477)과 2019년도 정부(교육부)의 재원으로 한국연구재단의 지원을 받아 수행된 기초연구사업임(NRF-2019R1A6A3A01096145).
*Corresponding Author : Hyungjoon Chang(Chungbuk National Univ.) email: [email protected]
Received January 15, 2021 Revised February 22, 2021 Accepted April 2, 2021 Published April 30, 2021
1. 서론
최근 기후변화에 따른 집중호우의 발생빈도 증가로 다 량의 토석류가 발생하고 있으며, 이는 상당한 인명 및 재 산피해를 야기하고 있다. 우리나라에서는 2011년 도시 인접지인 우면산에서 토석류가 발생해 심각한 피해를 초 래하였다. 이 사건으로 토석류 대책구조물의 필요성이 증 가하였으며, 토석류 정책수립의 방향이 산지에서 도시지 역으로 확대되었다[1]. 또한, 2020년에는 태풍 장미, 바비, 마이삭, 하이선 등이 우리나라에 영향을 미치며 1343ha 의 산지토사재해가 발생하였으며, 이는 2011년 발생한 산지토사재해 824ha의 1.6배를 초과하는 값이다[2]. 산 지토사재해는 자연사면에서 발생하는 산사태와 토석류를 말하며, 토석류는 국내 산지토사재해의 대부분을 차지한 다[3]. 토석류는 강우, 태풍, 융설, 지진 등 다양한 원인에 기인하여 발생하지만[4], 우리나라에서 발생한 토석류의 주된 원인은 강우인 것으로 확인되었다[5]. 이처럼 매년 발생하는 집중호우는 국토의 60% 이상이 산지인 우리나 라에서 토석류를 발생시킬 가능성이 크기 때문에 이에 대한 대책을 마련할 필요가 있다. 토석류는 점토에서부터 전석까지 다양한 입경의 토사와 물로 구성된 혼합물이며, 중력의 영향을 받아 하류로 유동하며 심각한 인명 및 재 산피해를 초래할 수 있는 질량 이동현상이다[6].
토석류에 의한 피해를 저감하고 토석류의 거동 및 메 커니즘을 파악하기 위하여 모형실험 또는 수치해석을 기 반으로 한 연구들이 수행되었다. Zhou et al.[7]은 토사 체적농도, 수로경사 및 입도분포가 토석류의 퇴적 메커니 즘과 퇴적형태에 미치는 영향을 분석하였으며, Chen et al.[8]은 이동경로상의 유목의 축적 및 붕괴에 따른 토석 류의 유출 특성을 분석하였다. de Haas et al.[9]은 토석 류의 발생량과 구성재료가 토석류의 퇴적에 미치는 영향 을 분석하였으며, 토석류의 퇴적이 수중에서 일어난 경우 와 지면에서 일어난 경우를 비교하였다. Jiang et al.[10]
은 수평 투과 구조물의 간격 및 경사가 입자 분리의 효율 에 미치는 영향을 분석하였으며, Jun et al.[11]은 사면 경사, 사면길이, 지층두께 및 강우강도 변화에 따른 토석 류의 퇴적형상을 분석하였다. Baselt et al.[12]은 다양 한 입경, 토사체적농도 및 하상조도를 고려하여 모형실험 을 수행하였으며, 흐름 깊이와 전단부의 유속 및 형상을 관측하였다. Kim et al.[13]은 모형실험을 통해 함수비 의 변화에 따른 토석류의 확산 형태 및 흐름 속도를 분석 하였으며, Kim et al.[14]은 유동역학적 물성실험 및 수 치해석을 통해 함수비 변화에 따른 유속 및 흐름 깊이를
분석하였다.
소단은 긴 사면을 나누어 각 경사면의 토양 침식을 감 소시키고, 토석류의 유속을 감소시키는 구조물이다[15].
최근 여러 연구자들이 토석류 피해를 저감하기 위한 대 책으로 소단 또는 계단형 수로를 고려한 연구를 발표하 였다. Kim et al.[16]은 수치모의를 통해 소단의 길이와 토석류의 공급유량 변화에 따른 토석류의 유량 및 토사 체적농도를 분석하였으며, Korea Forest Service[17]는 토사유출을 방지하고 우수를 분산시키기 위한 대책으로 소단을 소개하였으며, 효과적인 소단의 폭을 제안하였다.
Lee et al.[18]은 수치모의를 통해 소단의 위치와 토석류 의 공급유량 변화에 따른 토석류의 유량 및 토사체적농 도를 분석하였으며, Li et al.[19]은 정규화된 Bingham 모형에 대한 3차원 SPH(Smoothed Particle Hydrodynamics) 방법을 도입하여 계단형 수로에서의 토석류 충격거동을 분석하였다.
국내의 토석류 대책구조물 관련 연구는 사방댐을 중심 으로 수행되고 있어 연구의 범위가 제한적이다. Highland and Bobrowsky[20]는 사방댐이 먼 거리를 이동하는 수 로형 토석류를 제어하는 데 적합하다고 하였으며, 시공비 가 많이 들기 때문에 주요 시설물의 방호에 제한적으로 사용할 것을 권장하였다. 따라서 본 연구에서는 토석류 피해를 저감하기 위한 구조적 대책으로 소단을 고려하였 으며, 실내 모형실험을 통해 수로경사와 토사체적농도의 변화에 따른 토석류의 흐름 특성 및 소단의 효용성을 분 석하였다.
2. 이론
2.1 토석류의 유속토석류의 유속은 충격력과 퇴적 특성에 영향을 미치기 때문에 토석류의 위험도 산정 및 대책구조물 설계에 필 수적으로 고려해야 할 흐름 특성이다. 토석류의 유속은 현장 또는 모형실험을 통해 관측하거나 유속 추정식을 통해 추정한다. 토석류 유속 추정의 기본식은 Eq. (1)과 같이 나타낼 수 있다.
(1)
Where, v denotes flow velocity, C denotes flow resistance coefficient, h denotes flow depth, S denotes channel slope, a and b denote exponential factors according to flow characteristics
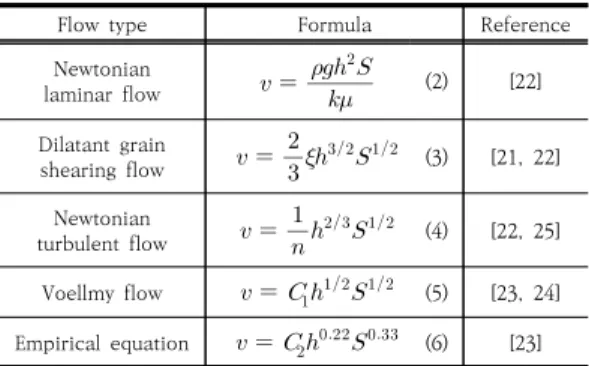
Eq. (1)을 토대로 여러 연구자들이 현장관측, 모형실 험 및 수치해석 등을 수행하여 토석류 유속 추정식을 제 안하였으며[21-25], Table 1은 흐름 유형에 따른 토석 류 유속 추정식 Eq. (2)-(6)을 나타내고 있다.
Flow type Formula Reference
Newtonian
laminar flow
(2) [22]
Dilatant grain
shearing flow
(3) [21, 22]
Newtonian
turbulent flow
(4) [22, 25]
Voellmy flow (5) [23, 24]
Empirical equation (6) [23]
Where, ρ denotes density of mixed sample, g denotes gravitational acceleration, k denotes cross-sectional shape coefficient (k is equal to 3 for a wide rectangular channel, 5 for a trapezoidal channel, and 8 for a semicircular channel), μ denotes the apparent dynamic viscosity of debris flow, ξ denotes lumped coefficients depending on volumetric sediment concentration, n denotes Manning coefficient, C1 denotes Chezy coefficient, C2 denotes empirical coefficient proposed by Koch[23]
Table 1. Equations for estimating the mean velocity of debris flow
2.2 Froude 수
토석류는 중력의 영향을 받아 하류로 유동하는 동적 현상이므로 물리적으로 중력에 대한 관성력의 비를 의미 하는 Froude 수를 이용해 상사를 적용해야 한다.
Froude 수는 Eq. (7)과 같이 나타낼 수 있다.
(7) Where, Fr denotes Froude number, vp and vm
denote the flow velocity of the prototype and model respectively, gp and gm denote the gravitational acceleration of the prototype and model respectively, hp and hm denote the flow depth of the prototype and model respectively
3. 실험재료 및 방법
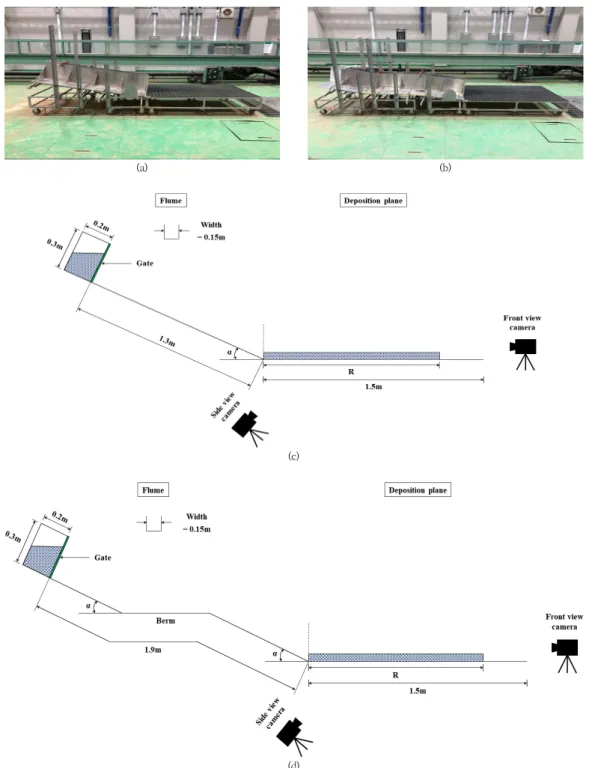
3.1 토석류 실험장치본 연구에서 모형실험에 활용한 실험장치는 Fig. 1과
같으며, 실험장치의 특성상 소단의 길이 및 공급유량에 관한 다양한 실험조건을 고려하는 데 한계성을 지니고 있다. Fig. 1(a)와 Fig. 1(c)는 각각 소단을 설치하지 않 은 직선 수로의 사진과 모식도를 나타내며, Fig. 1(b)와 Fig. 1(d)는 각각 소단을 설치한 1단 수로의 사진과 모식 도를 나타낸다. R은 퇴적부에서의 토석류 도달거리, α는 수로경사를 의미한다. 실험장치는 실험유형에 따라 길이 1.3-1.9 m, 폭 0.15 m, 높이 0.3 m의 제원으로 구성하 였다. Lee et al.[18]의 연구에 착안하여 경사면 상판과 경사면 하판 사이에 소단의 설치를 고려하였으며, 각각의 실험장치를 분리할 수 있도록 제작하였다. 본 연구에 활 용한 소단은 길이 0.6 m, 폭 0.15 m의 제원을 갖는다.
또한, 토석류의 흐름 특성인 유속과 흐름 깊이를 관측하 기 위해 정면과 측면에 60 fps의 동영상 촬영이 가능한 카메라를 설치하였다. 정면부 카메라는 수로에서의 토석 류 유하시간을 관측하는 데 활용하였으며, 측면부 카메라 는 토석류의 흐름 깊이를 관측하는 데 활용하였다. 흐름 깊이는 수로의 유출구에서 수로방향으로 0.1 m 떨어진 지점에서 관측하였다.
3.2 토석류 실험조건
토석류는 토사-물 혼합물이기 때문에 점성을 직접 측 정하기 어렵다. 본 연구에서는 Takahashi[6]가 제안한 토사체적농도의 개념을 이용하여 간접적으로 토석류의 점성을 고려하였다. 토사체적농도는 토석류 총 체적에 대 한 토사 체적의 비를 나타낸다.
본 연구에서 수행한 모형실험의 조건은 토석류의 거동 및 메커니즘을 분석한 연구[1, 26-28]를 참고하여 구성 하였다. 수로경사, 토사체적농도 및 소단의 설치 유무를 고려하여 실험조건을 구성하였다(Table 2). 수로경사는 10°-25°로 구성하였으며, 5° 간격으로 조절하였다. 토사 체적농도는 40%-60%로 구성하였고, 10% 간격으로 조 절하였다. 또한, 실험유형은 직선 수로실험과 1단 수로실 험으로 구성하였다. 총 24개의 실험조건으로 구성하였으 며, 실험의 재현성을 높이고자 각각의 실험조건을 5회씩 수행하였다.
또한, 혼합시료는 실험규모가 유사한 모형실험 연구 [27, 29]을 참고하여 구성하였다. 체분석 시험을 통해 혼 합시료의 입도분포를 확인한 결과(Fig. 2), 대부분 모래 와 자갈로 구성된 것을 확인하였다. Table 3은 토사체적 농도별 혼합시료의 중량을 나타내며, CV는 토사체적농도 를 의미한다. 혼합시료의 체적은 4500 cm3이며, 밀도는 실험조건에 따라 1578-1867 kgm-3의 범위를 보였다.
(a) (b)
(c)
(d)
Fig. 1. Experimental setups for laboratory tests. (a) Image of the linear channel test, (b) Image of the one-stepped channel test, (c) Schematic diagram of the linear channel test, (d) Schematic diagram of the one-stepped channel test
Test type Linear
channel test One-stepped channel test Channel slope (°) 10 15 20 25 10 15 20 25
Volumetric sediment concentration (%)
40 40 40 40 40 40 40 40 50 50 50 50 50 50 50 50 60 60 60 60 60 60 60 60 Table 2. Experimental cases of this study
0.01 0.1 1 10
0 20 40 60 80 100
Percent passing (%)
Particle size (mm)
Fig. 2. Particle size distribution curve of the mixed sample
CV
Sediment (kg) Water
(kg) ρ
(kgm-3)
< 2mm 2-5 mm 5-10 mm
0.4 2.200 1.100 1.100 2.700 1578
0.5 2.750 1.375 1.375 2.250 1722
0.6 3.300 1.650 1.650 1.800 1867
Table 3. Weight of mixed sample by volumetric sediment concentration
3.3 실험방법
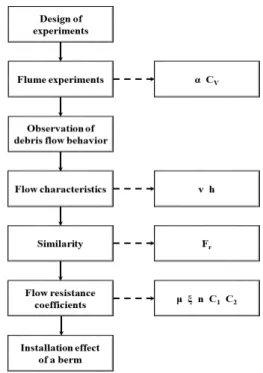
Fig. 3은 본 연구에서 수행한 모형실험의 모식도를 나 타낸다. 먼저 시료통에 실험조건별 혼합시료를 조성한 후, 시료통의 분리벽을 빠르게 제거하여 토석류를 수로에 공급하였으며, 토석류의 유속과 흐름 깊이를 관측하였다.
유속과 흐름 깊이를 이용하여 Froude 수와 흐름 저항계 수를 산정하였으며, 소단의 설치에 따른 흐름 특성의 변 화를 분석하였다.
Fig. 3. Flow chart of model tests
4. 실험결과 및 분석
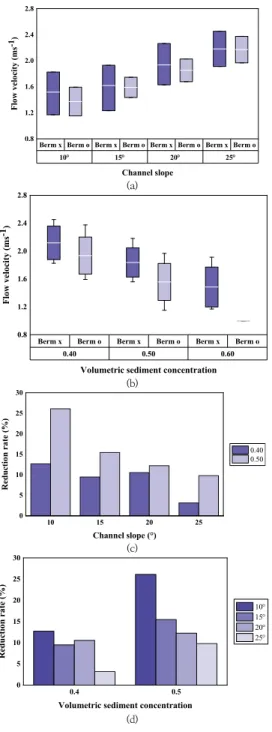
4.1 토석류의 유속Fig. 4는 토석류 모형실험을 통해 관측한 유속 및 소 단의 설치에 따른 유속의 감소율을 나타낸다. Fig. 4(a) 는 수로경사의 변화에 따른 토석류의 유속을 나타내며, Fig. 4(b)는 토사체적농도의 변화에 따른 토석류의 유속 을 나타낸다. 토석류의 유속은 수로경사가 커질수록 증가 하였으며, 토사체적농도가 높아질수록 감소하는 경향을 보였다. 또한 1단 수로실험의 경우, 토사체적농도가 0.60 이 되면 토석류가 유출구에 도달하지 못하고 수로에 정 지하였다.
Fig. 4(c)는 소단에 의한 토석류 유속의 감소율을 수로 경사에 따라 나타낸 것이며, Fig. 4(d)는 소단에 의한 토 석류 유속의 감소율을 토사체적농도에 따라 나타낸 것이 다. 토석류의 유속은 소단을 설치함에 따라 3.2%-26.1%
범위로 감소하는 것을 확인하였다. 소단의 설치에 따른 토석류 유속의 평균 감소율은 토사체적농도가 0.40, 0.50일 때 9.0%, 15.9%로 나타났으며, 수로경사가 10°, 15°, 20°, 25°일 때 19.4%, 12.5%, 11.4%, 6.5%로 나타 났다. 즉, 토석류 유속의 평균 감소율은 수로경사가 작고 토사체적농도가 높을수록 증가하는 경향을 보였다.
Berm x Berm o Berm x Berm o Berm x Berm o Berm x Berm o
10 15 20 25
0.8 1.2 1.6 2.0 2.4 2.8
Channel slope
Flow velocity (ms-1)
(a)
Berm x Berm o Berm x Berm o Berm x Berm o
0.40 0.50 0.60
0.8 1.2 1.6 2.0 2.4 2.8
Volumetric sediment concentration Flow velocity (ms-1)
(b)
10 15 20 25
0 5 10 15 20 25 30
Reduction rate (%)
Channel slope (°)
0.40 0.50
(c)
0.4 0.5
0 5 10 15 20 25 30
Reduction rate (%)
Volumetric sediment concentration
10
15
20
25
(d)
Fig. 4. Flow velocity and reduction rate of flow velocity. (a) Flow velocity according to channel slope, (b) Flow velocity according to volumetric sediment concentration, (c) Reduction rate of flow velocity according to channel slope, (d) Reduction rate of flow velocity according to volumetric sediment concentration
4.2 토석류의 흐름 깊이
Berm x Berm o Berm x Berm o Berm x Berm o Berm x Berm o
10 15 20 25
0.000 0.005 0.010 0.015 0.020 0.025
Channel slope
Flow depth (m)
(a)
Berm x Berm o Berm x Berm o Berm x Berm o
0.40 0.50 0.60
0.000 0.005 0.010 0.015 0.020 0.025
Volumetric sediment concentration
Flow depth (m)
(b)
10 15 20 25
-20 0 20 40 60 80
Reduction rate (%)
Channel slope (°)
0.40 0.50
(c)
0.4 0.5
-20 0 20 40 60 80
Reduction rate (%)
Volumetric sediment concentration
10
15
20
25
(d)
Fig. 5. Flow depth and reduction rate of flow depth.
(a) Flow depth according to channel slope, (b) Flow depth according to volumetric sediment concentration, (c) Reduction rate of flow depth according to channel slope, (d) Reduction rate of flow depth according to volumetric sediment concentration
Fig. 5는 토석류 모형실험을 통해 관측한 흐름 깊이 및 소단의 설치에 따른 흐름 깊이의 감소율을 나타낸다.
Fig. 5(a)는 수로경사의 변화에 따른 토석류의 흐름 깊이 를 나타내며, Fig. 5(b)는 토사체적농도의 변화에 따른 토석류의 흐름 깊이를 나타낸다. 토석류의 흐름 깊이는 토사체적농도가 높아질수록 감소하였지만, 수로경사의 변화에 따라서는 소단의 설치 유무에 따라 다른 경향을 보였다.
토석류의 흐름 깊이는 직선 수로에서 수로경사가 커질 수록 감소하였지만, 1단 수로에서는 수로경사가 20°일 때 흐름 깊이의 최댓값이 감소하였다가 수로경사가 25°
일 때 증가하는 등 일관된 변화양상을 보이지 않았다. 이 는 소단을 설치할 경우, 소단의 길이와 공급유량의 변화 에 따라 흐름이 급변하여 튐 흐름(splash flow) 및 유수 이탈현상이 발생할 수 있기 때문이다[30, 31].
또한, 1단 수로에서 토사체적농도가 0.50일 때 Costa[4]
와 Jun et al.[32]이 언급한 토석류의 퇴적 발생경사인 15°보다 수로경사가 작아지면 흐름이 거의 발달하지 않 았고, 토사체적농도가 0.60일 때는 토석류가 수로에 정 지하였다.
Fig. 5(c)는 소단에 의한 토석류 흐름 깊이의 감소율을 수로경사에 따라 나타낸 것이며, Fig. 5(d)는 소단에 의 한 토석류 흐름 깊이의 감소율을 토사체적농도에 따라 나타낸 것이다. 토석류의 흐름 깊이는 수로경사가 25°이 고 토사체적농도가 0.40일 때 소단을 설치함에 따라 15.6% 증가하였다. 이를 제외하면 토석류의 흐름 깊이는 소단을 설치함에 따라 14.9%-71.2% 범위로 감소하였다.
소단의 설치에 따른 토석류 흐름 깊이의 평균 감소율은 토사체적농도가 0.40, 0.50일 때 39.1%, 44.4%로 나타 났으며, 수로경사가 10°, 15°, 20°일 때 36.9%, 56.8%, 42.6%로 나타났다. 즉, 토석류 흐름 깊이의 평균 감소율 은 토사체적농도가 높을수록 증가하는 경향을 보였다.
4.3 Froude 수
Froude 수는 토석류 모형실험을 통해 관측한 유속 및 흐름 깊이를 Eq. (7)에 대입하여 산정하였으며, 본 연구 에서 산정한 Froude 수는 4.14-10.79의 범위를 보였다.
Fig. 6은 Froude 수 및 소단의 설치에 따른 Froude 수 의 증가율을 나타낸다. Fig. 6(a)는 수로경사의 변화에 따른 Froude 수를 나타내며, Fig. 6(b)는 토사체적농도 변화에 따른 Froude 수를 나타낸다. Froude 수는 토사 체적농도가 높아질수록 증가하였지만, 수로경사에 따라
Berm x Berm o Berm x Berm o Berm x Berm o Berm x Berm o
10 15 20 25
3 6 9 12
Channel slope
Froude number
(a)
Berm x Berm o Berm x Berm o Berm x Berm o
0.40 0.50 0.60
3 6 9 12
Volumetric sediment concentration
Froude number
(b)
10 15 20 25
-20 0 20 40 60 80
Rate of increase (%)
Channel slope (°)
0.40 0.50
(c)
0.4 0.5
-20 0 20 40 60 80
Rate of increase (%)
Volumetric sediment concentration
10
15
20
25
(d)
Fig. 6. Froude number and Increase rate of Froude number. (a) Froude number according to channel slope, (b) Froude number according to volumetric sediment concentration, (c) Increase rate of Froude number according to channel slope, (d) Increase rate of Froude number according to volumetric sediment concentration
서는 소단의 설치 유무에 따라 다른 경향을 보였다. Froude 수는 직선 수로에서 수로경사가 커질수록 증가하였지만, 1 단 수로에서는 수로경사의 영향이 명확히 나타나지 않았다.
Fig. 6(c)는 소단에 의한 Froude 수의 증가율을 수로경사에 따라 나타낸 것이며, Fig. 6(d)는 소단에 의한 Froude 수의 증가율을 토사체적농도에 따라 나타낸 것이다. 소단을 설치 할 경우, 수로경사가 25°일 때 Froude 수가 2.1%-9.7% 감 소하는 것을 확인하였다. 반면, 수로경사가 10°-20°인 경우 소단을 설치함에 따라 Froude 수가 10.0%-58.0% 증가하 는 것을 확인하였다. Froude 수의 평균 증가율은 수로경사 가 10°, 15°, 20°일 때 10.0%, 38.8%, 17.4%로 나타났으 며, 토사체적농도가 0.40, 0.50일 때 14.5%, 39.4%로 나타 났다. 즉, Froude 수의 평균 증가율은 토사체적농도가 높을 수록 증가하는 경향을 보였다.
4.4 흐름 저항계수
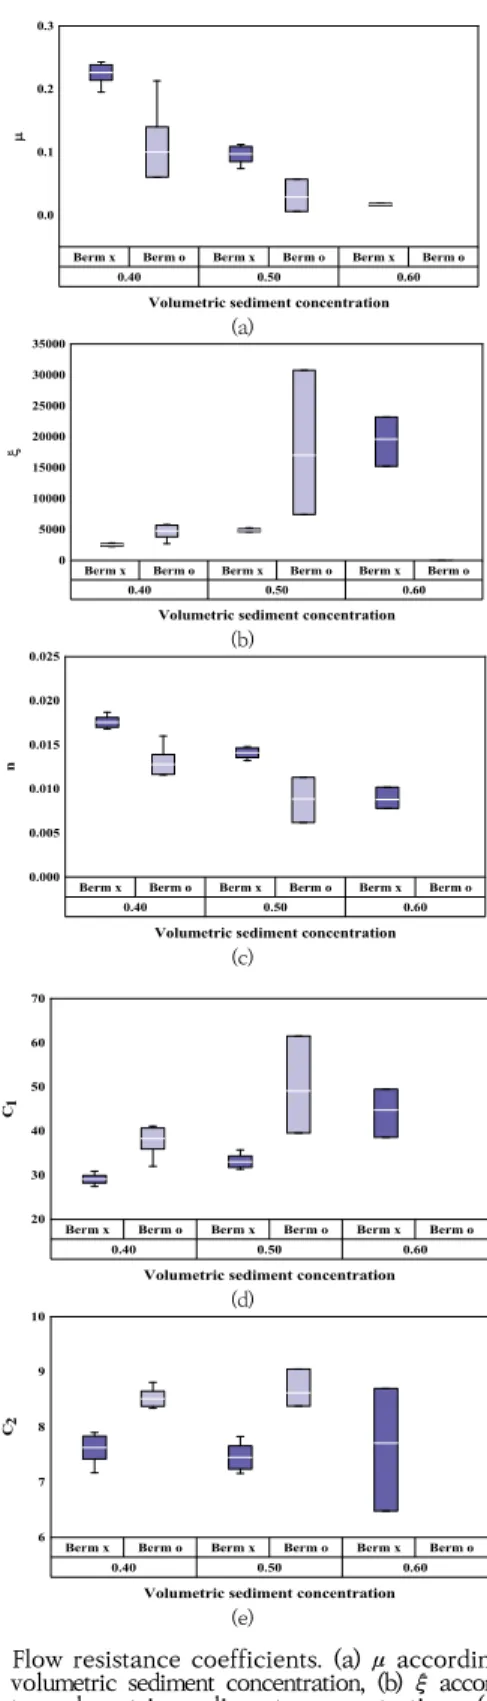
Table 4는 모형실험을 통해 관측한 유속 및 흐름 깊이를 Eq. (2)-(6)에 대입하여 산정한 흐름 저항계수를 나타내고 있으며, Fig. 7은 토사체적농도의 변화에 따른 흐름 저항계 수를 나타낸다. Fig. 7(a)-(e)는 각각 토사체적농도의 변화 에 따른 흐름 저항계수 μ, ξ, n, C1, C2를 나타내고 있다.
실험결과, 수로경사의 영향은 명확히 나타나지 않았지 만 토사체적농도와 소단의 설치가 흐름 저항계수에 영향 을 미치는 것을 확인하였다. μ와 n은 토사체적농도가 증 가할수록 감소하였으며(Fig. 7a, c), ξ와 C1은 토사체적 농도가 증가할수록 증가하였다(Fig. 7b, d). 한편, Koch[23]가 수치해석을 통해 제안한 흐름 저항계수인 C2는 토사체적농도의 변화에 따른 영향이 명확하게 나타 나지 않았다. 이는 C2가 수치해석을 통해 제안되었기 때 문에 수리실험을 통해 제안된 μ, ξ, n, C1과 상이한 변화 양상을 보인 것으로 판단된다. 한편, 소단을 설치함에 따 라 μ와 n은 최대 93.8%, 57.2%씩 감소하였으며, ξ, C1, C2는 최대 563.5%, 91.4%, 26.4% 증가하였다.
Flow resistance
coefficient Range of
values Mean value Standard deviation
(Pa·s)μ 0.006-0.243 0.102 0.084
(m-1/2ξs-1) 2240-30764 8801 8087 (m-1/3n s) 0.006-0.019 0.013 0.004
C1
(m1/2s-1) 27.47-61.53 37.97 8.540 C2
(m0.78s-1) 6.48-9.05 7.96 0.654 Table 4. Flow resistance coefficients
Berm x Berm o Berm x Berm o Berm x Berm o
0.40 0.50 0.60
0.0 0.1 0.2 0.3
Volumetric sediment concentration
(a)
Berm x Berm o Berm x Berm o Berm x Berm o
0.40 0.50 0.60
0 5000 10000 15000 20000 25000 30000 35000
Volumetric sediment concentration
(b)
Berm x Berm o Berm x Berm o Berm x Berm o
0.40 0.50 0.60
0.000 0.005 0.010 0.015 0.020 0.025
Volumetric sediment concentration
n
(c)
Berm x Berm o Berm x Berm o Berm x Berm o
0.40 0.50 0.60
20 30 40 50 60 70
Volumetric sediment concentration C1
(d)
Berm x Berm o Berm x Berm o Berm x Berm o
0.40 0.50 0.60
6 7 8 9 10
Volumetric sediment concentration C2
(e)
Fig. 7. Flow resistance coefficients. (a) μ according to volumetric sediment concentration, (b) ξ according to volumetric sediment concentration, (c) n according to volumetric sediment concentration, (d) C1 according to volumetric sediment concentration, (e) C2 according to volumetric sediment concentration
5. 결론
최근 기후변화의 영향으로 집중호우의 발생빈도가 증 가하고 있으며, 이는 산지에서 토석류를 발생시켜 상당한 인명 및 재산피해를 야기하고 있다. 토석류는 매우 불규 칙적으로 발생하기 때문에 예측이 어려운 재해이며, 이러 한 토석류 피해를 저감하기 위해서는 토석류 방호대책을 수립할 필요가 있다. 본 연구에서는 실내 모형실험을 통 해 수로경사, 토사체적농도 및 소단 설치 유무에 따른 토 석류의 흐름 특성을 분석하였다.
수로경사가 증가함에 따라 토석류의 유속이 증가하였 고, 소단을 설치하지 않은 경우의 흐름 깊이가 감소하였 다. 또한, 1단 수로의 경우 수로경사가 토석류의 퇴적 발 생경사인 15° 미만이 되면 흐름이 거의 발달하지 않았 다. 즉, 토석류의 퇴적 발생경사 15°가 실내 실험에서의 토석류 발달에도 영향을 미치는 것으로 판단된다.
토사체적농도가 μ, ξ, n, C1에 영향을 미치는 것을 확 인하였으며, 토사체적농도가 증가함에 따라 토석류의 유 속과 흐름 깊이가 감소하였고, Froude 수가 증가하였다.
또한, 토사체적농도가 0.60이 되면 수로경사에 상관없이 토석류가 수로에 정지하는 것을 확인하였다. 즉, 토사체 적농도가 높아질수록 토석류의 점성이 증가하여 토석류 의 잠재적인 이동성이 감소하는 것을 확인하였다.
소단을 설치함에 따라 토석류의 유속과 흐름 깊이가 최대 26.1%, 71.2%씩 감소하였지만, 수로경사가 25°일 때 토석류의 흐름 깊이가 상승하였다. 소단을 설치할 경 우, 유동부에서의 토석류 유속이 감소하여 토석류의 이동 성이 감소하지만, 토석류의 튐 흐름 및 유수 이탈현상이 발생할 수 있으므로 추가적인 연구를 수행할 필요가 있 다고 판단된다.
본 연구의 결과는 수로경사와 토사체적농도에 따른 토 석류의 흐름 특성을 이해하는 데 좋은 정보를 제공하며, 소단의 효용성에 대한 정보를 제공한다. 향후 연구에서 소단의 형상을 다양하게 구성하여 토석류의 흐름 특성을 분석한다면, 소단의 성능에 대한 분석을 고도화할 수 있 을 것으로 기대된다.
References
[1] S. Eu, S. Im, D. Kim, “Development of Debris Flow Impact Force Models Based on Flume Experiments for Design Criteria of Soil Erosion Control Dam”, Advances in Civil Engineering, Vol.2019, 3567374,
2019.
DOI: http://dx.doi.org/10.1155/2019/3567374 [2] Central Disaster and Safety Countermeasures
headquarters, Damage recovery plan, Ministry of Public Administration and Security, 2020.
[3] C. Lee, Development and application of disaster prevention system for forest soil sediment disaster, Korea Forest Research Institute, 2014, pp.1-15.
[4] J. E. Costa, Physical Geomorphology of Debris Flows in Developments and Applications of Geomorphology, Springer, Berlin, 1984, pp.268-317.
DOI: http://dx.doi.org/10.1007/978-3-642-69759-3_9 [5] S. Eu, S. Im, “Examining the impact force of debris
flow in a check dam from small-flume experiments”, Proceedings of 7th International Conference on Debris-Flow Hazards Mitigation, Colorado, USA, 2019.
DOI: http://dx.doi.org/10.25676/11124/173230 [6] T. Takahashi, Debris Flow: Mechanics, Prediction and
Countermeasures, 2nd edition, CRC Press, Leiden, 2014, pp. 572.
DOI: https://doi.org/10.1201/b16647
[7] G. G. D. Zhou, S. Li, D. Song, C. E. Choi, X. Chen,
“Depositional mechanisms and morphology of debris flow: physical modelling”, Landslides, Vol.16, No.2, pp.315-332, 2019.
DOI: http://dx.doi.org/10.1007/s10346-018-1095-9 [8] J. Chen, D. Wang, W. Zhao, H. Chen, T. Wang, N.
Nepal, X. Chen, “Laboratory study on the characteristics of large wood and debris flow processes at slit-check dams”, Landslides, Vol,17, No.7, pp.1703-1711, 2020.
DOI: http://dx.doi.org/10.1007/s10346-020-01409-3 [9] T. de Haas, N. Santa, S. I. de Lange, S. P. Pudasaini,
“Similarities and contrasts between the subaerial and subaqueous deposits of subaerially triggered debris flows: An analogue experimental study”, Journal of Sedimentary Research, Vol.90, No.9, pp.1128-1138, 2020.
DOI: http://dx.doi.org/10.2110/jsr.2020.020
[10] R. Jiang, J. Wu, W. Fei, H. Zhou, J. Wang, L. Pan,
“Experimental study on the structural parameters of an optimized sloping roof grill barrier for the prevention of debris flows in Yanmen gully”, Engineering Geology, Vol.277, 105751, 2020.
DOI: http://dx.doi.org/10.1016/j.enggeo.2020.105751 [11] S. Jun, J. Choi, H. Kwon, B. Park, “Study for Analyzing
Travel Time and Runout Distance of the Debris Flow”, Journal of the Korean Society of Hazard Mitigation, Vol.20, No.3, pp.51-59, 2020.
DOI: http://dx.doi.org/10.9798/KOSHAM.2020.20.3.51 [12] I. Baselt, G. Q. de Oliveira, J. Fischer, S. P. Pudasaini,
“Evolution of stony debris flows in laboratory experiments”, Geomorphology, Vol.372, No.1, 107431, 2021.
DOI: https://doi.org/10.1016/j.geomorph.2020.107431
[13] K. Kim, D. Lee, D. Kim, S. Lee, “A Study on Model Tests for Debris Flow Characteristics”, Journal of the Korean Geo-Environmental Society, Vol.9, No.5, pp.83-89, 2008.
[14] J. Kim, S. Kwon, H. Shin, “A Numerical Study on Debris Flow using Rheological-mechanical Laboratory Test Considering Geotechnical Characteristics”, Journal of the Korean Society of Hazard Mitigation, Vol.17, No.6, pp.193-200, 2017.
DOI: http://doi.org/10.9798/KOSHAM.2017.17.6.193 [15] B. Roddy, E. Howard, “Hydrological function of berms
within a waste landform design”, Proceedings of the 11th International Conference on Mine Closure, Perth, Australia, 2016.
DOI: https://doi.org/10.36487/ACG_rep/1608_01_Roddy [16] S. Kim, S. Oh, H. Lee, “The Study of Relationship
between Berm Width and Debris Flow at the Slope”, Journal of the Korean Geo-Environmental Society, Vol.14, No.11, pp.5-12, 2013.
[17] Korea Forest Service, Revised sand prevention technology book, Korea Forest Service, 2014, pp.432.
[18] H. Lee, S. Kim, K. Jun, M. Lee, “The Modeling of Debris Flow Disaster According to the Location of Berm”, Crisisonomy, Vol.11, No.9, pp.105-118, 2015.
[19] S. Li, C. Peng, W. Wu, S. Wang, X. Chen, J. Chen, G.
G. D. Zhou, B. K. Chitneedi, “Role of baffle shape on debris flow impact in step-pool channel: an SPH study”, Landslides, Vol.17, No.9, pp.2099-2111, 2020.
DOI: https://doi.org/10.1007/s10346-020-01410-w [20] L. M. Highland, P. Bobrowsky, The landslide
handbook: a guide to understanding landslides, U.S.
Geological Survey, Reston, Virginia, 2008, pp. 129.
[21] T. Takahashi, “Debris flow”, Annual Review of Fluid Mechanics, Vol.13, No. 1, pp.57-77, 1981.
DOI: https://doi.org/10.1146/annurev.fl.13.010181.000421 [22] O. Hungr, G. C. Morgan, “Quantitative analysis of
debris torrent hazards for design of remedial measures”, Canadian Geotechnical Journal, Vol.21, No.4, pp.663-677, 1984.
DOI: http://dx.doi.org/10.1139/t84-073
[23] T. Koch, Testing various constitutive equations for debris flow modelling in Hydrology, Water Resources and Ecology in Headwaters, IAHS Publ., Wallingford, 1998, pp.249-257.
[24] D. Rickenmann, “Empirical relationships for debris flows”, Natural Hazards, Vol.19, pp.47-77, 1999.
DOI: https://doi.org/10.1023/A:1008064220727 [25] D. O. K. Lo, Review of natural terrain landslide
debris-resisting barrier design in Geo Report No. 104, Geotechnical Engineering Office, Civil Engineering Department, The Government of Hong Kong Special Administrative Region, 2000, pp.92.
[26] V. D’Agostino, M. Cesca, L. Marchi, “Field and laboratory investigations of runout distances of debris
flows in the Dolomites (Eastern Italian Alps)”, Geomorphology, Vol.115, No.3-4, pp.294-304, 2010.
DOI: https://doi.org/10.1016/j.geomorph.2009.06.032 [27] G. Fairfield, Assessing the dynamic influences of slope
angle and sediment composition on debris flow behaviour: An experimental approach, Master’s thesis, Durham University, pp.144, 2011.
[28] T. de Haas, L. Braat, J. R. F. W. Leuven, I. R. Lokhorst, M. G. Kleinhans, “Effects of debris flow composition on runout, depositional mechanisms, and deposit morphology in laboratory experiments”, Journal of Geophysical Research: Earth Surface, Vol.120, No.9, pp.1949-1972, 2015.
DOI: https://doi.org/10.1002/2015JF003525
[29] J. Kwon, Model experimental study with consideration for grain composition of debris flows in Korea, Master’s thesis, Seokyeong University, pp.63, 2013.
[30] J. Kim, J. Kim, S. Yoon, “An Experimental Study for Drainage Capacity Improvement of Waterway with Steep Slope”, Journal of the Korean Society of Civil Engineers, Vol.33, No.6, pp.2303-2315, 2013.
DOI: https://doi.org/10.12652/Ksce.2013.33.6.2303 [31] D. Yu, J. H. W. Lee, C. K. C. Wong, “Stormwater
overflow in stepped channel”, Journal of Hydro- environment Research, Vol.2, No.2, pp.119-128, 2008.
DOI: https://doi.org/10.1016/j.jher.2008.05.004 [32] B. Jun, K. Jun, C. Jang, “A Study on Development of
Debris Flow Experimental Equipment for Mountainous Disaster”, Crisisonomy, Vol.8, No.3, pp.137-146, 2012.
유 국 현(Kukhyun Ryou) [준회원]
• 2020년 8월 : 충북대학교 대학원 토목공학과 (공학석사)
• 2020년 9월 ~ 현재 : 충북대학교 연구원
<관심분야>
토석류, 사면재해
장 형 준(Hyungjoon Chang) [종신회원]
• 2015년 2월 : 충북대학교 대학원 토목공학과 (공학석사)
• 2018년 2월 : 충북대학교 대학원 토목공학과 (공학박사)
• 2018년 3월 ~ 현재 : 충북대학교 토목공학부 강사 및 박사 후 연구 원
<관심분야>
강우유출, 방재안전
이 호 진(Hojin Lee) [종신회원]
• 1999년 2월 : 충북대학교 대학원 토목공학과 (공학석사)
• 2004년 2월 : 충북대학교 대학원 토목공학과 (공학박사)
• 2009년 10월 ~ 2010년 11월 : Colorado State University 토 목환경공학과 박사 후 연구원
• 2013년 3월 ~ 현재 : 충북대학교 공과대학 토목공학부 교수
<관심분야>
유사현상, 해안세굴