서 론
생활과 보건, 의료 수준이 향상되면서 우리나라 국민의 기대수명
은 2015년 출생자 기준 남자 78.96세, 여자 85.17세로 증가했다.1) 그러 나 기대수명의 증가와 더불어, 2015년 기준 합계출산율 1,239명의 낮 은 출산율로 인해 인구구조의 급격한 고령화가 이루어지고 있다. 65 Received May 11, 2017 Revised October 20, 2017
Accepted October 24, 2017 Corresponding author Serng Bai Pak Tel: +82-31-900-0440, Fax: +82-31-900-0343 E-mail: [email protected]
ORCID: http://orcid.org/0000-0001-8939-8737 Corresponding author Suk Joon Jung Tel: +82-53-785-1942, Fax: +82-6008-1458 E-mail: [email protected]
ORCID: http://orcid.org/0000-0003-3509-3131
Copyright © 2018 The Korean Academy of Family Medicine
This is an open-access article distributed under the terms of the Creative Commons At- tribution Non-Commercial License (http://creativecommons.org/licenses/by-nc/4.0) which permits unrestricted noncommercial use, distribution, and reproduction in any medium, provided the original work is properly cited.
Original Article
https://doi.org/10.21215/kjfp.2018.8.3.372 eISSN 2233-9116
Korean J Fam Pract. 2018;8(3):372-379
Korean Journal of Family Practice
KJFP
고혈압 위험요인들의 상호 의존성 분석: 2010-2015년 국민건강영양조사 자료를 중심으로
남현령
1, 박성배
2,*, 정석준
3,*, 최인영
1, 김예슬
21세브란스병원 가정의학과, 2국민건강보험 일산병원 가정의학과, 3대구경북과학기술원 뉴바이올로지
Interdependency of Risk Factors for Hypertension: The 2010–2015 Korean National Health and Nutrition Examination Survey
Hyun Ryung Nam1, Serng Bai Pak2,*, Suk Joon Jung 3,*, In Young Choi1, Yesul Kim2
1Department of Family Medicine, Severance Hospital, Seoul; 2Department of Family Medicine, National Health Insurance Service Ilsan Hospital, Goyang;
3Department of New Biology, DGIST, Daegu, Korea
Background: Identifying the risk factors for hypertension and predicting the likelihood of developing it is important for efficient distribution of limited health resources and for improving public health. Age, sex, family history, and obesity are the known risk factors for onset of essential hypertension.
However, results of studies on the significance of some risk factors are not consistent. If the relationship is nonlinear or dependent on other variables, variable outcomes may be derived, depending on group selection. To overcome these problems, we investigated the interdependence among the 10 risk factors of hypertension and analyzed the significance interdependency by network of the 10 risk factors has been constructed and analyzed to overcome the problem.
Methods: We integrated the data of the 5th and 6th National Health and Nutrition Examination Survey to generate a comprehensive database for 23,980 adults aged 30 years or older. Each risk factor was divided into two groups, and the dependencies between the risk factors were modeled. To exclude group biases and secondary associations, the sample was divided into 128 groups based on 8 risk factors, other than variables that examined dependency, and weights were given. The significance was confirmed by making a distribution of 100,000 random mixtures of the variables, and the dependence relation between the risk factors estimated through the model was analyzed.
Results: We confirmed a relationship between the risk factors of hypertension. Of the 10 risk factors used in the study, 9 were identified in a close network of obesity.
Conclusion: There is a complex interdependence between the risk factors of hypertension, which varies according to the risk factors.
Keywords: Hypertension; Multivariate Analysis; Risk Factors; Alcohol; Smoking
남현령 외. 고혈압 위험요인들의 상호 의존성 Korean Journal of Family Practice
KJFP
세 이상인 인구의 구성비는 2000년 7.2%에서 2015년 12.9%로 증가했 으며 2030년에는 24.1%, 2045년에는 34.7%에 이를 것으로 예측된다.2)
고령자의 수가 증가하면서 만성퇴행성 질환이 국민 보건에 있어 중요한 문제로 떠오르고 있다. 특히 심장과 뇌혈관, 고혈압성 질환은 사망자가 2015년 기준 인구 10만 명당 113.5명으로 암(150.8명)에 이 어 사망 원인 2위이며, 이는 부분적으로 고령자 비율의 증가에서 비 롯된 것이라 생각되고 있다.3)
고혈압은 그 자체로 하나의 질병일 뿐만 아니라, 관상동맥질환, 심 부전, 뇌졸중, 혈관성 치매 등을 포함한 심혈관계 질환의 위험요인으 로 작용한다. 140/90 mmHg 이상의 고혈압 환자 집단은 130/85 mmHg 미만의 혈압을 가진 집단보다 심뇌혈관질환 발생의 위험이 2.6배 높다는 연구결과가 있다.4) 고령화로 진행되고 있는 우리나라 인구구조의 변화추이를 생각할 때, 고혈압의 위험요인을 밝히고 발 병 가능성을 예측하는 것은 매우 중요한 일이다.
성별,5) 나이,6) 가족력,7) 비만8) 등이 본태성 고혈압의 발병 가능성 을 높이는 위험요인으로 알려져 있다. 또한 당뇨병8) 등의 질환과 동 반이환 경향이 보고되었다. 그러나 횡적 표본추출의 한계 등의 이유 로 인하여, 음주6,8,9)와 흡연6,8-10)을 포함한 일부 위험요인의 유의성에 대해서는 그 결과가 일관적이지 않다는 문제가 있었다. 따라서 이 연 구에서는, 전국민을 모집단으로 한 국민영양조사(2010–2015년)를 활용하여 반복된 표본 표집에서 일관적으로 발견되는 위험요인을 조사하였다.
위험요인 중 일부는 서로에 대해 의존적으로 고혈압 유병률과 비 선형적인 연관관계를 보인다. 예를 들어 연령이 낮은 표본에서는 ‘남 성’이 고혈압의 위험요인으로 나타나지만, 연령이 높은 표본에서는
‘여성’이 고혈압의 위험요인으로 나타난다.5) 만약 연령에 대한 고려 없이 표준집단에서 성별과 고혈압 유병률 사이의 관계를 탐구한다 면 집단 선정에 의해 상이한 결과가 도출될 수 있는 것이다.
위험요인 간의 의존관계와 그에 따른 비선형성에 대한 탐구 없이, 각각이 독립적으로 작동한다고 가정하면, 환자 개인이나 인구 집단 에서의 고혈압 위험도를 조건에 따라 과대 혹은 과소 평가하게 될 우려가 있다. 따라서 이번 연구에서는 알려진 고혈압의 위험요인들 사이의 의존 관계를 조사하였다.
방 법
1. 연구 대상
본 연구는 보건복지부 질병관리본부에서 국민건강영양조사 5기 (201011), 201112), 2012년13))와 6기(201314), 201415), 201516)년) 원시자료를 분 석했다.
제5기(2010–2012년)의 일반주택 표본 조사구는 2009년 주민등록 인구의 통, 반, 리 조사구에서, 아파트 표본 조사구는 아파트시세조 사 자료의 아파트 단지 조사구에서 추출하였다. 시도별(서울, 6대 광 역시, 경기, 경상, 강원, 충청, 전라, 제주)로 1차 층화하고, 일반지역은 성별, 연령대별 인구비율 기준 26개 층, 아파트지역은 단지별 평당 가 격, 평균평수 등 기준 24개 층으로 2차 층화한 후 표본 조사구를 추 출하였다. 표본 조사구 내에서는, 계통추출방법으로 조사구 당 20 개의 조사대상가구를 추출하였다.
제6기(2013–2015년) 조사구는 연간 192개, 3년간 총 576개를 추출 하였다. 표본 조사구 내에서 양로원, 군대, 교도소 등의 시설 및 외국 인 가구 등을 제외한 적절가구 중, 계통추출법을 이용하여 20개 표 본가구를 선정하였다. 표본가구 내에서는 적정가구원 요건을 만족 하는 만 1세 이상의 모든 가구원을 조사대상자로 선정하였다.
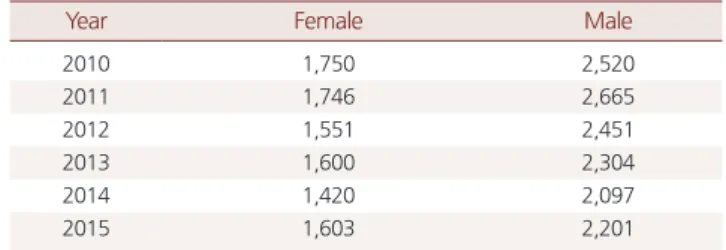
5, 6기 조사 결과를 종합한 표본 내에서 만 연령 30세 이상이며, 본 연구에서 지정한 변수에 결측이 없는 23,908명을 최종 분석 대상으 로 하였다. 조사연도별로 사용된 표본 수는 Table 1과 같다.
2. 연구 변수 1) 고혈압
대한고혈압학회에서 발간한 2013년 고혈압 진료지침의 진단 기준 을 준용했다.17) 대상 중, 수축기 혈압이 120 mmHg 이상이거나 이완 기 혈압이 80 mmHg 이상일 경우, 혹은 이미 의사로부터 고혈압 진 단을 받아 혈압조절을 위한 약물을 복용하고 있을 경우를 고혈압 유병 중으로 판단하였다. 특정 집단의 고혈압 유병률은 해당 집단에 서 고혈압 유병 중인 사람의 백분율로써 정의했다.
혈압의 측정은 한국건강관리협회 및 보건소 소속 간호사 135명이 담당했으며 질병관리본부 전문조사수행팀 내 혈압측정 담당 간호 사 4명이 혈압 및 맥박 측정을 실시하였다. 다만 이동검진차량이 도 입된 제4기 2차년도(2008년) 7월 이후 혈압측정대가 변경되면서 심 장높이를 기준으로 팔 높이와의 편차가 발생하였기에(남자 1–5 cm, 여자 1–3 cm), 제5기 1차년도(2010년) 12월 중 수집한 혈압 측정치를 심장 높이에 해당하는 평균 팔 높이(남자 83 cm, 여자 81 cm)를 기준
Table 1. Number of final analysis subjects by survey year
Year Female Male
2010 1,750 2,520
2011 1,746 2,665
2012 1,551 2,451
2013 1,600 2,304
2014 1,420 2,097
2015 1,603 2,201
Values are presented as number only.
Original Article
Korean Journal of Family Practice
Hyun Ryung Nam, et al. Interdependency of Risk Factors for Hypertension
Korean Journal of Family Practice
KJFP
으로 보정하여 고혈압 유병 여부를 판별하였다. 이는 미국심장협회 의 혈압측정 팔 높이에 따른 1 cm당 0.7 mmHg를 가감 혈압 보정 권 고18)에 따른 것이다.
2) 나이, 성별
주민등록부의 나이와 성별로 정의했다. 나이가 70세 이상인 경우 를 고령이라 정의했다.
3) 비만
대한비만학회에서 발간한 2012년 비만치료지침에 실린 체질량지 수(body mass index) 기준을 준용했다.19) 체질량지수가 25 kg/m2보다 클 경우 비만, 그렇지 않을 경우 정상으로 분류했다.
4) 가족력
부모의 고혈압 유병 여부를 각각 나누어 정의했으며 그 기준은
“귀 가족 중에서 의사로부터 다음의 질병을 진단받으신 적이 있으십 니까?”라는 설문에 대상자가 “예”라고 기입한 것이다. 부모 중 한 명 이라도 고혈압 진단을 받은 것을 기준으로 가족력 여부를 정의했다.
5) 음주 여부
최근 1년간 월 1잔 이상의 음주하는 것을 기준으로 정의했다.
6) 흡연
평생 담배 5갑(100개비) 이상을 피웠으며 지금도 피우고 있는 사 람을 흡연자라 정의했다.
7) 스트레스 인지
“평소 일상생활 중에 스트레스를 어느 정도 느끼고 있습니까?”라 는 설문에 대한 응답으로 정의하였다. 객관식으로 가능한 답변은
“대단히 많이 느낀”, “많이 느끼는 편이다”, “조금 느끼는 편이다”, “거 의 느끼지 않는다”이다. 이 중 “대단히 많이 느낀”, “많이 느끼는 편이 다”라 답했을 때 고 스트레스로 정의했다.
8) 당뇨병
대한당뇨병학회에서 제시한 당뇨병 진단기준20)을 준용했다. 공복 혈당이 126 mg/dL 이상이거나 이미 의사에게 당뇨병으로 진단받은 적이 있다고 답했다면 당뇨병 유병자로 구분하였다. 이외의 경우 정 상으로 분류했다.
9) 교육수준
대상의 최종 학력에 대한 기준으로 “초등학교 졸업 이하”, “중학교 졸업”, “고등학교 졸업”, “대학교 졸업 이상”으로 구분했다. 단 졸업만 을 인정하고 수료, 중퇴, 재학, 휴학은 이전 학력으로 분류하였다. “초
Calculate and applicate weights
Sample group
Reference sample structure
Split by the risk factor to test
Random split & test
Compare prevalence of hypertension
Calculate significance
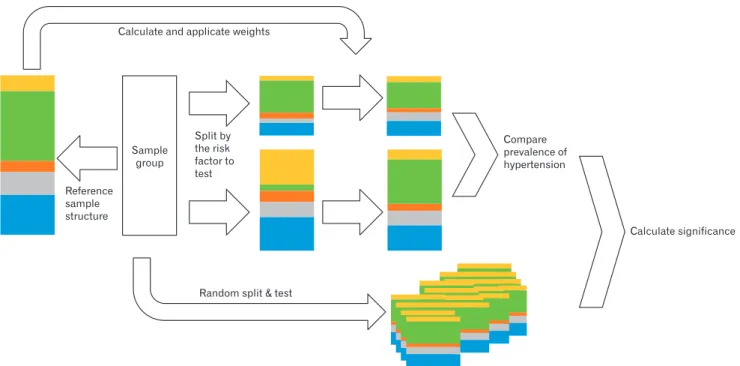
Figure 1. Outline of the statistical process. Groups of risk factors were grouped into 128 groups, measured and weighted for each group, Weights were applied to each analysis, combined with composite sample design weights and weights per annum.
남현령 외. 고혈압 위험요인들의 상호 의존성 Korean Journal of Family Practice
KJFP
등학교 졸업 이하”와 “중학교 졸업”을 저학력으로 정의했다.
10) 소득
가구 소득을 기준으로 사분위수를 “하”, “중하”, “중상”, “상”으로 구 분했다. “하” 사분위를 저소득으로 정의했다.
3. 통계학적 분석 1) 기본 분석 방법
Python의 SCIPY 라이브러리를 활용하여21), 다양한 위험요인들을 기준으로 표본설계가 가능하도록 원시자료의 데이터구조를 수정했 다. 변수간의 의존관계를 고려하는 분포 모델을 정의하는데 따르는 어려움 때문에, 각 검정마다 100,000번의 index permutation을 통해 P 값을 구하기 위한 모 분포를 만들었다.
2) 표본 설계
다양한 위험요인과 그 사이의 조합으로 표본군을 생성하여 비교 할 때, 위험요인 사이의 연관관계로 인해 잘못된 결과를 얻을 수 있 다. 예를 들어, 음주와 고혈압 사이의 연관관계를 단순히 선형 분석 하면, 상대적으로 많은 남성 음주자의 비율을 간과하게 된다. 이를 성별과 고혈압 사이의 연관관계로 보정하지 않으면 지나치게 높은 상관도를 관찰하게 되는 것이다. 따라서, 분석에 사용하는 변수를
제외한 나머지 위험요인들을 기준으로 표본을 128개로 그룹화하고 각 그룹마다의 빈도를 측정, 가중치를 만들어 복합 표본 설계 가중 치, 연도별 가중치와 함께 매 분석 시 적용했다. 통계 과정의 개요를 Figure 1에 표현했다.
3) 위험요인 간 의존관계 판단
위험요인 B의 고혈압 유병률에 대한 영향이 위험요인 A에 의해 변 할 수 있다면 그 효과는 Figure 2와 같이 4가지로 나눈 그룹에서의 유 병률의 패턴을 비교하여 판단할 수 있다.
4) 네트워크 분석
프로그램 “Cystoscope”를 이용하여 네트워크를 표현하고 network analyze tool을 활용하여 network density, diameter 등의 기본적인 pa- rameter들을 확인하였다.
결 과
1. 연령별, 성별 고혈압 유병률
연령별 고혈압 유병률을 30–39세, 40–49세, 50–59세, 60–69세, 70 세 이상의 5구간으로 대상을 나누어 조사하였다. 각 연령층별 고혈 압 유병률을 조사한 결과는 Table 2와 같다. 각 연령 집단의 유병률
Risk factor B ~B
Effect of B is independent of A Effect of B is independent of A Effect of B requires A Effect of B requires ~A
O X O X
O X X O
1 2 3 4
> > Type
A B
, , , are prevalence of hypertension in each group Risk factor A
~A
A B
A B
Figure 2. Algorithm for determining dependency between risk factors. If the effects of high blood pressure on risk factor B can be changed by risk factor A, the effects of the prevalence of prevalence in grouped groups can be determined by comparing the patterns in four groups.
Table 2. Prevalence of hypertension by age and sex
Age Male Female
Normal Hypertension Prevalence (%) Normal Hypertension Prevalence (%)
30s 1,398 235 14.4* 2,689 61 2.2
40s 1,306 453 25.8* 2,481 314 11.2
50s 1,207 680 36.0* 2,080 874 29.6
60s 898 914 50.4 1,118 1,172 51.2
≥70 611 779 56.0 574 1,192 67.5*
Values are presented as number only.
*Prevalence of hypertension in the sex is significantly higher.
Hyun Ryung Nam, et al. Interdependency of Risk Factors for Hypertension
Korean Journal of Family Practice
KJFP
은 30–39세에서 남, 여 각각 14.4%, 2.2%에서 70대 이상 각각 56.0%, 67.5%가 될 때까지 연령에 따라 증가한다.
2. 10개 위험요인과 고혈압 유병률
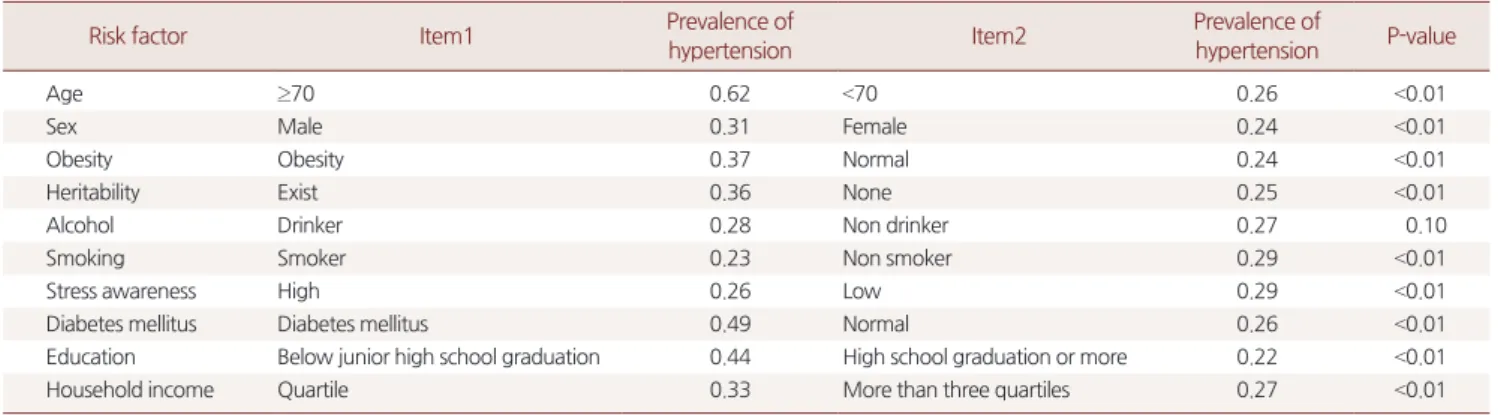
연구에서 사용한 위험요인들로 표본을 나누고 고혈압 유병률을 조사하여 유의도를 계산한 결과는 Table 3과 같다. 10개 위험요인 중, 음주 여부를 제외한 9개 위험요인은 0.01 이하의 P값을 가져 유의미 하게 고혈압 유병률을 증가시키는 것을 확인할 수 있다.
3. 연령, 성별, 음주 여부별 고혈압 유병률과 상호의존관계 네트워크
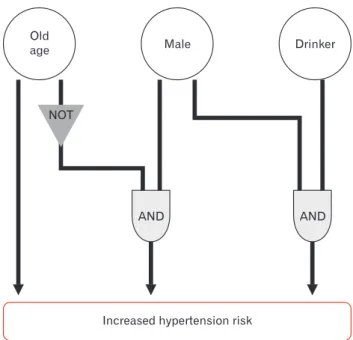
위에서 고혈압 유병률과 유의미한 연관을 보이지 않았던 음주 여 부를 성별, 연령별로 나누어 다시 분석했다. 또한, 결과를 통해 세 위 험요인간의 의존 관계를 재구축하고 이를 네트워크 형태로 표현하 였다(Figure 3). 위 의존관계는 위험요인과 고혈압 유병률 사이의 관 계에 관한 것이기에 Figure 4처럼 표현할 수 있다.
4. 10개 위험요인 간 상호의존관계 네트워크
위와 같은 방법으로 10개 위험요인 상호간의 의존관계를 모두 조 사하였다. 18개의 유의미한 관계를 찾아내어 이를 Table 4에 표시했 다. 10개 위험요인들을 node로 하고 18개 의존관계를 edge로 한 네트 워크의 그래프는 Figure 5에 나타내었다.
고 찰
“남성”이라는 위험요인은 “고령”에 의해 그 작동이 억제된다는 결 과를 얻었다. 이는 전체 인구집단에서는 “남성”이 고혈압의 위험을 증가시키지만, “고령 인구집단”에서는 그렇지 않다는 것을 의미한다.
이는 선행연구22,23)에서 확인한 바와 합치한다. 본 연구에서는 이와 같이 한 위험요인이 다른 위험요인의 효과에 영향을 미칠 수 있는 모 든 경우를 조사하여 네트워크로 만들었다. 위험요인 “비만” 만이 고 립되어있고 나머지 9개 위험요인들이 서로 긴밀히 연결된(clustering coefficient=0.411, network density=0.472) 그래프를 이룬다.
Table 3. Prevalence of hypertension by each risk factor
Risk factor Item1 Prevalence of
hypertension Item2 Prevalence of
hypertension P-value
Age ≥70 0.62 <70 0.26 <0.01
Sex Male 0.31 Female 0.24 <0.01
Obesity Obesity 0.37 Normal 0.24 <0.01
Heritability Exist 0.36 None 0.25 <0.01
Alcohol Drinker 0.28 Non drinker 0.27 0.10
Smoking Smoker 0.23 Non smoker 0.29 <0.01
Stress awareness High 0.26 Low 0.29 <0.01
Diabetes mellitus Diabetes mellitus 0.49 Normal 0.26 <0.01
Education Below junior high school graduation 0.44 High school graduation or more 0.22 <0.01
Household income Quartile 0.33 More than three quartiles 0.27 <0.01
Old Drinker Old Male Male Drinker
Drinker
Male Old Drinker
Male Old
None (type1) None (type2) Negative (type4)
None (type1) Positive (type3) Positive (type3)
Drinker Old age
Male
Old Young
Drinker Non-drinker
24.9 24.4 60.3
61.3
Old Young
Male
Female 21.0
56.1 64.3
Male Female
Drinker Non-drinker
25.4 25.3 27.9
Source Target Dependency
29.3
34.2
Figure 3. Prevalence and interdepen- dence of hypertension according to age, sex, and drinking status. It recon- structed the dependency between age, sex and drinking, and expressed itself in a network form. In the comparison in the direction of the arrow, the P-val- ue is smaller than 0.01.
남현령 외. 고혈압 위험요인들의 상호 의존성 Korean Journal of Family Practice
KJFP
네트워크에서 edge의 의미는 두 node간의 correlation이 아닌 두 위 험요인과 고혈압 유병률 사이의 비선형적 관계이다. 예를 들어 Fig- ure 5와 같이 세 위험 요소의 고혈압 위험성 증가 경향이 다른 요인 에 의해 영향 받는 경우 Figure 4와 같이 표현된다. 네트워크에서 연 결된 두 위험요인을 모두 고려하는 선형적 고혈압 위험도 예측 모델 은 충분한 정보를 이끌어내지 못하거나 잘못된 메커니즘을 추론할
가능성이 있다.
위험요소끼리 긴밀히 연결된 네트워크에 개관을 통해 개인의 빅 데이터를 이용하여 고혈압 위험을 예측할 때, 로지스틱 회귀 등 선형 적 예측모델이 적합하지 않다는 것을 알 수 있다. 2개 이상의 퍼셉트 론 층을 포함한 딥 러닝 시스템이나 서포트 백터 머신 등 변수 간 의 존성과 비선형성을 고려할 수 있는 머신러닝 알고리즘을 활용하여 이를 극복할 수 있을 것이다. 이미 딥 러닝을 활용한 진단이나 경과 예측은 많은 연구가 진행되어 상용화 단계에 이르렀다.24) 머신러닝 알고리즘은 입력 데이터의 성격과 형태에 많은 영향을 받으며 국민
Drinker Old
age Male
NOT
AND AND
Increased hypertension risk
Figure 4. Logic gate graph representing interdependency between risk factors. The relationship between Figure 3 is expressed as Figure 4 be- cause it relates to the relationship between risk factors and high blood pressure.
Table 4. Interdependence of identified risk factors
Source Type Target
Old age Negative Male
Old age Negative Smoking
Old age Negative Low education
Old age Negative High income
Male Positive Drinking
Drinking Positive Male
Diabetes mellitus Negative Male
Low education Negative Male
Heritability Negative Drinking
Heritability Negative Low income
Diabetes mellitus Negative Drinking
Low education Positive Drinking
Low income Negative Drinking
Smoking Positive Stress
Diabetes mellitus Negative Smoker
Smoking Positive Low income
Low education Negative Stress
Low education Positive Low income
Male
Drinker Old Stress Smoker age
Low income Diabetes
mellitus
Obesity
Heritability
Low
education Figure 5. Interdependence between risk factors network. A graph of a net- work with 10 risk factors and a net- work of 18 dependencies.
Hyun Ryung Nam, et al. Interdependency of Risk Factors for Hypertension
Korean Journal of Family Practice
KJFP
건강영양조사와 같이 대한민국의 보건 빅데이터를 수용할 수 있는 맞춤형 시스템이 필요하다.
본 논문에서는 위험요인 간 필요관계만을 조사하였다. 베이지안 (bayesian) 분석을 통하여 두 위험요인간의 시너지 효과나 기타 여러 형태의 상호 독립성을 검증할 수 있으나, 표본의 수가 충분치 않았고 모델이 지나치게 복잡해졌기 때문에 배제했다. 이는 본 연구에서 다 른 변수들 없이도 충분한 유병률 증가 효과를 가지는 고령, 비만, 유 전력과 같은 요인의 의존 관계를 과소추정하게 했을 가능성이 있다.
더 많은 자료를 통합하고 더 정밀한 분포를 사용하는 모델을 만든다 면 고혈압 유병 가능성을 예측하는데 도움을 줄 수 있는 네트워크 를 만들 수 있을 것이다.
요 약
연구배경:
고혈압의 위험요인을 밝히고, 발병 가능성을 예측하는 것은 한정된 보건 자원의 효율적인 분배와 국민 건강 향상을 위해 중요한 일이다. 성별, 나이, 가족력, 비만 등이 본태성 고혈압의 발병 가능성을 높이는 위험요인으로 알려져 있다. 그러나, 음주와 흡연을 포함한 일부 위험요인의 유의성에 관한 연구들에서는 그 결과가 일 관성을 보이지 않는다. 위험요인들과 고혈압의 관계가 비선형적이거 나 다른 변수에 의존적이라면, 집단 선정에 따라 상이한 결과가 도 출될 수 있기 때문이다. 이러한 문제점을 보완하기 위해, 알려진 고혈 압의 위험요인 10가지 사이의 상호의존성을 조사하고 그 유의성을 네트워크로 분석하였다.방법:
국민건강영양조사 5기, 6기 자료를 통합하여 30세 이상 성인 23,908명의 고혈압 유병 여부, 고혈압 가족력, 당뇨병 유병 여부, 연령, 성별, 가구소득, 체중, 스트레스 인지, 음주, 흡연 여부, 교육수준과 소득 자료를 정리하였다. 각 위험요인을 두 그룹으로 나누고, 위험요 인간의 의존성을 모델화하였다. 집단의 편중과 이차적 연관성을 배 제하기 위해, 의존성을 조사하는 변수 이외의 8개 위험요인을 기준 으로 표본을 128개 집단으로 나누고 가중치를 부여하였다. 유의성 확인은 해당 변수만을 무작위로 섞어 만든 100,000개의 분포를 만 들어 진행했고, 모델을 통해 추정되는 위험요인간의 의존 관계를 네 트워크로 분석하였다.결과:
고혈압의 위험요인 간의 의존관계를 확인했다. 예를 들어 음 주는 전체 인구집단에서 고혈압 유병률과의 연관관계를 보이지 않 으나, 남성 혹은 저학력 인구집단으로 한정하면 유의미한 위험요인 으로 확인된다. 연구에 사용한 10개 위험요인 중 비만을 제외한 9개 가 형성하는 긴밀한 네트워크를 확인했다.결론:
고혈압의 위험요인들 사이에는 복잡한 상호 의존관계가 존재하며 그 양태는 위험요인 별로 상이하게 나타난다.
중심단어:
고혈압; 다변량분석; 위험요인; 음주; 흡연REFERENCES
1. Korean statistical information service. Life table [Internet]. Daejeon: Statis- tics Korea [cited 2016 Dec 2]. Available from: http://kostat.go.kr/portal/eng/
pressReleases/8/6/index.board?bmode=read&bSeq=&aSeq=358857&page No=1&rowNum=10&navCount=10&currPg=&sTarget=title&sTxt=.
2. Korean statistical information service. Population Trend Survey [Internet].
Daejeon: Statistics Korea [cited 2017 Mar 28]. Available from: https://meta.
narastat.kr/metasvc/index.do?confmNo=101003&inputYear=2017.
3. Korean statistical information service. Cause of death [Internet]. Daejeon:
Statistics Korea [cited 2016 Sep 30]. Available from: https://meta.narastat.kr/
metasvc/index.do?confmNo=101054&inputYear=2016.
4. Park JK, Kim CB, Kim KS, Kang MG, Jee SH. Meta-analysis of hypertension as a risk factor of cerebrovascular disorders in Koreans. J Korean Med Sci 2001; 16: 2-8.
5. Park JK, Lim YH, Kim KS, Kim SG, Kim JH, Lim HG, et al. Changes in body fat distribution through menopause increase blood pressure independently of total body fat in middle-aged women: the Korean National Health and Nutrition Examination Survey 2007-2010. Hypertens Res 2013; 36: 444-9.
6. Lee HJ, Lee HS, Lee Y, Jang YA, Moon JJ, Kim CI. Nutritional environment influences hypertension in the middle-aged Korean adults: based on 1998
& 2001 National Health and Nutrition Survey. Korean J Community Nutr 2007; 12: 272-83.
7. Choi KM, Park HS, Han JH, Lee JS, Lee J, Ryu OH, et al. Prevalence of pre- hypertension and hypertension in a Korean population: Korean National Health and Nutrition Survey 2001. J Hypertens 2006; 24: 1515-21.
8. Ahn SH, Son SM, Park JK. Health and nutritional factors related to hyper- tension of subjects aged over 50 in high income class : based on the 2005 Korea National Health and Nutrition Examination Survey. J Korean Diet Assoc 2009; 15: 311-27.
9. Kaplan MS, Huguet N, Feeny DH, McFarland BH. Self-reported hyperten- sion prevalence and income among older adults in Canada and the United States. Soc Sci Med 2010; 70: 844-9.
10. Lee HS, Kwun IS, Kwon CS. Prevalence of hypertension and related risk fac- tors of the older residents in Andong rural area. J Korean Soc Food Sci Nutr 2009; 38: 852-61.
11. KCDC. National Health and Nutrition Survey. 4th, 1st year survey [Inter- net]. Osong: KCDC [cited 2017 Mar 17]. Available from: http://www.cdc.
go.kr/CDC/contents/CdcKrContentView.jsp?cid=60940&menuIds=
HOME001-MNU1130-MNU1639-MNU1748-MNU1752.
12. KCDC. National Health and Nutrition Survey. 5th, 2nd year survey [Inter- net]. Osong: KCDC [cited 2017 Mar 17]. Available from: http://www.cdc.
go.kr/CDC/contents/CdcKrContentView.jsp?cid=60940&menuIds=
HOME001-MNU1130-MNU1639-MNU1748-MNU1752.
13. KCDC. National Health and Nutrition Survey. 5th, 3rd year survey [Inter- net]. Osong: KCDC [cited 2013 Nov 29]. Available from: https://knhanes.
cdc.go.kr/knhanes/sub04/sub04_04.do.
14. KCDC. National Health and Nutrition Survey. 6th, 1st year survey [Inter-
남현령 외. 고혈압 위험요인들의 상호 의존성 Korean Journal of Family Practice
KJFP
net]. Osong: KCDC [cited 2014 Sep 25]. Available from: https://knhanes.
cdc.go.kr/knhanes/sub04/sub04_04.do.
15. KCDC. National Health and Nutrition Survey. 6th, 2nd year survey [Inter- net]. Osong: KCDC [cited 2015 Oct 14]. Available from: https://knhanes.
cdc.go.kr/knhanes/sub04/sub04_04.do.
16. KCDC. National Health and Nutrition Survey. 6th, 3rd year survey [Inter- net]. Osong: KCDC [cited 2017 Mar 17]. Available from: http://www.cdc.
go.kr/CDC/contents/CdcKrContentView.jsp?cid=60940&menuIds=
HOME001-MNU1130-MNU1639-MNU1748-MNU1752.
17. Korean Society of Hypertension. 2013 Hypertension guidelines [Internet].
Seoul: Korean Society of Hypertension [cited 2017 Mar 17]. Available from:
http://www.cdc.go.kr/CDC/contents/CdcKrContentView.jsp?cid=60940
&menuIds=HOME001-MNU1130-MNU1639-MNU1748-MNU1752.
18. Kirkendall WM, Burton AC, Epstein FH, Freis ED. Report of a subcommit- tee of the postgraduate education committee, American Heart Association : recommendations for human blood pressure determination by sphygmo- manometers. Circulation 1967; 36: 980-8.
19. Korean Society for The Study of Obesity. 2012 Obesity treatment guidelines
[Internet]. Seoul: Korean Society for The Study of Obesity [cited 2017 Mar 17]. Available from: http://www.cdc.go.kr/CDC/contents/CdcKrContent- View.jsp?cid=60940 &menuIds=HOME001-MNU1130-MNU1639- MNU1748-MNU1752.
20. Korean Diabetes Association. 2011 Diabetes mellitus treatment guidelines [Internet]. Seoul: Korean Diabetes Association [cited 2017 Mar 31]. Avail- able from: http://www.diabetes.or.kr/pro/publish/guide.php?code=
guide&year_v=2011&mode=view&number=281.
21. SciPy: Open Source Scientific Tools for Python [Internet]. Version 0.13.3.
Jones E, Oliphant E, Peterson P, et al. c2001- [cited 2008 May 16]. Available from: http://www.scipy.org/.
22. Kim HR, Son HG. Prevalence and risk factors of hypertension in Korean el- derly. Basic Nurs Sci 2012; 14: 282-90.
23. Ko IS, Kim GS, Lim MH, Lee KJ, Lee TW, Park HS, et al. Effects of health ed- ucation on the knowledge and self-care of hypertension for visiting nursing clients. J Korean Pub Health Nurs 2007; 21: 134-45.
24. Chen XW, Lin X. Big data deep learning: challenges and perspectives. IEEE Access 2014; 2: 514-25.