ⓒ 2020 Korean Association of Physical Anthropologists
This is an Open Access article distributed under the terms of the Creative Commons Attribution Non-Commercial License(http://creativecommons.org/ licenses/by-nc/3.0) which permits unrestricted non-commercial use, distribution, and reproduction in any medium, provided the original work is properly cited.
ISSN 2671-566X (Online)·ISSN 2671-5651 (Print) Anat Biol Anthropol Vol. 33, No. 2(2020) pp.79~97
https://doi.org/10.11637/aba.2020.33.2.79
INTRODUCTION
The present study focuses on the effects of intensive, long-term exploitation of domestic animals, by their human domesticators, using the site of Inamgaon as a case study.
The faunal sequence at Inamgaon is both well-documented and extensively studied, and shows a notable transition to
preferential herding of ovicaprids at the end of the Jorwe period(1400 BCE) to the Late Jorwe(1000 BCE), probably due to the onset of aridity in the region that made the keep- ing and maintenance of large herbivores such as Cattle and Buffalo-hitherto the most common animals at the site - no longer feasible. Animals such as sheep and goat are resis- tant to high aridity and can subsist on lower quality fodder such as shrubs[1], and are therefore more suited to sur- viving under arid and semi-arid conditions. In the present study, samples of sheep/goat and cattle/buffalo were taken from the site of Inamgaon and prepared for histological analysis through optical microscopy. Sheep and Goat, dure to their intensive exploitation in the period concerned, are the primary focus for this work, while cattle and buffalo -
Applications of Bone Histology in Tracking Exploitation Markers:
From the Site Inamgaon, Maharashtra
Prateek Chakraborty
11Department of Ancient Indian History, Culture and Archaeology, Deccan College Post Graduate and Research Institute
Abstract : Bone Histology, particularly the study of osteon morphology and morphometry is used extensively by palaeontologists to reconstruct pre-mortem conditions in large vertebrates. The skeletal system is dynamic and undergoes modification throughout an animal’s life cycle in response to various physical and environmental stimuli, most notably in the remodelling and reconfiguration of skeletal tissue at the microscopic level. The size, shape and distribution of osteons in the long bones of a vertebrate animal have often been proved to reflect various changes engineered by adverse environmental conditions. The present work assumes that the exploitation of domestic animals - especially when carried out intensively over a relatively short period - can engender similar changes in the osteon microstructures of these animals through activity such as herd migration, fattening, confinement and so on.
Taking the Late Jorwe phase at the Deccan Chalcolithic site of Inamgaon as a case study, the present work carries out a histological examination of bone samples of Sheep(Ovis aries) and Goat(Capra hircus), which were intensively exploited at the site during this period. The shape, frequency and configuration of osteons(and other histological features) are recorded and correlated with the different phases of exploitation in order to determine their effect on the skeletal tissues.
Keywords : Histology, Bioarchaeology, Chalcolithic, Osteon morphology, Optical microscopy
Original Article
The author(s) agree to abide by the good publication practice guideline for medical journals.
The author(s) declare that there are no conflicts of interest.
Received: May 1, 2020; Revised: June 18, 2020; Accepted: June 18, 2020 Correspondence to: Prateek Chakraborty(Department of Ancient Indian His- tory, Culture and Archaeology, Deccan College Post Graduate and Research Institute, Pune, India)
E-mail: prateek.chakraborty@dcpune.ac.in
which experience a sharp drop in exploitation and prefer- ence over the same period of transition - are observed as a sort of comparison or control population.
The study of man’s relationship with animals and the exploitation of that relationship- in the form of domestica- tion- has long been a cornerstone of modern archaeology.
The present work aims to expand on one aspect of this exploitation, namely the modification of bone during the animal’s life cycle by the processes of domestication and exploitation.
Histology can be a powerful analytical tool in under- standing pre-mortem modification of bone tissue by natural agents. It has been used extensively in palaeontological studies, such as Reid[2], Chinsamy[3] to reconstruct the lifetime conditions of extinct fauna, or to assess the im- pact of environmental factors on fossil taxa[4]. Enlow and Brown[5] used histology as a tool to study transitions from fossil to modern taxa by comparing the histological fea- tures of the two to determine a sequence of change.
As far as the use of histology in archaeozoological con-
texts is concerned, early attempts involved comparative and descriptive studies[6] the use of histometric parameters for species identification[7], age determination[8], and spe- cies identification between closely related genera such as sheep and goat based on osteon morphology[9] or animals with large bones that appear similar within the fragmented archaeological context. However, the potential of bone histology studies in reconstructing lifetime conditions on archaeological bones has only been tentatively explored till date. Thus the present work serves as a demonstration of the technique, as well as the parameters and methodologies applicable, on the faunal material from the Jorwe- Late Jor- we transition at Inamgaon.
MATERIALS AND METHODS
The Site
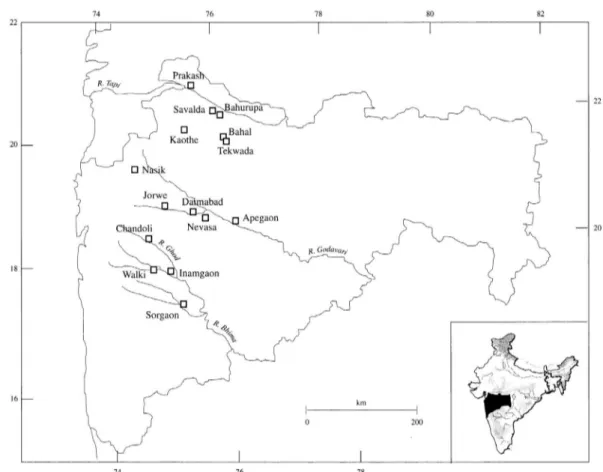
The site of Inamgaon, on the bank of the River Ghod in the Bhima Valley(Fig. 1), was chosen as the primary
Fig. 1. Map of Present-day Maharashtra showing the locations of Important sites during the Deccan Chalcolithic(After Pawankar and Thomas 1997).
focus for the present study. Apart from being an important regional centre and a major Deccan Chalcolithic site in its own right, Inamgaon was also subject to systematic, thor- ough excavation carried out by the Department of Ancient Indian History, Culture and Archaeology, Deccan College Post Graduate and Research Institute. The excavations were initiated with the process of determining the entire cultural sequence at the site, which as mentioned experi- enced multiple levels of occupation from the Malwa to the Late Jorwe. Following its discovery by Shri R.L. Bhide of the University of Pune in 1968, Inamgaon was the first large multi-cultural site to be excavated that was both rela- tively undisturbed and easy to access. The site was excavat- ed over twelve seasons, namely 1968~71, 1972~74, 1975 and 1977~83. In addition to the socio-economic conditions and religious beliefs of the inhabitants of the site, a large amount of environmental and ecological data was obtained through ecofacts, palaeoclimatological analysis, and soil studies which were compiled into a comprehensive excava- tion report[10].
One of the most interesting pieces of evidence to come from Inamgaon is the demographic pattern of animal ex- ploitation and preference. With the rapid onset of aridity in Phase III, corresponding with the decline of the Jorwe around 1000 BCE, the populations of Cattle/Buffalo at the site plummet very rapidly to be replaced by sheep and goat as the primary domesticate, which likewise experience an exponential growth in population. This kind of mass-scale exploitation of the animals, over a relatively short period of time, provides an excellent theoretical backdrop for the analysis of stress generation through overexploitation in domestic animals. Thus, this period of transition serves as the primary source of data for the present work. The site of Inamgaon consists of five mounds in total, over an area of 530×430m. Four of the mounds are situated together while mound no. V is a little distance away, west of mound no. I.
Mounds I to IV form a single horseshoe shaped cluster, with INM I forming the principal area of the settlement that was occupied throughout its existence. The residences of the chief as well as the elite were both situated here, as well as those of the artisans. The material examined from the present work was taken from this mound.
Materials
The data utilised in the present work is sourced both
from archaeological and modern contexts, consisting pri- marily of data generated from actual physical specimens, as well as published data from previous work in some cases.
As mentioned above, the present work aims at finding sig- natures of environmental stress in the bones of domesticat- ed animals from selected sites in the Deccan Chalcolithic.
Specifically, the intensive exploitation of ovicaprids in the Late Jorwe period(1000~700 BCE) was focused on, since the large numbers of animals documented at the site during this phase, in addition to what is known about the climatic and environmental changes associated with this phenome- non, presented an interesting case study for the association of microscopic skeletal stress markers with various envi- ronmental factors during this time.
Sample Selection Criteria
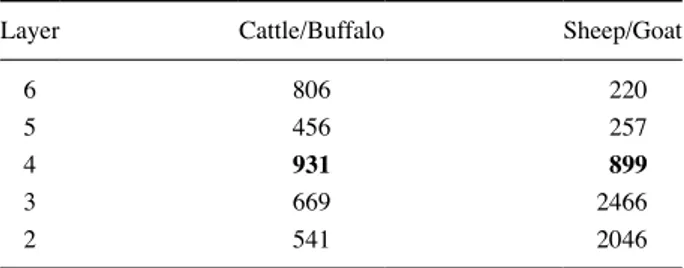
The first step in selecting the samples was to identify the layers that were relevant to the present study. The first step in this process was to study the stratigraphy of the site of Inamgaon and record the point of transition from Cattle to Sheep as the main domesticate at the site, using the primary faunal analysis by Thomas[11] as reference.
The actual transition is seen to have happened in Layer 4, where the number of sheep/goat at the site surpass those of cattle(Table 1). This corresponds to the Late Jorwe(Phase III, 1000~700 BCE) occupation at the site, after the onset of aridity as mentioned in the preceding discussion. The Late Jorwe Phase at the site is represented by layers 1 to 5 at the site, which were all selected for study. In addition, the final Layer of the Jorwe period(Phase II, 1400 to 1000 BCE) was also sampled as a precedent for the main Late Jorwe samples. Only Layer 1, being a surface layer and dis- turbed in terms of context, was not utilised for the present study.
Layers 2 to 6 were thus retrieved from storage in the
Table 1. Population dynamics of Cattle/Buffalo vs. Sheep/Goat at Inamgaon, Layers 6 to 2
Layer Cattle/Buffalo Sheep/Goat
6 806 220
5 456 257
4 931 899
3 669 2466
2 541 2046
repository of Deccan College Pune and the material exam- ined to identify the Sheep/Goat and Cattle/Buffalo bones.
These two groups of taxa are treated as one single unit in the Inamgaon report, and therefore the present study followed the same criteria- though it was observed that as stated by Thomas[11], the bulk of the ovicaprid samples (above 90%) belong to goat while the same applied to the Bos/Bubalus group with over 90% of the bones belonging to cattle. The identification of the bones was done using major diagnostic features, as well as through comparison with modern specimens of goat and cattle, following the criteria set out in Pawankar[12], Boessneck[13] and Payne [14].
For the sake of comparison, samples were also taken from the Deccan Chalcolithic sites of Kaothe and Walki.
Kaothe dates back to the Savalda period(2300~2200 BCE)[15], representing one of the first scenarios of prima- ry animal domestication in the region, consisting chiefly of large-bodied Cattle/Buffalo.
The site of Walki is concurrent with that of Jorwe period Inamgaon(1400~1000 BCE)[16], but is a small satel- lite settlement that was most likely a seasonal farmstead.
Together, these two sites present a significantly different environment both in terms of chronology as well as physi- cal space, and it is worth observing the histological trends from samples taken from these sites as a comparison to the primary data from Inamgaon.
Methodology
The present work takes guidance from prior studies cor- relating histology with interrupted or retarded growth, such as in resource deficient environments, as demonstrated by Köhler and Moya-Sola[17], which used bone histology to point out the extremely slow growth of Myotragus, a fossil bovid from the Plio-Pleistocene period that was endemic to the Balearic Islands in the Mediterranean Sea. This was linked to the pressure of living and growing in a space and resource limited environment as represented by the island, which resulted in an extremely slow and flexible growth rate. A similar report was done on the growth pattern of Nuralagus, a giant species of rabbit found again on the Mi- norca island in the Balearic group. Studies like this demon- strate how mammals have succeeded evolutionarily by being extremely adaptable and responsive to their imme- diate physical environments, and the histological record of
their bones showcases this extremely effectively[17]. The reconstruction of life history from the histological analysis of an animal’s bone is thus an extremely viable technique, as demonstrated by studies such as Kohler[18] and Naca- rino-Meneses et al.[19], and can be applied to the material from the transitional period at Inamgaon, where factors such as lack of space and nutrition(owing to confinement and fodder selection of animals by their human domestica- tors) come into play over the period of exploitation, espe- cially the intensive phase seen during the Jorwe-Late Jorwe transition.
Additionally, a correlation between histology and physi- cal stress has been reported by studies such as van Oers et al.[20] and Goodman and Clark[21], who connected vari- ations in osteon diameter with physical strain, as the wear and tear on bones associated with physical strain causes the remodelling of damaged bone.
A series of studies by Skedros et al.[22] suggests cer- tain morphological patterns in osteons as indicative of load-bearing, using examples from both wild and domestic [22] animals. The association of Osteon Morphology with strain or load, in the femurs of sheep and goats, was also confirmed by Zedda et al.[9].
Samples for histological analysis were prepared accord- ing to Chinsamy and Raath[23] in preparing histological sections. Generally, the femur is by far the most suitable for sectioning, but given the inconsistent preservation of differ- ent skeletal elements and the availability of the skeletal ma- terial, especially for sheep/goat, femora as well as humeri, radii, tibiae and metacarpals were selected for analysis, in that order of preference. All the bones selected were parts of the midshaft, with at least 1/2 of the cortex or more in- tact.
After recording the shaft diameter and cortical thickness, along with any other morphological features, the bones were then prepared for histological study. The bones were first embedded using 2-part epoxy resin in small plastic molds. Following this, section slices were taken from the long bones as close as possible to the middle of the shaft, in order to avoid the presence of trabecular bone in the histological sample. These slices were ground down using emery paper of 80, 160, and 320 grit, after which they were mounted on to glass slides using clamps and the same epoxy resin as mounting medium. After drying the slides were further trimmed down, using 160, 320, and 600 grit emery paper, following which they were subjected to wet
polishing using carborundum powder at 600 and 800 grit.
In some cases, the samples which were not clearly visible were further polished using 1200 grit levigated alumina.
The prepared slides were observed initially at 5×, 10×, and 20× magnification under a JENAMED-800 micro- scope and their features recorded in a table format.
An effort was made to avoid sampling tibiae following the recommendation of Köhler[18] and Nacarino-Meneses et al.[19], who advise against the use of Tibia for histolog- ical study due to its generally poor record of preservation.
However, some bones were taken on an experimental basis where they were either exceptionally well preserved, or no other alternatives from that particular context were avail- able. In addition, while metapodials were generally the last preferred choice for optical analysis, it must be noted that certain forms of load bearing stress can be observed pri- marily in the metapodials[24], and so it was ensured that a few metapodials were selected from each context where they were available.
A total of 327 histological samples were taken from In- amgaon, Kaothe and Walki using these criteria.
The following label pattern was used for the specimens- (site) (layer number) (Taxon) (Bone number) where the taxon is represented by the letter ‘s’ for the “Sheep/Goat”
group and ‘b’ for the “Buffalo/Cattle” group. Therefore, INM 4s03, for example, will represent the third Ovicaprid sample collected from Layer 4 at Inamgaon.
The optical samples were observed at the Department of Botany and the Department of Geology, Savitribai Phule Pune University as well as the Palaeontology Division, Agharkar Research Institute, Pune. The microscopes used for the analyses were the Leica DM3000 and Nikon Olym- pus Optical microscopes. The specimen slides were not dyed in most cases, but a drop of water was added to some of the samples before observation in order to increase the clarity of the sample. A few of the samples, which were not clearly visible initially, were dyed with Eosin red.
The shaft diameter and cortex thickness were measured before embedding the sample, using digital Vernier calli- pers. Epiphyseal fusion was recorded where possible as an indicator of maturity. In general, cortical thickness is direct- ly proportional to the rate of formation of secondary bone tissue, or the replacement of older bone tissue by its newer counterpart. However, as the animal ages, especially under stressful conditions, the rate of replenishment slows down, leading to the thinning of the cortex[25].
Due to the general culling practices in the Deccan Chal- colithic, especially at Inamgaon, however the usual age of the animals at the time of slaughter is fairly young, at 3 years of age or less[11] and therefore large bones with thin cortices are uncommon. All histological features were recorded along the dorsal, ventral, medial and lateral side of each bone. It must be noted that exact side identification of the bone was not always possible in all the samples, and therefore the parameters set by Zedda et al.[9] and Mayya et al.[26] were used in these cases to tentatively identify the lateral and medial loci on the basis of their histological profile. Dorsal and ventral, of course, can easily be identi- fied through the cross section for different bones, from the presence of markers such as the deltoid ridge in the humer- us, or the Tibial crest. Not all the samples have all four loci intact, and the corresponding missing segments could not be observed.
Attention was also given to the presence of primary ver- sus secondary bones. Primary bones are the bone tissue that is formed in areas where there was no bone tissue previ- ously, forming around the mineralization of cartilage tissue.
Secondary bone, on the other hand, is formed due to the remodelling of primary bone due to damage or strain, as part of the natural life history of the animal. The two types are structurally distinct and can be differentiated at the mi- croscopic level.
Osteon diameter was calculated using a geometrical method used in Chamberlain and Forbes[27] where the maximum and minimum width of the osteon is measured and averaged, which are then converted to numerical val- ues, thus arriving at the value in μm. This is repeated for the largest and smallest osteon in several zones per locus and then averaged to give the average osteon size in that region.
In case of the plexiform bands, the band thicknesses were simply measured against the 500μm scale in all the plexi- form regions of the slide, and then averaged. In case of plexiform bands, the number of bands were counted, their individual widths measured and the average width calculat- ed from there.
Osteon density was measured in a similar manner, where the number of osteons within a 500μm square was count- ed, and readings taken from 5 different points within the observable area of each locus in the slide, the average was calculated to give an estimate of the osteon frequency. In addition, any abnormalities in the pattern of distribution of
osteons was recorded. For plexiform bands, the density/
frequency was easier to calculate due to their regular and fixed arrangement; the band frequency was calculated sim- ply by the number of bands against the 500μm scale. In ad- dition, the four observed zones in each slide were assigned a value along the Oxford Histological Index developed by Hedges et al.[28], which documents the extent of preserva- tion of cortical bone and the damage done by taphonomic factors.
Histological Parameters
Within the scope of the present work, namely identifying various histological markers associated with stress, the most important observations are on the compact cortical bone tissue found in the central shaft of long bones, away from the two extreme epiphyseal ends. The extremities of long bones and joints consist of spongy bone tissue known as trabecular or cancellous bone, which is of limited value to histological studies. The features under study will all ap- pear in the cross-section of the bone cortex, i.e. across the bone shaft, rather than in the transverse section or along the bone shaft.
As with all biological tissue, cortical bone has 4 hierar- chical levels of configuration going from 0(Solid material) to 3(Collagen fibers). The features relevant to histological study are found mainly in level 1, which may be outlined as follows: The level 1 structures in cortical tissue follow four main configurations, which in turn can be divided into two groups: Primary bone and Secondary Bone[29]. Primary bone refers to the bone tissue that is generated in spaces where there was no bone tissue before, sometimes through the mineralisation of cartilage. There are several histologi- cal features that are of interest to the present study.
The first is Woven, also known as Fibrous or Woven-fi- bered bone, is one of the simplest and least organised forms of bone tissue, consisting primarily of featureless fibrous bundles. The only notable feature of woven bone is that it can generate on its own, in places where there is neither pre-existing bone tissue nor cartilage. Woven bone occurs primarily in very young animals, and also in plac- es that have experienced trauma or disease leading to the breakdown of existing bone tissue, such as in a fracture, where the body’s response is to reinforce the weakened or affected tissue. Thus, the presence of woven bone in adults may indicate either underdevelopment, or some significant
trauma.
As far as archaeological specimens are concerned, wo- ven bone is also the first to deteriorate and break up, due to its lack of structural integrity[30].
The second form of Level 1 cortical tissue is Plexiform bone. In Plexiform bone, the tissue is arranged into brick- like structures occurring in layers. Like woven bone, plexi- form bone is also arranged in a lamellar structure and tends to grow rapidly, but unlike woven bone its more compact and regular structure allows it to withstand greater mechan- ical strain. Plexiform bone is of particular interest to this study, since it is not only a marker of stress adaptations but also extremely common in both Cattle/Buffalo and Sheep/
Goat bones, and almost completely absent in human bones.
Plexiform bone generally always occurs around the peri- osteum or the outermost margin of the bone cortex, but in many cases may spread over the entirety of the tissue.
Plexiform adaptations in bone indicate a response to an external stimulus that required the formation of skeletal tissue not only comparatively fast, but also able to retain both strength and support/rigidity over a long period of time. Mayya et al.[26] have shown that plexiform bone is found increasingly towards the proximal/posterior side of the bone, based on a study of modern sheep/goat femora.
Therefore, in archaeological assemblages where the bones are often broken, an increase in plexiform structures at the histological level throughout the cortex of a given sample may indicate that it belongs to the proximal or posterior side, at least in case of femora.
Apart from the fibrous and lamellar features in the bone, the Haversian system is also of interest. The Haversian system is characterised by the presence of Osteons, which are tubular structures running along the length of the bone and appear as roughly circular or elliptical shapes in the cross section. These are essentially rings of lamellar tissue surrounding a central Haversian Canal that contains blood vessels, nerves and bone lining cells. The Haversian Ca- nals convey both nutrients and metabolic waste among the bone cells or osteocytes found within the bone tissue. The individual Haversian Canals may in turn be connected to each other through smaller Volkmann’s Canals. Primary bone may in turn experience remodeling as a response to external stress factors, changing into Secondary Haversian systems through the breakdown, resorption and recreation of existing bone tissue. Secondary Osteons are identifiable through the larger Haversian canals, the presence of Inter-
stitial Bone, which is the lamellar bone tissue found in the spaces between osteons only in secondary bone tissue. Ce- ment Lines separating the osteons from the interstitial bone are another identifier for secondary osteon systems. They also tend to be slightly larger than primary osteons[29].
Secondary Osteons and haversian systems are also an im- portant marker for the study of stress on bones, since they are a clear indicator of the remodeling of bone tissue in re- sponse to various stimuli, whether in the form of mechan- ical strain or age and pathology related degradation. Thus, the histological profile of skeletal tissue acts as a record of the various stresses that may have affected this part of the organism, and the responses taken by the animal’s body to adapt to the same. Various interactions between stress and bone histology have been documented in previous work.
Chamberlain and Forbes[27] have connected lactation in mammals with bone remodeling, using cattle as a case study. According to this study, the bone cortex of lactating mothers undergoes intensive restructuring due to the loss of minerals through the milk, leading to the formation of sec- ondary osteons. The histological profiles of lactating cattle therefore showed a high number of secondary osteons as well as newly formed osteons, due to the constant cycle of tissue formation and breakdown. Similar results were found with lactating dogs by Vajda et al.[31].
In both animals, the density of the secondary osteons was found to be comparatively high. Horwitz and Smith also demonstrated that lactation causes an interruption in the bone modeling process in animals living under uncon- trolled and stressful environments[32]. Using two sets of data, one from sheep living in controlled environments and one from sheep in free-ranging environments subject to seasonal and environmental stress, Horwitz and Smith showed that the free-range sheep showed greater signs of bone cortex thinning in lactating females. This is likely due to the combined stress of mineral loss through lactation and the usual seasonal stresses such as variations in food supply, climate change and so on that affect ovicaprids(as seen for example in [33]), which leads to an interruption of the normal process of bone remodelling occurring during pregnancy and lactation. Rather than bone tissue being bro- ken down and resorbed into new tissue, part of the mineral component of the mother’s bone is absorbed instead by the foetus and later passed out of the body through the moth- er’s milk. This leads to a decrease in the combined cortical thickness(CCT) in the female free-range sheep compared
to their counterparts that were kept in controlled, stress-free conditions. It was seen that the free-range sheep that had given birth often experienced osteoporosis, and the ratio of shaft width to cortical thickness was seen to be consistent for the two groups with cortex thickness being noticeably thinner in the sheep living under poor environmental condi- tions.
Apart from nutritional stress as seen in the macro-mor- phology of the bone cortex, mechanical stress often leaves visible signs on the histological profile of bones. Mechan- ical stress can be defined in terms of attrition of the bone material over time[34], and consists of two major forms- Tensile stress and compressive stress. Tensile stress is usually related to any kind of torsion being applied to the natural angle of the bone, and is seen not only in goats or quadrupeds but even in birds[35]. On the other hand, com- pressive stress results from excessive load-bearing, and acts in the same direction as the bone shaft itself[44]. Com- pressive stress has also been connected to bone remodeling and the development of secondary osteon systems, as well as changes in osteon morphology[9,36]. Scholars such as Skedros[22] and Zedda et al.[9] have identified different zones in the bone for these two different stress patterns, with compressive stress - as represented by secondary os- teon formation, higher osteon counts and elliptical osteons- being confined to the ventral and medial side while tensile stress is confined to the dorsal and lateral sides of the fe- mur.
Mayya et al.[26] has used femur bones from Osmanaba- di goats to show that tensile stress in femurs, while not causing the development of secondary osteons, nonethe- less reflects in the structure of the plexiform bone in these animals. Therefore, the presence of narrower bands in the plexiform structure of long bones is indicative of adapta- tions to excessive tensile mechanical stress in ovicaprids, which may be a result of regular movement of herds to and from their pasture areas or even due to restlessness during mating season[37]. Köhler and Moyà-Solà[17] have also shown the tightening of plexiform bands in animals that are brought up in resource-limited environments, using the Myotragus bones from the Balearic Islands as an example.
Conversely, stress in secondary bone tissue is usually repre- sented by increases in osteon density as well as changes in osteon morphology to a more elliptical shape, as discussed above in the work of Zedda et al.[9]. In addition to this, Mohsin et al.[36] had previously pointed out that cracks
along the cement lines in the margins of secondary osteons are also a response to stress. Osteon cracking happens as an adaptive mechanism that allows the tissue to focus the stressor forces into a certain pattern, using the cracks as points of concentration that prevents further damage to the tissue. Thus the osteon cement line cracks act both as bar- riers as well as conduits for the mechanical force, concen- trating it into patterns that limit its further growth along the bone cortex. Underdevelopment or slow growth can also be seen in the cortical bone in the form of Lines of Arrested Growth or LAGs that appear in the cortical tissue[17,19].
LAGs, otherwise referred to as Harris Lines(especially when dealing with human bones) represent periods of inter- ruption of growth, which are represented as both lines and thicker bands of increased opacity in the bone cortex[26].
Nacarino-Meneses et al.[19] also connects the presence of ‘annuli’ or poorly vascularised rings in the bone cortex (generally along the periosteal margin) with the lack of adequate resources for optimal growth. The present skeletal material was examined keeping these parameters in mind, in order to isolate and describe any of the above stress sig- natures that were detected in the present material.
RESULTS
Metric Observations(Cortical Thickness)
In sheep/goat, among the four localities(Dorsal, Ventral, Lateral, and Medial) observed for all the cortical speci- mens, the cortical thickness of each locality was recorded for comparison with the others. These were documented both layer-wise and bone wise.
Comparisons of Shaft diameter and cortical thickness over the transitional period were carried out individually for the three most common bones encountered in the anal- ysis, namely Femora, Humeri, and Radii. The remaining bone types, namely tibiae, metacarpals, and metatarsals, were too few to be considered for statistical analysis.
The following observations can be made:
• With regard to femora, there is a definite decrease over the transitional period in the overall shaft diameter, indi- cating either a reduction in size, or generally a lower age in culling. Although most of the bones were found with either complete or partial epiphyseal fusion, Zeder[38]
tells us that Epiphyseal fusion for femora completes by approximately 36 months of age, which is compatible
with Thomas’[11] estimation of culling ages at Inamga- on.
• There is a corresponding decrease in the shaft diameter of humeri, but the shaft diameter of the radius is compar- atively unchanged.
• When considering the cortical thickness, apart from ob- serving changes in the average values of cortex width for femora, humeri, and radii, it is also worth looking at the changing trends within the 4 different loci in each of these bone types. It is seen from the above graphs that the general trend for cortical thickness in these three bone types is a slight decrease from the pre-transitional to the post-transitional period. It is also worth noting that the lowest values for cortical width in these bones are generally in layer 4, which as mentioned previously is the exact point of transition where the number of sheep/
goat at the site overtakes that of cattle.
• Additionally, however, analysing the absolute, individual values of cortical width for the four loci in each bone also yields some observations: In the femur, the trend in the pre-transition period is for the cortical width to be greatest at the lateral, followed in order of thickness by the medial, dorsal, and ventral; However, at the end of the Late Jorwe phase, the thickest femoral cortex is found in the ventral, followed by the dorsal, lateral and medial. In the humerus, the highest cortex thickness is in the dorsal, followed by the ventral, medial, and lateral;
by the end of the Late Jorwe this has changed to the ven- tral, followed by the lateral, medial, and dorsal.
• The trend lines for the radius again are different from the above as they appear to converge by the end of the tran- sitional period. Pre transition, the cortical measurements show dorsal, lateral and medial grouped together with a lower value for ventral. At the end of the observed peri- od, the trends for all four cortical values are close to each other.
The thinning or thickening of cortical bone was observed by comparing the Average cortical thickness of each sam- ple(by averaging the values from the four loci) with the shaft diameter recorded during analysis.
• For the purpose of comparison, the modern samples ob- tained from slaughterhouses were analysed in terms of cortical thickness: shaft diameter. It was observed that the modern specimens fall into roughly two categories- smaller bones with thick cortices and larger bones with thinner cortices. This is explained by the aforementioned
model of bone loss due to both age and lactation, as given in Chamberlain and Forbes[27] or Horwitz and Smith[32], explaining the thinner cortical rings in old- er animals as compared to younger. This demarcation is also present in the archaeological samples from the transitional period, but to a lesser degree as generally all the archaeological specimens have a thinner cortex in general(Fig. 2a). When dealing with specifically femora, it is also seen that the cortical thicknesses of modern, stall-fed goats are more uniform across the 4 loci than the femora from Inamgaon, in addition to being thicker overall.
Histological Features: Quantitative Trends for Sheep/Goat
The quantitative histological aspects of the Sheep/Goat samples from Inamgaon are given in, recording the Osteon diameter in μm and Osteon diameter per 500μm. Out of
all the Sheep/Goat samples taken from the five layers at Inamgaon, Osteons were seen in a total of 69 while plexi- form bands appeared in 59 samples. The remaining 32 samples consisted of woven bone with no other histolog- ical features. As far as osteons are concerned, the period in question sees a drastic increase in osteon diameter(Fig.
2b). When looking at locus-wise changes in Osteon diam- eter, it is seen that by the end of the transitional period the lateral locus tends to have the largest osteons, followed by the ventral, dorsal and medial, marking a clear change from the trends seen in the earlier layers 5 and 6. In addition, it is seen that on average, the density of osteons in the cortical tissue decreases in the course of the period concerned, but again the Lateral side becomes the locus with the highest osteon density among the 4, followed by the ventral, dorsal, and medial.
Similar results are seen when comparing the data from Kaothe, with Osteon size increasing but Osteon density/
frequency decreasing. Again, there is a shift to the lateral
(a)
(b)
Fig. 2. (a) Ratio of cortical Thickness in Inamgaon samples(Post-transition) compared to modern samples. (b) Average osteon diameter changes in Inamgaon Sheep/Goat, Pre to Post-Transition.
side in terms of these values, followed by the ventral, dor- sal, and medial. When comparing the data from Walki with Pre-Transition Inamgaon, there is no major difference in the average Osteon size; however, osteon size is greatest in the medial locus in the Walki specimens, as opposed to those at Inamgaon. As far as Osteon frequency is concerned, the samples at Inamgaon show overall higher values, favouring the lateral side of the bone as opposed to the medial as in the Walki samples.
In the post-transition period, the values for Osteon size and frequency are almost the same between Walki and Inamgaon. Only the osteon frequency increases slightly in the case of Post-Transition Inamgaon Sheep/Goat, which is partly due to the number of stray osteons seen in the Walki specimens affecting the statistical average.
It is interesting to note that Plexiform bands are practical- ly absent at both Kaothe and Walki, with only a single spec- imen from the latter showing plexiform bands. At Inamga- on, there is a decrease in the plexiform band width over the period in consideration. While the overall average value(As indicated by the trend lines) does not decrease drastically, it is worth noting the extremely thin bands seen chiefly around Layer 4 i.e the transitional phase. Likewise, Band Frequency per 500 microns also increases between Layer 6 to Layer 2, with its highest points in seen Layer 4. The in- ter-cortical values for plexiform band width and frequency are also both notably uniform, with only the plexiform band frequency among the four different cortices growing slight- ly apart by the end of the time period. When compared to the modern samples, there is very little difference in overall plexiform tissue apart from a slight decrease in plexiform width and corresponding increase in frequency.
Qualitative Histological Features for Sheep/Goat Inamgaon, Layer 6: Apart from the general appearance of woven bone(such as in Sample 6s04, Fig. 3a), the most notable feature of the Sheep/Goat bones of Layer 6 is the prominent appearance of two different cortical features within the same bone, such as Haversian and plexiform in sample 6s02(Fig. 3b) or 6s03, as well as 6s17, or woven and haversian as seen in 6s14. This shows the variability in bone modelling occurring in the samples during this time period, not only within a single bone cortex but also vary- ing within a single locus as well. Apart from these speci- mens showing transitions between two different cortical
features. This layer also demonstrates dense haversian tis- sue such as in 6s24(Fig. 3c). Wherever osteons are visible, they are small and extremely crowded. Likewise, typical plexiform tissue with both narrow plexiform bands such as 6s18 and wide bands as in 6s06 are present. In 6s17, A thick dark line is visible towards the endosteum, interrupt- ing the plexiform bands, that is very likely a Line of Arrest- ed Growth(LAG) or Harris Line. Given its proximity to the endosteum, it would appear that the growth interruption occurred fairly early in the animal’s life, which may be a byproduct of low milk intake from the mother(due to milk- ing by human domesticators) as seen in Horwitz and Smith [32] as mentioned above. Another specimen of note is 6s53 (Fig. 3d), where the osteons show signs of deformity and remodelling, part of the tissue stretching into band-like structures near the endosteum.
Inamgaon, Layer 5: Layer 5 is unusual in that most of the samples observed consisted of well-preserved woven bone but with no other histological features. This is seen in samples such as 5s01, 5s04, 5s10, and others. Sample 5s21(Fig. 3e) is one exception as it shows a partial tran- sition from woven to plexiform bone near the endosteum.
Samples such as 5s35 and 5s36 consist of haversian tissue, again with small, round osteons as in Layer 6.
Inamgaon, Layer 4: Layer 4 marks a noticeable de- parture in terms of histology from the preceding layers.
Samples such as 4s02, 4s05, 4s07, 4s10, 4s13. 4s16, 4s18, 4s19, 4s23(Fig. 3f), and 4s72 show extremely thin, regu- larly shaped plexiform bands, which are unseen in the other layers both in terms of their width and regularity. Samples with Haversian tissue such as 4s11(Fig. 3g), 4s31 and 4s71 show a large number of Volkmann’s canals, often with mul- tiple canals branching off from a single osteon. Samples such as 4s31, 4s44, and 4s47 again show combinations of haversian and plexiform tissue. While samples like 4s20 and 4s31, and 4s44 show small, circular osteons, samples like 4s11 on the other hand show the first signs of some- what elliptical osteon shapes. Cement line cracks are also visible in the osteons of samples such as 4s31.
Inamgaon, Layer 3: Layer 3 at Inamgaon has a number of notable features. First, elliptical osteons become com- mon in the samples that have haversian systems, such as at 3s15, 3s20, 3s46, 3s47 and 3s64. Osteons also increase in size, and sample 3s64 again displays osteons with multiple Volkmann’s canals. Samples 3s46 and 47 have high osteon density in general, but 3s15 is also notable for having the
osteons banding and crowding together in a manner that had not appeared in any of the preceding layers. Other recurring histological features are plexiform bands and cortices with multiple features, such as woven/plexiform in
3s72. Sample 3s64 also shows a Line of Arrested Growth roughly in the middle of the cortex.
Inamgaon, Layer 2: The sheep/goat bones of Layer 2 continue to show some of the trends from preceding layers, (a) (b) (c)
(d) (e) (f)
(g) (h) (i)
(j) (k)
Fig. 3. (a) Woven Bone, Inamgaon specimen 6s04. (b) Transition from Haversian to Plexiform Bone, Inamgaon, Layer 6, specimen 6s02.
(c) Haversian tissue with small circular osteons. Inamgaon sample 6s24. (d) Haversian tissue showing osteon compression and banding towards endosteum(lower left). Elongation and remodeling of osteons visible. Inamgaon sample 6s53. (e) Woven bone transitioning into Plexiform bands towards endosteum. Inamgaon sample 5s21. (f) Inamgaon 4s23: Thin cortex and narrow plexiform bands. (g) Transition from woven to Haversian bone, Haversian bone has high number of Volkmann’s canals. (h) Inamgaon 2s43. Osteon banding and crowding.
(i) Kaothe 2s09. OSteon banding and Lines of Arrested Growth. (j) WLK 2s06, Plexiform bone with stray osteons. (k) WLK 2s13. Woven bone with Lines of Arrested Growth near the Periosteum and osteon banding.
notably from Layer 3. For example, Sample 2s03 has large elliptical osteons again with multiple, branching Volkmann’s canals. Samples 2s09, 2s41, and 2s43(Fig. 3h) show osteon crowding and banding as seen previously in layer 3. Sample 2s24 again shows a transition in the cortex from woven to Haversian towards the endosteum. Samples with both wide and narrow plexiform bands are seen in this layer.
Kaothe, Layer 2: The number of observable specimens from the habitation at Kaothe is considerably less compared to those from Inamgaon, in part due to the poorer preser- vation of the material as well as the considerably shorter habitation period at Kaothe. However, a few observations can be made as follows.
The Sheep/Goat samples at the site can be divided into two broad groups, apart from the bones with woven/fea- tureless tissue types. Barring these, the two main types are as follows; the first, represented by samples such as KTE 2s02 consist of elliptical osteons, compressed and banded together in a way that is seen at Inamgaon from Layer 4 onwards. The second type is extremely unusual, and not seen at Inamgaon at all. This type, as represented by sam- ples 2s08, 2s09(Fig. 3i), and 2s13 consist of haversian tis- sue with small, circular osteons, arranged in bands that are further separated by concentric Lines of Arrested Growth.
This feature is not seen in any other sample group, and seems to be unique to Kaothe.
Walki, Layer 2: Several histological features can be reported from the samples examined from the habitation layer at Walki. Samples at Walki, like the early layers at Inamgaon, have small, circular osteons such as in sample 2s05. However, plexiform bands at Walki are narrower and more regular, as seen in sample WLK 2s06(Fig. 3j), Much like the later layers at Inamgaon. Although most of the Wal- ki specimens suffer from poor preservation and lack of ob- servable features, one specimen(WLK 2s13, Fig. 3k) is no- table in that it exhibits multiple Lines of Arrested Growth.
Modern Samples: The modern Goat samples collected from Slaughterhouses and butchers within Pune city are generally all comprised of Plexiform bone, which shows wide, regular bands. Only a few specimens such as MS-9, MS-14, and MS-16 show a few stray osteons, while sam- ples such as MS-10 consist primarily of featureless woven bone. Only MS-13 showed regular Haversian tissue, with small, circular osteons comparable to Walki or Pre-Transi- tion Inamgaon.
DISCUSSION
Beginning with the morphometric changes, a few conclu- sions may be outlined from the trends seen in the samples.
Firstly, with regard to sheep/goat, the primary focus of this study, we see that there is a definite decrease in the shaft diameter of both the femur and humerus in the Sheep/Goat samples over the period of transition at Inamgaon. While this may be a byproduct of selective culling or other age related-bias, most of the samples that were selected from Inamgaon had the epiphyses of the bones partly or com- pletely fused, with unfused samples few and far between.
Therefore, if we assume that the individuals selected had at least reached a certain level of maturity(within the age bracket suggested by Thomas[11], we can attribute this trend to an overall reduction of size in the late Jorwe pe- riod at Inamgaon. As previously pointed out by Meadow [39], size reduction is a common byproduct of intensive exploitation over successive generations, especially when the animal is one whose milk is consumed by the human domesticators. The loss of the mothers’ milk causes size reduction in the offspring. In addition to this, size reduction has also been noted as an effect of heat stress on animals.
This has been confirmed through experimental observations by Sejian et al.[40], who subjected Malpura ewes to high levels of temperature with a fixed diet and under otherwise controlled conditions, and reported that the growth of the animals was noticeably inhibited compared to animals growing in normal conditions. Similar observations were made by Hahn[41] on cattle where increased temperature and aridity caused size reduction in young cattle. Given that we know there was a significant increase in aridity at the end of the Jorwe period, it is possible that this size re- duction was a result of that extreme climate.
The other parameter that was investigated through mor- phometry was the thickness of the cortex in the various bone samples. Cortical thickness is the result of the interac- tion between growth rate and bone loss in the living animal.
Even though bone is rigid tissue, it is by no means a static element throughout the animal’s life. An animal’s skeletal system is in fact in a state of constant flux, as older bone tissue is broken down and remodeled in response to both age as well as external stimuli. The studies by Chamberlain and Forbes[27], Vajda et al.[31] and Horwitz and Smith [32] have shown that environmental stress goes a long way in negatively affecting bone growth. This, combined with
processes such as milking[32] will cause cumulative bone loss, therefore resulting in a general thinning of the bone cortex.
This thinning is noticed not only in the overall values of Sheep and goat during the transition to and the extent of the Late Jorwe occupation at Inamgaon, but it was also noticed that the lowest values of cortical thickness are seen towards Layer 4, i.e the transitional point where sheep/goat are adopted as the main domesticate at the site, over the pre- viously preferred cattle/buffalo. The process of intensively exploiting an animal that was hitherto an alternative means of sustenance, and the meteoric increase that has been seen in the population of sheep/goat at the site during this phase, generally points towards rapid breeding and culling in large numbers of the animals during this period, probably accom- panied by the exploitation of secondary products like milk.
Comparisons with both Kaothe and Walki show the bone thickness at Inamgaon to be lower, but this is especially true for post-transition Inamgaon, i.e. Layer 4 to Layer 2.
When compared with Walki, we see that while the cortical thickness of the Post Transition Inamgaon bones is lower, the values of Pre-Transition Inamgaon, namely layers 5 and 6, are more or less the same.
In other words, we can assume that the environmental stress factors arising out of temperature and aridity, and resultant factors such as a relative shortage of both water and fodder resources, combined with the sudden growth in population and factors such as transportation and confine- ment, no doubt generated a significant amount of stress on the bones of the animals at Inamgaon, and as pointed out by studies such as Nomura and Takano-Yamamoto[42], this stress would have found expression in the form of me- chanical modifications of the bone cortex. Therefore as we examine the shifting trends in cortical thickness locus-wise, we can actually see shifting patterns of load and physical strain, caused by adaptations in body weight, gait, and so on, form the end of the Jorwe phase to that of the Late Jor- we, when the site is completely abandoned in favour of a fully pastoral mode of life.
This is reflected in the thickening of one side or locus of the bone at the expense of another. At Inamgaon, at the be- ginning of Layer 6, the thickest bone cortex on average is the lateral, followed by the medial, dorsal and ventral. Over time, through the Late Jorwe period until the abandonment of the site, this trend gives way to the bone being thickest at the Ventral side.
Similar trends are noticed in the Humerus but not in the radius. It is worth noting that the Femur and humerus both occupy the same position in the hindlimb and forelimb re- spectively, and therefore will have similar biomechanical properties.
According to Zedda et al.[9], the ventral part of the femur is affected chiefly by compressive stress, which is caused by load-bearing or weight. Generally, however, there is not much evidence for sheep being used as beasts of burden, other than being occasionally used to carry firewood by the Dhangar community in present-day Ma- harashtra(S. Ozarkar, pers.comm.) It is possible, however, that this change in load patterns on the bone, and the stress resulting thereof, is caused by rapid fattening of the animal, beyond its ‘healthy’ parameters, which has been seen to promote bone thickening[43]. However, we must keep in mind that average cortex thickness over this time period has in fact decreased, due to the factors mentioned above, and the changes seen between different loci of the bone are relatively very minimal. However, the fact that the pattern of change is same in both the load-bearing bones in the body is significant. As mentioned, bone thickness in this case was not considered in absolute terms, but mapped against the value of the shaft diameter. In the modern spec- imens, the samples fall into two groups of larger bones with thin cortex and smaller specimens with thick cortex.
Given the demographic patterns of the animals brought to the slaughterhouses to be culled, we can conclude that the larger specimens are females at or nearing the end of their reproductive viability, while the smaller, thicker bones come from young males raised primarily for meat. Now while similar practices have been reported from archaeo- logical contexts[44], such a distinction is not as clear in the samples from Inamgaon, Kaothe, and Walki. In general, the archaeological bones have thinner cortices than the modern bones. Apart from the element of bone loss through lacta- tion, we can conclude that this thinning is again due to en- vironmental and nutritional loss, and thus is aggravated by the end of the Late Jorwe phase where the thickness values for the bones drop noticeably. The modern bones, in gener- al, come from animals that are kept enclosed in controlled environments and fed regularly, as is the practice with stall- fed goat farming, and therefore we can expect stress signa- tures in these animals to be on the lower side.
Therefore, we can see that over the period of transition from the end of the Jorwe to that of the Late Jorwe, there is
notable evidence of both bone remodelling, and stress-re- lated bone modification at Inamgaon. Further light on these trends may be shed by the histological features observed.
Firstly, the general trends of appearance of various his- tological features may be looked at. In the selected sample body, the number of specimens in each layer was tallied to give some idea of the frequency of osteons and haversian systems versus plexiform bands. These values are given in Table 2 for Sheep/Goat. On the whole, it is seen that Osteons are the more common histological feature, this is significant when dealing with animals such as Sheep/goat and Cattle/Buffalo, since it is generally considered that plexiform bands are the ‘default’ configuration for bone tissue in these animals[30,34], The appearance of higher numbers of osteons is significant, as osteons are again associated with compressive stress[22,26]. However, the role of plexiform bands alone should not be discounted as studies have shown that the narrowing and tightening of plexiform bands also reflects physical stress on the bone, albeit tensile and resulting from locomotion[26]. At In- amgaon, we see that plexiform bands are the most frequent in Layer 4, which as mentioned before also exhibits the lowest cortical thicknesses on average at the site. Since this layer represents the exact point of transition, we may con- sider the reasons behind the excessive tensile/locomotory stress in the bones from this layer; one possibility is that in general, due to the climatic and environmental changes, the inhabitants at the site had to travel further with their herds to procure feed and water for the animals; the other expla- nation could be that during this time, with the overall drop in cattle/buffalo populations at the site, the demand for live- stock at a large regional center like Inamgaon led to the ac- quisition of animals from surrounding satellite settlements
and farmsteads. Such a wide-scale migration may have led to the stress patterns seen in the bones in Layer 4 and onwards at Inamgaon, especially when aggravated by harsh climatic and environmental conditions, which in modern livestock have been seen to cause fatigue and strain in the skeletal systems[40]. It is interesting to note that plexiform bone is all but absent from both Kaothe and Walki, with only a single sample seen at the latter site. It is important to note that tensile and compressive stress are not mutually exclusive, but are interrelated to a great degree. Changes in bodyweight and the pattern of distribution of the same will undoubtedly cause changes in gait, therefore affecting the level of tensile strain on the bones. Conversely, movement over long distances, especially in resource-deficient or adverse environmental conditions, will affect body weight and shape. Therefore, these two forms of stress are interre- lated, and affect the body as a collective stimulus, only to different degrees in different cases.
As mentioned above the individual changes in locus-wise osteon size and distribution were also noted. It is seen that overall, through the course of the Late Jorwe period from layer 6 to layer 2, There is an increase in osteon size, and a corresponding decrease in frequency.
Additionally, where the cortical thickness shifted in fa- vour of the ventral side of the bone, here both osteon size and density shift in favour of their maximum values being towards the Lateral side. The uniformity of this change again suggests some kind of external factor or stress, espe- cially given the increase in osteon size, which is associated with the formation of secondary tissue and bone modelling to repair damage, which could in this case be caused by bone fatigue and strain as seen in Carter et al.[45].
Where in pre-transition Inamgaon, and Kaothe, the high- est osteon size and density were seen in the medial side, at Walki, maximum osteon diameter is seen chiefly in the ventral. However, osteon frequence in all 3 contexts was highest in the medial before transitioning to the lateral in the Late Jorwe(Post-Transition) at Inamgaon.
Compared to Osteons, the statistical trends for plexiform bone are remarkably uniform, with only a slight decrease in the overall trend line for band width and frequencies between layer 6 and layer 2 of Inamgaon. The same can be seen while comparing material from Kaothe with Inamga- on, and Walki with both pre- and post-transition Inamga- on. However, this is not due to constant uniformity in the values, but rather a sharp drop in layer 4 in plexiform band Table 2. Distribution of Histological features among sample body,
Sheep/Goat
Samples w/
Osteons Samples w/
Plexiform Samples w/
Woven bone
INM 2 18 14 0
INM 3 12 9 4
INM 4 16 22 3
INM 5 7 4 23
INM 6 16 10 2
KTE2 8 0 11
WLK2 7 1 6
MS 3 13 4
width that is compensated by the subsequent layers 2 and 3. The same happens in case of band frequency, even when compared with the modern samples. In general, the modern samples show higher width and lower frequency than the archaeological samples. However, simply the quantitative aspect of histology is not in itself sufficient to identify and outline various stress factors in the bones, and it is for this reason that we look at qualitative aspects such as shape and patterns.
As mentioned above, there are certain qualitative aspects that show definite trends over the period under study at Inamgaon. To begin with, osteons seen in Layer 6 are gen- erally small and circular. It is only in Layer 4 that the first elliptical osteons are seen, accompanied by phenomena such as cement line cracks, which again point to mechani- cal stress acting on the bones.
Additionally, a recurring feature in Layer 6 is the partial covering of the bone cortex with a certain kind of histologi- cal feature. This usually consists of either plexiform or wo- ven bone being encroached upon by haversian systems, or in one case woven bone transitioning into narrow plexiform bands. In other words, this shows a kind of ‘partial’ or dif- ferential stress effect where only one part of the cortex- ei- ther the endosteum or periosteum is affected, and this mode seems to be the norm in Layer 6. In later layers, completely transformed cortical tissue becomes the norm, whether with Haversian or plexiform features. Layer 5 is an extremely remarkable context simple because of the complete pre- dominance of woven bone, with only 11 samples showing haversian or plexiform features out of a total of 34.
From Layer 4 onwards, we see the appearance of several distinct stress factors, starting with changes in osteon size and shape, with larger, more elliptical osteons becoming increasingly commonplace from Layer 4 onwards. Addi- tionally, the haversian systems begin to show numerous volkmann’s canals, with multiple canals branching off from a single osteon. Finally, as mentioned previously, one of the most unique features in layer 4 is the presence of extremely thin bone cortices in a number of samples accompanied by thin, narrow crowded plexiform bands. Going by the correlation between narrowing plexiform bands and loco- motion stress[26], we can conclude that at least a significant number of the animals seen in this layer had experienced significant locomotion-related bone fatigue. It is also worth noting that this feature gradually disappears in the subse- quent layers, which stands against the explanation that this
was due to the herds moving in greater distances to graze or for water; instead, the exclusivity of this phenomenon to Layer 4 seems to confirm that it was the result of a one-time, large scale migration. This is also reflected in the explosion of the sheep/goat population at the site in this same layer.
We have already discussed the role of osteon size, ellip- tical shape, and cracking in the preceding section on His- tological parameters, as per previous work carried out in the field by Zedda et al.[9], Mohsin et al.[46], and others, and how these signatures correspond to increasing stress in Haversian systems. As far as Volkmann’s canals are con- cerned, studies as early as Jaffe[46] have pointed out their correlation with osteoporosis and bone fatigue, and how the branching out of these structures into multiple neigh- bouring osteons is an adaptive mechanism to better convey minerals and nutrients from one osteon to the other in case of a general lack of nutrition. In the subsequent layers 3 and 2, we see a continuation of these aforementioned features such as elliptical osteons and branching Volkmann’s canals, especially in Layer 3. One new feature that appears from this layer onwards is what Skedros[22] describes as osteon
‘hooping’, where multiple osteons crowd together in con- centric circular structures through the cortex. This kind of banding or hooping is again an adaptive mechanism related to load or weight-bearing, accentuating the presence of this kind of stress in the samples.
It is notable that this hooping banding of compressed rows of osteons is also seen in a few samples at Kaothe, which as mentioned before represents a primary context of domestication. If we again assume the correlation of initial domestication with environmental stress due to con- trolled feeding, confinement, and controlled reproductive behaviour, it is notable that a context as early as Kaothe shares some matching histological features with the transi- tional and post-transitional phase at Inamgaon.
Mention must also be made of Lines of Arrested Growth (LAGs), which have been linked to pathological interrup- tion of growth as well as resource deficiency[19]. While not frequent at Inamgaon, some LAGs do appear, initially in layer 6 and then after Layer 4 onwards. Their compara- tive rarity is interesting in the given context, especially giv- en the presence of so many other stress factors. An interest- ing feature that was seen only in the samples from Kaothe shows bands of osteons arranged parallel to the cortex tissue, sandwiched between successive Lines of Arrested Growth. This feature does not appear in any other contexts,
archaeological or modern, and seems to be a unique reac- tion(only appearing in 2 individuals) to some stimulus at Kaothe.
With regard to Walki, on the whole the histological features seen in the habitation layer correspond well to Pre-transition Inamgaon, which makes sense as the two assemblages both date to the Jorwe period(Though Walki is chronologically set before Inamgaon layers 6 and 5). The modern samples in fact compare favourably to both Walki and pre-transition Inamgaon, other than the near-complete absence of haversian systems in these bones. In general, there are no notable stress markers in the modern bones, probably due to the controlled conditions they are raised in.
Therefore, we can definitely say that Layer 4 marks a dis- tinct break in the pattern of exploitation of sheep/goat at In- amgaon, and the transition brings with it numerous agents of stress that affect the animals.
Unlike Sheep/Goat, the stress responses seen in Inamga- on cattle are somewhat unremarkable in the given period.
In terms of cortical thickness the changes are very minor from layer 6 to Layer 2, while the absence of complete cortical rings in most of the sample prevented the analysis of shaft diameter or locus-wise changes in cortex thickness.
Additionally, the cortex thickness change is only seen in fe- murs at the site, while humeri and radii remain unchanged in general. Compared to Kaothe and Walki, the cattle seen at both sites seem to be larger and more robust compared to Inamgaon overall, with somewhat higher bone cortex thickness.
In terms of microscopy, there are only very slight in- creases in both osteon size and density in the cattle sam- ples at Inamgaon over the transitional period. The relative frequencies of osteons vs. plexiform and woven bone are given in Table 3 for all the contexts that were analysed. In
general, the number of samples with diagnostic features from both Kaothe and Walki were too low to make any sta- tistical or quantitative comparison with Inamgaon.
The one major difference seen in the cattle samples at Inamgaon is the high number of samples with haversian features that is seen in Layer 5, as opposed to the predom- inance of woven samples in case of Sheep/Goat. Also ab- sent are the thin, tightly banded plexiform structures seen in Sheep/Goat during this layer, as the plexiform bands in cattle remain wide and open throughout the period stud- ied at Inamgaon. However, there are some features in the cattle/Buffalo samples worth noting. As with Sheep/Goat, Cattle/Buffalo bones from Layer 6 show partial coverage of the cortex between two different bone types, either woven and plexiform, or haversian and plexiform. Additionally, elliptical osteons appear earlier in Cattle than they do in Sheep/Goat, first making an appearance in the samples in Layer 5. The partial or transitional cortices are absent in this layer onwards. There are certain histological features of interest that appear in the Cattle/Buffalo bones, such as the appearance of alternate bands of loose and tightly packed plexiform bands in one sample in layer 5, or the wavy, regular plexiform bands seen in Layer 4. However, these phenomena are confined to individuals and may have pathological connotations. Other features, such as the nest- ling of osteons within woven bone, are more common but still confined to a few individuals in Layer 4. Generally, the haversian systems in cattle/buffalo samples at Inamgaon are either in clusters or as wholly stray osteons. More com- mon features that appear after Layer 3 are slight banding and hooping behaviour in the osteons, but again to a far lesser degree than what is seen in the Sheep/Goat samples.
By the end of the occupational period, the only common histological features are high density of elliptical osteons in haversian samples and a slight narrowing of the bands in plexiform samples, though again nowhere near the extent seen in sheep and goat. Only one Line of arrested growth is seen in a sample from Layer 3.
Therefore, it would appear that the intensive exploitation that happened in the Late Jorwe period was by and large confined to sheep/goat, as is suggested by the demographic patterns(Table 1). While there are undoubtedly some stress signatures in the cattle samples, they are generally confined to a small number of individuals and only increase in fre- quency at the end of the occupational period at Layer 2.
The drastic changes in bone histology seen post Layer 4 in Table 3. Distribution of Histological features among sample body,
Cattle/Buffalo
Samples w/
Osteons Samples w/
Plexiform Samples w/
Woven bone
INM 2 9 3 6
INM 3 6 7 1
INM 4 8 11 5
INM 5 14 6 6
INM 6 10 10 0
KTE2 9 0 11
WLK2 6 1 13