Despite its subjective nature, patient satisfaction has become an important issue in health care quality, not only at the institutional level, but at the state level, as well. Individual institutions regularly monitor their pa- tient satisfaction and develop strategies for quality im- provement to achieve a better position in the market.
Nurses, as major hospital personnel, play a role in meet- ing their patients’ needs and expectations, and, as a re-
sult, nursing care is acknowledged as a key determinant of patient satisfaction.
Patient Satisfaction at the State Level
While the significance of patient satisfaction at the in- stitutional level never diminishes, recently, governments and policy analysts have used patient satisfaction as an approach to evaluate the performance of the national
Trends in Patient Satisfaction from 1989- 2003: Adjusted for Patient Characteristics
Sung-Hyun Cho, RN, PhD, Chang-yup Kim, MD, MPH, PhD
Purpose. To identify trends in patient satisfaction adjusted for sociodemographic factors and health status from 1989-2003.
Methods. Five repeated cross-sectional surveys were used. The study sample included 290,534 household mem- bers 20 years of age and over from the five survey periods of 1989, 1992, 1995, 1999, and 2003.
Satisfaction was measured using a five-point scale, ranging from “very satisfied” to “very dissatisfied.”
Crude satisfaction rates, representing the proportion of patients satisfied (very satisfied or satisfied), were calculated for each survey period. Satisfaction rates adjusted for age, sex, marital status, education, and self- rated health status were calculated for each of the five years.
Results. Crude satisfaction rates increased from 15.4% in 1989 to 40.5% in 2003. The proportions of satisfac- tion and dissatisfaction were reversed after 15 years had passed. However, the satisfaction trend was not linear throughout the different years, with 1992 being the year with the lowest satisfaction rate (9.7%).
These trends in crude rates did not change even after adjusting for patient characteristics. The odds of satis- faction in 1992 were 38% lower (odds ratio 0.62, 95% CI 0.60 to 0.64) than the odds in 1989. In 2003, the odds of satisfaction were 4.01 times (95% CI 3.89 to 4.13) the odds for 1989. Older, female, married, and less-educated people were more likely to be satisfied. Patients who rated their health as “very good” had the highest satisfaction rate, and those with “neutral” health ratings had the lowest. General hospitals achieved substantial improvement whereas pharmacies became the lowest-rated of all institutions.
Conclusions. The Korean health system has achieved better patient satisfaction rates over the past 15 years.
Increased health expenditure, resources, and quality improvement efforts may have contributed to this progress.
Key Words : patient satisfaction, quality, trend
1. Assistant Professor, Department of Nursing, Hanyang University, Seoul, Korea 2. Associate Professor, School of Public Health, Seoul National University, Seoul, Korea This work was supported by the Korea Research Foundation Grant (KRF-2004-041-E00370).
Corresponding author: Sung-Hyun Cho, RN, PhD, Department of Nursing, Hanyang University 17 Haengdang-dong, Seongdong-gu, Seoul 133-791, Korea
Tel: 82-2-2220-0798 Fax: 82-2-2295-2074 Email: [email protected] Received November 13, 2006 ; Accepted December 27, 2006
health system. For example, the World Health Report 2000 evaluated responsiveness as a performance mea- sure of how the system was meeting the population’s ex- pectations (World Health Organization, 2000). The US government developed the Consumer Assessment of Health Plans Study program that conducts nation-wide patient satisfaction surveys and compares the results across facilities and over time (Goldstein, Cleary, Langwell, Zaslavsky, & Heller, 2001). Australian state governments (e.g., Victoria and Queensland) also contin- uously evaluate patient satisfaction with public hospitals (State Government of Victoria, 2004; Queensland Health, 2006). This usage of patient satisfaction at the state level may imply that the examination of nation- wide trends in patient satisfaction can provide empirical evidence of how satisfactory and responsive the national health system has been, according to its citizens’ expec- tations.
As in other countries, the Korean health system has implemented various policy changes to provide better quality and accessible health care since the 1980s. In 1989, the National Health Insurance (NHI) expanded to include coverage for all Korean people, which resulted in a rapid growth of health care demand. Under the univer- sal coverage, health care institutions and the workforce, particularly in the private sector, have increased dramati- cally and created a more competitive market (Organisation for Economic Co-operation and Development (OECD), 2003). The government has also been pressured to implement quality evaluation pro- grams to meet citizens’ expectations for higher-quality care (Kim & Cho, 2000). Those health reforms and a competitive market have led the government and health care facilities to pay more attention to patient satisfac- tion and policies for improving satisfaction. Therefore, examining trends in patient satisfaction may enable health and nursing policymakers to assess the impact of the policy changes that have transpired over the past decade on patient satisfaction. Also, the trends among Korean people can be compared with other countries, based on previous studies that involved transnational comparisons (Blendon et al., 2002; Blendon, Leitman, Morrison, & Donelan, 1990; Donelan, Blendon, Schoen, Davis, & Binns, 1999).
A methodological issue in evaluating patient satisfac- tion is the adjustment for patient characteristics, such as indicators of other outcomes (Perneger, 2004). Previous studies have reported that patient satisfaction is influ-
enced by sociodemographic factors (e.g. age, sex, marital status, education, and income) and health status (Cohen, 1996; Hargraves et al., 2001; Kim, Zaslavsky, & Cleary, 2005; Rahmqvist, 2001). Adjustments for patient char- acteristics help minimize the influence of these factors and make patient satisfaction less biased. These adjust- ments are required when examining satisfaction trends in order to ascertain true changes in satisfaction and, al- so, to account for the diverse backgrounds of patients, in terms of sociodemographic characteristics and health status, over time.
Purpose
This study examined trends in patient satisfaction rates, adjusted for sociodemographic factors and health status from 1989-2003 among Korean citizens, using na- tionally representative public data. This investigation was expected to provide an approach to evaluating how the performance of the Korean health system has improved.
Furthermore, this study was intended to determine if the collective efforts of the government and the health care institutions were effective in improving patient satisfac- tion.
METHODS
Data source
This study was designed to use five repeated, cross-sec- tional surveys with different samples. We used data from the Social Statistics Survey, conducted by the Korean National Statistical Office. The purpose of the survey was to assess the quality of life and any social changes going on in the nation and also to produce data for de- veloping social policies in 12 different areas (e.g., health, income and consumption, labor, and education) (Korea National Statistical Office, 2004). The reconstruction of the survey system was done in 1998, and, every year since then, the survey has been composed of questions regarding three of the 12 areas, as well as the sociode- mographic factors of respondents. Surveys on the area of health have been performed ten times since the first sur- vey was conducted in 1979. This study used the data from the five most recent surveys, taken in 1989, 1992, 1995, 1999, and 2003; only these raw data are available for individual researchers. The Social Statistics Survey determines sampling units via stratified sampling, based on population census and enumeration districts, and col- lects these data from households in selected units.
Measures
Satisfaction was measured by asking a single question,
“How much are you satisfied with overall health ser- vices?” Respondents answered with a five-point scale, ranging from “very satisfied” to “very dissatisfied,” and also with a choice of “do not know.” We included all household members, age 20 years and over, who an- swered questions about patient satisfaction. With the
“do not know” response being excluded, 290,534 indi- viduals from the five survey periods were included in this analysis. The satisfaction level was further grouped into three categories: satisfied (very satisfied or satisfied), neutral, and dissatisfied (dissatisfied or very dissatisfied).
Independent variables used for adjustment were age,
sex, marital status, education, and health status. Health status described a self-rated health status that ranged from “very good” to “very poor.” Another independent variable was the type of health care institution that pa- tients had visited most frequently during the previous year. This variable was only included in the surveys tak- en in 1995, 1999, and 2003. According to the Medical Law, the term “general hospitals” refers to hospitals that have a minimum of 100 inpatient beds and that provide physician specialist services in several major areas (e.g., internal medicine, surgery, pediatrics). Hospitals and clinics were included in a single group due to inconsis- tency in the categorization of institutions across the years. Oriental medical facilities were defined as clinics
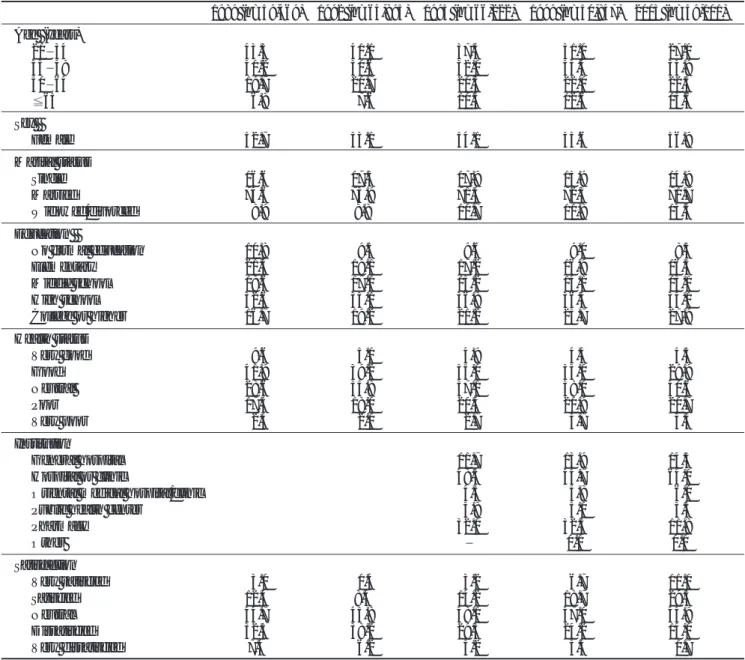
Table 1. Distribution of Patients by Characteristics and Survey Periods (unit = %)
1989 (n=59,469) 1992 (n=64,895) 1995 (n=66,222) 1999 (n=50,847) 2003 (n=49,101) Age (years)
20 34 43.3 41.1 37.4 31.0 27.0
35 49 30.2 30.6 32.0 34.4 34.9
50 64 19.7 20.7 20.3 22.0 22.5
65 06.8 07.6 10.3 12.6 15.6
Sex
Female 52.7 53.1 54.1 55.6 56.9
Marital status
Single 16.6 17.3 17.9 15.9 14.9
Married 74.6 73.9 71.4 72.3 71.7
Widowed/divorced 08.9 8.8 10.7 11.8 13.5
Education
No formal education 10.8 09.5 09.6 09.0 08.5
Elementary 21.3 19.1 17.2 16.9 16.5
Middle school 18.6 17.1 15.2 14.1 13.1
High school 32.6 35.1 36.8 36.4 34.1
College or higher 16.7 19.2 21.2 23.7 27.9
Health status
Very good 09.6 05.0 04.9 04.4 04.5
Good 41.9 39.2 35.0 33.0 29.9
Neutral 28.6 35.8 37.1 38.0 40.6
Poor 17.5 18.0 20.4 20.9 20.7
Very poor 02.4 02.0 02.7 03.7 04.3
Institution
General hospital 11.7 13.9 14.5
Hospital or clinic 48.3 43.7 64.1
Oriental medical hospital/clinic 04.3 04.8 06.0
Public health center 03.8 05.0 03.5
Pharmacy 32.0 32.5 11.8
Other 0.1 0.1
Satisfaction
Very satisfied 03.0 01.4 03.2 06.7 11.0
Satisfied 12.4 8.4 14.2 18.7 29.5
Neutral 44.7 45.8 48.1 47.0 43.9
Dissatisfied 32.5 38.2 29.3 24.2 14.0
Very dissatisfied 7.4 06.2 05.2 03.4 01.7
and hospitals that provide medical services based on Korean traditional medicine.
Data analysis
A descriptive analysis was conducted to examine the distribution of patients for each period, according to so- ciodemographic factors and health status. Crude satisfac- tion rates, representing the proportion of patients satis- fied (very satisfied or satisfied), were calculated for each survey period. Multivariate logistic regression analyses were then employed to examine the relationships be- tween satisfaction and patient characteristics. This was accomplished by contrasting satisfied versus not satisfied (neutral or dissatisfied) patients for each period. Trends in adjusted satisfaction were measured as odds ratios (ORs) of each year, as compared with the baseline year, 1989.
RESULTS
The distribution of 290,534 patients by sociodemo- graphic characteristics and health status is shown in Table 1. The proportion of older patients, aged 65 years
or over, has more than doubled over the past 15 years.
The majority of patients, however, were under the age of 50. The proportion of patients who had been widowed or divorced has also slightly increased. Patients with a college education demonstrated a steady increase in numbers, whereas the number of those with a middle school education or less decreased. Self-rated health sta- tus did not improve over time. The number of patients who perceived their health as “very good” or “good”
decreased from 52% to 34%. The proportion of “neu- tral” responses also increased by 12% over the last 15 years. A significant change regarding the type of institu- tions used by patients was the decreased proportion of pharmacy use and an increase in hospital or clinic use in 2003. This change reflects the effect of a reform imple- mented in 2000 that separated the physician’s role of prescribing and the pharmacist’s role of dispensing drugs: this will be further addressed in the Discussion section.
Overall satisfaction rates dramatically increased from 15.4% in 1989 to 40.5% in 2003, with great improve- ment between the years of 1999 and 2003 (Table 1).
Interestingly, the proportions of satisfaction and dissatis-
Table 2. Satisfaction Rates by Patient Characteristics and Survey Periods (unit = %)
1989 1992 1995 1999 2003
Age (years)
20-34 14.1 08.6 15.5 21.2 32.7
35-49 15.6 09.2 14.8 21.9 36.1
50-64 17.4 11.3 20.4 28.6 44.4
65 17.5 14.1 26.0 39.8 58.1
Sex
Male 15.5 09.7 16.3 23.0 37.5
Female 15.3 09.8 18.3 27.3 42.8
Marital status
Single 14.2 08.3 15.7 19.8 31.4
Married 15.6 09.7 16.9 25.1 40.4
Widowed/divorced 16.0 13.1 23.6 35.0 51.2
Education
No formal education 16.1 14.1 26.2 41.3 59.6
Elementary 17.0 11.2 21.0 31.7 52.2
Middle school 15.2 09.2 14.5 22.2 40.6
High school 14.5 08.5 14.8 21.6 35.1
College or higher 15.1 08.9 17.0 22.6 34.4
Institution
General hospital 15.7 25.2 42.6
Hospital or clinic 16.1 26.7 40.9
Oriental medical hospital/clinic 27.4 36.2 48.7
Public health center 33.0 46.6 61.5
Pharmacy 16.8 18.9 25.0
Other 44.8 45.5
faction ratings were reversed after 15 years had passed.
However, this satisfaction trend was not linear through- out the periods, but rather resembled a J-shape. The lowest satisfaction rate was observed in 1992, with a rate of 9.7 % and without a notable change in the number of
“neutral” patients.
Table 2 presents the satisfaction rates, according to pa- tient characteristics and survey periods. In univariate comparisons, older, female, widowed or divorced, or less educated patients appeared to be more satisfied.
Regarding health status, patients who reported a “neu- tral” status consistently had the lowest satisfaction rates throughout the years. “very good” health status patients had the highest satisfaction rates in 1989, 1992, and 1995, but those who rated their status as “very poor”
demonstrated the most satisfaction in 1999 and 2003.
Satisfaction rates also differed by institutions. Patients who used public health centers and Oriental medical fa- cilities showed a higher satisfaction rate than hospital or clinic users. However, satisfaction rates have increased over time for all types of institutions. General hospitals attained a great improvement overall, but pharmacies had a relatively small improvement compared with the
other institutions.
The relationships between patient characteristics and satisfaction for each period of time were further exam- ined, using a logistic regression analysis. Odds ratios (ORs) from the analysis are shown in Table 3. Older pa- tients were more likely to be satisfied throughout the time periods than were patients between 20 and 34 years of age. Female patients had a significantly greater satisfaction than men, with the exception of the 1992 re- port (p = 0.73). Married patients were also more satis- fied than single patients in 1992, 1999, and 2003. The tendency that those who were widowed or divorced would have higher satisfaction rates in a univariate com- parison disappeared after controlling for other factors.
The associations of education and satisfaction were not linear, but, instead, formed a U-shape. Patients with ele- mentary-level or no formal education had a significantly greater satisfaction rate than those with a college educa- tion, except for the 1989 report. Middle or high school attendants had a lower satisfaction than did college at- tendants in 1995 and 1999. With regard to health status, those with a “neutral” rating had the lowest satisfaction (ORs, 0.70 0.82) during the four periods. Patients who
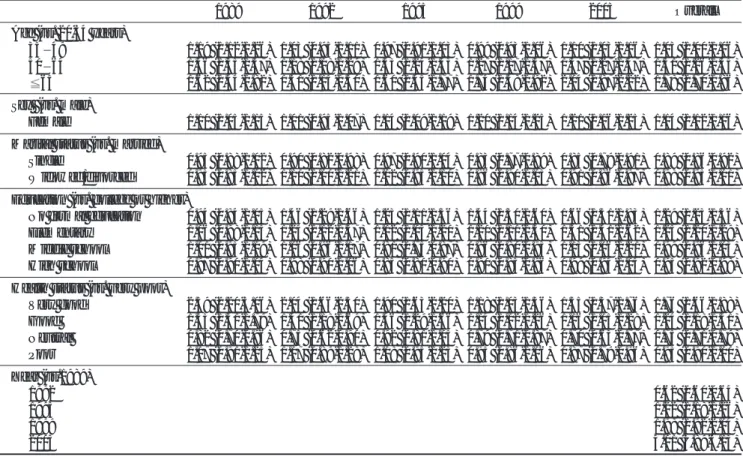
Table 3. Odds Ratios (95% CI) of Satisfaction for Patient Characteristics and Survey Periods
1989 1992 1995 1999 2003 Overall
Age (vs. 20-34 years)
35 49 1.19 (1.12-1.26) 1.03 (0.95-1.11) 0.97 (0.91-1.03) 0.99 (0.93-1.06) 1.10 (1.03-1.16) 1.03 (1.00-1.06) 50 64 1.46 (1.35-1.57) 1.18 (1.08-1.29) 1.33 (1.24-1.43) 1.27 (1.17-1.37) 1.37 (1.27-1.47) 1.31 (1.26-1.35) 65 1.62 (1.44-1.82) 1.31 (1.15-1.50) 1.60 (1.45-1.77) 1.74 (1.58-1.92) 2.04 (1.87-2.22) 1.78 (1.70-1.86) Sex (vs. male)
Female 1.10 (1.05-1.15) 1.01 (0.95-1.07) 1.14 (1.09-1.19) 1.20 (1.14-1.25) 1.21 (1.16-1.25) 1.14 (1.12-1.16) Marital status (vs. married)
Single 0.95 (0.88-1.02) 0.90 (0.82-0.98) 0.97 (0.90-1.04) 0.83 (0.77-0.89) 0.85 (0.79-0.91) 0.89 (0.86-0.92) Widowed/divorced 0.93 (0.85-1.02) 1.10 (1.00-1.21) 1.02 (0.95-1.10) 0.96 (0.90-1.03) 0.91 (0.86-0.97) 0.98 (0.95-1.01) Education (vs. college or higher)
No formal education 0.94 (0.84-1.05) 1.46 (1.29-1.66) 1.23 (1.11-1.36) 1.44 (1.30-1.60) 1.66 (1.51-1.83) 1.29 (1.23-1.36) Elementary 1.06 (0.98-1.15) 1.24 (1.12-1.37) 1.12 (1.03-1.20) 1.20 (1.11-1.30) 1.51 (1.41-1.62) 1.25 (1.20-1.29) Middle school 1.01 (0.93-1.09) 1.06 (0.96-1.17) 0.81 (0.75-0.87) 0.86 (0.80-0.93) 1.13 (1.06-1.21) 0.99 (0.96-1.03) High school 0.97 (0.90-1.04) 0.98 (0.90-1.06) 0.85 (0.80-0.90) 0.90 (0.85-0.96) 0.99 (0.94-1.04) 0.95 (0.92-0.98) Health status (vs. very poor)
Very good 2.59 (2.20-3.06) 2.04 (1.66-2.50) 1.90 (1.63-2.20) 1.18 (1.03-1.36) 1.55 (1.37-1.76) 1.76 (1.66-1.88) Good 1.53 (1.31-1.79) 1.41 (1.18-1.69) 1.46 (1.29-1.66) 1.14 (1.02-1.26) 1.16 (1.05-1.28) 1.24 (1.18-1.31) Neutral 0.82 (0.70-0.96) 0.75 (0.62-0.90) 0.92 (0.81-1.05) 0.79 (0.71-0.87) 0.70 (0.63-0.77) 0.75 (0.71-0.79) Poor 1.07 (0.91-1.25) 1.07 (0.89-1.28) 1.08 (0.95-1.23) 0.95 (0.86-1.06) 0.87 (0.79-0.96) 0.95 (0.90-1.00) Year (vs.1989)
1992 0.62 (0.60-0.64)
1995 1.22 (1.18-1.26)
1999 1.98 (1.92-2.04)
2003 4.01 (3.89-4.13)
rated their health status as “very good” and “good” con- sistently showed a greater satisfaction level than patients with “very poor” health.
After being adjusted for sociodemographic factors and health status, the satisfaction trend was examined by placing all cases of the five time periods into the regres- sion model (see the last column of Table 3). The odds ra- tios of satisfaction for each year showed a trend similar to the crude satisfaction rates. The lowest OR was seen in 1993 (0.62), which means that the odds of satisfaction in 1992 were 38% lower than the odds in 1989. In 2003, the odds of satisfaction were four times the odds for 1989. If interpreting the OR (4.01) in terms of proba- bility, the probability of satisfaction in 2003 was 22.7%
higher, on average, than in 1989, when using the 20.6%
overall satisfaction rate of all five periods [0.227 = log (4.01) * 0.206 * (1 0.206)] (Allison, 1999). This differ- ence of 22.7% is slightly smaller than the 25.1% (i.e.
the difference between 15.4% in 1989 and 40.5% in 2003) observed in the crude rates.
Table 4 shows the relationship between satisfaction and the types of institutions. Because 1995 did not in- clude “other” institutions, those cases (n = 113) were excluded from the analysis. The regression analysis was modeled by including the five patient factors and the types of institutions altogether, but the ORs for patient factors were not presented in the Table due to limited space. Patients who visited oriental medical facilities and public health centers constantly had a higher satisfaction level than did those who used a general hospital.
However, the ORs of those two types decreased over time, suggesting that the differences in satisfaction be- tween these institutions and general hospitals became
smaller. Hospitals and clinics appeared to have a greater satisfaction rate than general hospitals, but this tendency had disappeared by 2003. Satisfaction with pharmacies was higher than with general hospitals in 1995, but their relationship reversed in 1999.
DISCUSSION
The major finding of this study was a remarkable in- crease in the satisfaction rates from 15.4% in 1989, to 40.5% in 2003. This trend in crude rates did not change even after adjusting for the patients’ sociodemographic factors and health status. This improved satisfaction rate agrees with a finding from another Social Statistics Survey in 2002, in which 30% of respondents reported that the health care services they received had gotten better when compared with those of the previous five years. (47% reported no change, and 17% said that their health care services had gotten worse) (Korea National Statistical Office, 2003). Although a direct transnational comparison should be cautiously per- formed, the upward trend in satisfaction is notable when compared with trends in other countries. A comparative survey, conducted in five nations from 1988-2001, re- ported that the proportion of citizens who answered that their health care system worked well and required only minor changes had decreased in Australia (from 34 to 25%), Canada (from 56 to 21%), and the UK (27 to 21%); in the US, the proportion slightly increased from 10 to 18% (Blendon et al., 2002).
An unexpected finding was a decline in satisfaction rates between 1989 and 1992. In 1989, the achievement of the universal coverage resulted in a 38% increase in Table 5. Changes in Health Expenditure and Resources from 1989 2003
1989 1992 1995 1999 2003
Health expenditure per capita (US$ purchasing power parity) 328 439 538 729 1074
No. of practicing physicians per 1,000 people 0.8 1.0 1.1 1.3 1.6
No. of practicing nurses per 1,000 people 0.8 1.0 1.1 1.4 1.7
No. of inpatient beds per 1,000 people 3.0 3.5 4.4 5.6 7.1
Table 4. Odds Ratios (95% CI) of Patient Satisfaction for Health Care Institutions
1995 1999 2003
Institution (vs. general hospital)
Hospital or clinic 1.02 (0.95-1.09) 1.08 (1.01-1.14) 0.99 (0.94-1.05)
Oriental medical hospital/clinic 1.95 (1.76-2.16) 1.65 (1.49-1.82) 1.40 (1.28-1.53)
Public health center 2.12 (1.90-2.35) 1.98 (1.79-2.18) 1.56 (1.39-1.74)
Pharmacy 1.10 (1.03-1.19) 0.75 (0.70-0.80) 0.53 (0.49-0.57)
the number of NHI beneficiaries, from 29 million to 40 million (Ministry of Health and Social Affairs, 1990). In terms of the timeline, the 1989 survey was conducted during May 22 - June 3 (National Bureau of Statistics, 1989), and the NHI for all citizens was then implement- ed on July 1, 1989. Therefore, the satisfaction rate of 1989 was not influenced by the universal coverage, but 1992 was most likely the first period that reflected the impact of the NHI change. A plausible explanation of the lowest satisfaction rate in 1992 would be that de- mands for health care services had rapidly increased due to the universal coverage, yet health care resources and providers were not able to meet the increasing demands and expectations.
The improvement in satisfaction rates may be ex- plained by several contributing factors; these factors in- clude increases in health expenditures, better availability of resources (workforce and facilities), and quality im- provement efforts. However, some policy analysts may argue that more input does not necessarily lead to better satisfaction. As seen in Table 5, the total health expendi- ture per capita increased more than three times during the 15 years encompassed by our study (OECD, 2005).
The number of practicing physicians, nurses, and inpa- tient beds per 1,000 people also more than doubled (OECD, 2005). These increased inputs have contributed not only to better access to care but also to a greater competition among institutions. In the more competitive market, individual institutions have had to improve the quality of their care and amenities in order to satisfy their patients (Kim & Cho, 2000).Government policies also have led health care providers to implement quality improvement activities. One influential policy is the Hospital Evaluation Program, whose demonstration pro- jects have been conducted since 1995, and which be- came mandatory by the Medical Law in 2002 (Ministry of Health and Welfare, 2004). In 2004, the first hospital evaluation was performed for 78 tertiary or large hospi- tals with 500 or more beds. Patient satisfaction reflected patient rights and conveniences, and an on-site satisfac- tion survey was also conducted for both inpatients and outpatients in the Hospital Evaluation Program.
However, the increased satisfaction rate achieved over the past 15 years still leaves room for continuous im- provement. The 40% satisfaction rate in 2003 is not high enough to celebrate when compared with the higher sat- isfaction rates that leading countries had already reached in 1998-2000 (Denmark: 91%, UK: 57%, Canada:
46%, and US: 40%) (Blendon, Kim, & Benson, 2001).
To attain a higher satisfaction in the future, the Korean health care system first needs to solve problems that cause dissatisfaction with medical care. According to the 2003 Social Statistics Survey, the main reasons for dissat- isfaction were high medical fees (32%), unsatisfactory results of treatment (22%), long waiting times for treat- ment and hospitalization (18%), and unkindness (14%) (Korea National Statistical Office, 2004). These findings tell us that the NHI policies to reduce out-of-pocket pay- ments are the key to guaranteeing better patient satisfac- tion in the future. At the institutional level, quality im- provement efforts of health care providers will be neces- sary to improve their clinical performance, the redesign- ing of care processes, and to improve patient-provider relationships.
As reported in previous studies (Cohen, 1996;
Hargraves et al., 2001; Kim et al., 2005; Rahmqvist, 2001), the present study found significant relationships between patient characteristics and satisfaction. In the multivariate analysis, older, female, married, and less ed- ucated people were more likely to be satisfied. Self-rated health status, however, showed a non-linear relationship with patient satisfaction. Patients perceiving their health to be very good had the greatest satisfaction, while those with “neutral” health ratings had the lowest rates of sat- isfaction. We did not find any clues from the study to in- terpret this trend, but it is suspected that a central ten- dency exists for patients to choose an answer in the mid- dle of a scale, and they, consequently, fail to accurately rate their health status. This central tendency can occur in two directions, either moving from “(very) good” to
“neutral” or from “(very) poor” to “neutral.” We thought the latter was more plausible, based on the as- sumption that patients would choose “neutral” to avoid a negative evaluation, even though in reality they per- ceive their health to be poor. If central tendency does play a role in this phenomenon, a modification of the scale needs to be considered in future surveys.
The last highlight of this study was the satisfaction trend according to the type of institution used. General hospitals had the lowest satisfaction rate (15.7%) in 1995 but attained a great improvement over the nine years. Another notable change was a declined pharmacy use from 32% in 1999 to 12% in 2003. This change re- flects a reform implemented in 2000 that separated the physician’s role into prescribing and the pharmacist’s role into dispensing drugs. Before the reform, patients
could get even specialty drugs without a physician’s pre- scription. The separation reform had the impact of shift- ing patients from pharmacies to hospitals and clinics.
The satisfaction of pharmacy users had only a small im- provement, and pharmacy satisfaction became the low- est among all institutions in 2003. The lowest satisfac- tion, however, is difficult to attribute to a reform effect, because satisfaction with pharmacies was already the lowest amongst all institutions in 1999. Special attention is required to assess the main causes of dissatisfaction with pharmacy use in the future.
Some limitations occurred due to the characteristics of the data analyzed in this study. The survey data taken from different samples may threaten the inferences made from the satisfaction trends. Another limitation was that there was no distinction between inpatient and outpatient care, which might have produced different satisfaction trends. Inconsistency in the response cate- gories of the same survey questions between evaluation periods has led to the regrouping of responses. This col- lapse of categories might hide the unique features of the original categories and could consequently change the relationships among variables in the analysis.
References
Allison, P. D. (1999). Logistic regression: using the SAS system.
Cary, NC: SAS Institute.
Blendon, R. J., Kim, M., & Benson, J. M. (2001). The public versus the World Health Organization on health system performance.
Health Aff, 20, 10-20.
Blendon, R. J., Leitman, R., Morrison, I., & Donelan, K. (1990).
Satisfaction with health systems in ten nations. Health Aff, 9, 185-192.
Blendon, R. J., Schoen, C., DesRoches, C. M., Osborn, R., Scoles, K.
L., & Zapert, K. (2002). Inequalities in health care: A five- country survey. Health Aff, 21, 182-191.
Cohen, G. (1996). Age and health status in a patient satisfaction survey. Soc Sci Med, 42, 1085-1093.
Donelan, K., Blendon, R. J., Schoen, C., Davis, K., & Binns, K.
(1999). The cost of health system change: public discontent in five nations. Health Aff, 18, 206-216.
Goldstein, E., Cleary, P. D., Langwell, K. M., Zaslavsky, A. M., &
Heller, A. (2001). Medicare managed care CAHPS: A tool for performance improvement. Health Care Financ Rev, 22, 101- 107.
Hargraves, J. L., Wilson, I. B., Zaslavsky, A., James, C., Walker, J.
D., Rogers, G., & Cleary, P. D. (2001). Adjusting for patient characteristics when analyzing reports from patients about hos- pital care. Med Care, 39, 635-641.
Kim, C. Y., & Cho, S. H. (2000). Institutionalization of quality im- provement programs in Korean hospitals. Int J Qual Health Care, 12, 419-423.
Kim, M., Zaslavsky, A. M., & Cleary, P. D. (2005). Adjusting Pediatric Consumer Assessment of Health Plans Study (CAH- PS) scores to ensure fair comparison of health plan perfor- mances. Med Care, 43, 44-52.
Korea National Statistical Office (2003). Report on the Social Statistics Survey 2002. Daejeon, Korea: Author.
Korea National Statistical Office (2004). Report on the Social Statistics Survey 2003. Daejeon, Korea: Author.
Ministry of Health and Social Affairs (1990). Yearbook of Health and Social Statistics 1990. Seoul: Author.
Ministry of Health and Welfare (2004). Guidelines for Hospital Evaluation Program. Gwacheon, Korea: Author.
National Bureau of Statistics (1989). Social Indicators in Korea 1989. Seoul: Author.
Organisation for Economic Co-operation and Development (2003).
OECD Reviews of Health Care Systems: Korea. Paris: Author.
Organisation for Economic Co-operation and Development (2005).
OECD Health Data 2005 (CD-ROM). Paris: Author.
Perneger, T. V. (2004). Adjustment for patient characteristics in sat- isfaction surveys. Int J Qual Health Care, 16, 433-435.
Queensland Health (2006). Queensland health state-wide patient satisfction survey. Retrieved June 1, 2006, from The State of Queensland Web site: http://www.health.qld.gov.au/quality/
measuredquality.asp.
Rahmqvist, M. (2001). Patient satisfaction in relation to age, health status and other background factors: a model for comparisons of care units. Int J Qual Health Care, 13, 385-390.
State Government of Victoria (2004). Victorian patient satisfaction monitor. Retrieved June 1, 2006, from the Victorian State Government Department of Human Services Web site:
http://www.health.vic.gov.au/patsat/.
World Health Organization (2000). The world health report 2000 - health systems: improving performance. Geneva: Author.