Introduction
Gait ability is an important ability needed by stroke survivors to perform daily activities; therefore, gait recovery is a main goal in stroke rehabilitation.
To measure improvements after gait-related inter- ventions for stroke populations, gait kinematics is most commonly used (McGinley et al, 2003). After a stroke, gait velocity and cadence decrease, whereas double-limb support time increases, and the paretic limb has a shorter stance phase and a longer swing phase, which alters temporal symmetry (Schmid et al, 2007).
To measure kinematic gait parameters, compu- terized gait analysis allows quantitative, objective
gait assessment for stroke and is considered the gold standard (McDonough et al, 2001). But this method is not commonly used in clinic; its application is complex and needs time to complete test, and clini- cians are often not familiar with its results and ter- minology (McDonough et al, 2001). Generally, ob- servational gait analysis is the most common ap- proach to provide an estimation of gait kinematics in the clinic (Coutts, 1999; Toro et al, 2003). This ap- proach is based on a visual observation of joint dis- placement and spatiotemporal components.
The gait part of the Tinetti Performance-Oriented Mobility Assessment (POMA-G) is a widely used clinical measure that provides a kinematic aspect of abnormality in gait by observation (Kegelmeyer et al, Corresponding author: Jeong-soo Kim [email protected]
Spatiotemporal Gait Parameters That Predict the Tinetti Performance-Oriented Mobility Assessment in
People With Stroke
Yeon-gyu Jeong1, PhD, PT, Jeong-soo Kim2, PhD, PT
1Dept. of Physical Therapy, Dongguk University Ilsan Hospital
2Dept. of Physical Therapy, Seoul Rehabilitation Hospital
Abstract
1)The purpose of this study was to find which spatiotemporal gait parameters gained from stroke patients could be predictive factors for the gait part of Tinetti Performance-Oriented Mobility Assessment (POMA-G). Two hundred forty-six stroke patients were recruited for this study. They participated in two assessments, the POMA-G and computerized spatiotemporal gait analysis. To analyze the relationship between the POMA-G and spatiotemporal parameters, we used Pearson’s correlation coefficients. In addition, multiple linear regression analyses (stepwise method) were used to predict the spatiotemporal gait parameters that correlated most with the POMA-G. The results show that the gait velocity (r=.67, p<.01), cadence (r=.66, p<.01), step length of the affected side (r=.49, p<.01), step length of the non-affected side (r=.53, p<.01), swing percentage of the non-affected side (r=.47, p<.01), and single support percentage of the affected side (r=.53, p<.01) as well as the double support percentage of the non-affected side (r=-.42, p<.01) and the step-length asymmetry (r=-.64, p<.01) correlated with POMA-G.
The gait velocity, step-length asymmetry, cadence, and single support percentage of the affected side explained 67%, 2%, 2%, and 1% of the variance in the POMA-G, respectively. In conclusion, gait velocity would be the most predictive factor for the POMA-G.
Key Words: Gait parameters; Regression analysis; Stroke; Tinetti performance-oriented mobility assessment.
2007). The POMA-G assesses spatiotemporal gait parameters such as step length, symmetry, initiation, continuity, path, base of support, and postural sway during gait (Tinetti, 1986). The accuracy of clinical observation measures is important in clinical practice to understand the true changes in spatiotemporal gait parameters. It could also be helpful to clinicians and physical therapists in decision-making processes.
However, it is unclear whether the POMA-G is suf- ficiently accurate to detect change in spatiotemporal gait parameters during rehabilitation after stroke.
Therefore, the aim of our study was to compare the POMA-G score with spatiotemporal gait parameters measured objectively by computerized gait analysis to determine which spatiotemporal parameters have an impact on POMA-G.
Methods
Subjects
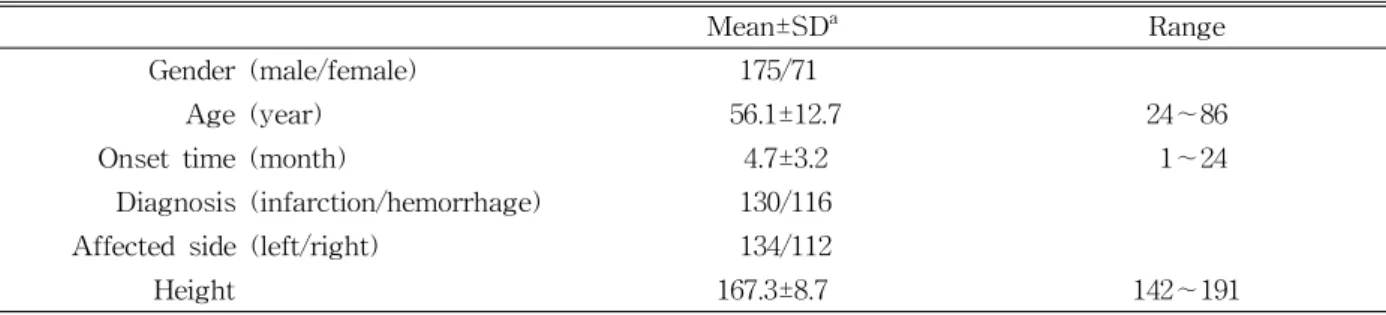
Medical records of 246 patients who had been hospitalized in a rehabilitation hospital in Seoul, Korea for inpatient rehabilitation after stroke (175 males and 71 females) were retrospectively analyzed for this study. The mean age±standard deviation was 56.1±12.7 years (range from 24 to 86 years).
Inclusion criteria were: (1) hemiparesis secondary to unilateral ischemic or hemorrhagic stroke; (2) post-stroke duration between 1 and 12 months; (3) those who had the ability to walk at least 10 m, if necessary, with or without an assistive device; and
(4) the ability to comprehend simple instructions for testing (5) those with an Mini-Mental State Examination score of ≥24. Exclusion criteria were:
(1) neurologic comorbidity other than stroke; (2) a cardiovascular, musculoskeletal, or other medical con- dition that could influence gait; (3) a cerebellar or vestibular lesion, which might influence balance; and (4) two or more attacks of stroke. At study entry, we first collected demographic information on each subject, including gender, age, time since stroke on- set, type of stroke, and side of lesion (Table 1). The study was approved by the Seoul rehabilitation hos- pital Institutional Review Board, and all subjects agreed to participate in the study and provided writ- ten informed consent (approval number: SRH2013R-09).
Procedure
Two hundred forty-six medical records of post-stroke patients who had been hospitalized from January 2012 to December 2014 were reviewed for this study. In the rehabilitation hospital, a series of POMA-G and computerized spatiotemporal gait as- sessments using the GAITRite system were routinely administered at admission. After the evaluation, most of the patients went through a 12-week stroke re- habilitation intervention. All assessments were ad- ministered by licensed clinicians who had been trained on these assessments.
Outcome measurements
The Tinetti Performance-Oriented Mobility Assessment (POMA) was originally developed for
Mean±SDa Range
Gender (male/female) 175/71
Age (year) 56.1±12.7 24∼86
Onset time (month) 4.7±3.2 1∼24
Diagnosis (infarction/hemorrhage) 130/116
Affected side (left/right) 134/112
Height 167.3±8.7 142∼191
amean±standard deviation.
Table 1. General characteristics of subjects (N=246)
use in the older adult population and contains both a balance and a gait component (Tinetti, 1986). The gait component evaluates initiation, step length, floor clearance, symmetry, continuity, path, postural sway, and base of support during gait (Tinetti, 1986). It measures on a 3-point ordinal scale, ranging from 0 to 2, where the highest score indicates independence with each test item. The reliability and validity of the POMA-G for measuring gait in stroke patients has been established. The POMA-G exhibits good intra-reliability in the stroke population with ICC(2,1)=.829 (.724∼.897), with a minimal detectable change of 3 points (Daly et al, 2006; Faber et al, 2006). The POMA-G is soundly correlated with the gait velocity (r=.610) and functional independence measure (r=.673) (Canbek et al, 2013).
The spatiotemporal data
Gait was measured using an electronic walkway, GAITRite (CIR Systems Inc., Havertown, PA, USA).
The GAITRite system translates spatial and temporal parameters via an electronic walkway connected to the serial port of a personal computer. This system generally provides excellent test-retest reliability in both young and older people (Menz et al, 2004), and there is excellent concurrent validity between the GAITRite and 3D motion capture system in both healthy and stroke subjects (Stokic et al, 2009). We collected the following variables from the GAITRite system: velocity (㎝/s), cadence, step time (sec), step length (㎝), swing and stance time percentage (SwP and StP), single-limb support time percentage (SSP), and double-limb support time percentage (DSP), for both limbs. The temporal and spatial asymmetries were also calculated using the formulas below (Lin et al, 2006), wherein the greater the ratio was, the greater the degree of asymmetry.
Single-limb support time asymmetry ratio (SS-Asy):
Step-length asymmetry ratio (SL-Asy):
Statistical analysis
Data analysis was performed using the SPSS ver.
18.0 (SPSS Inc., Chicago, IL, USA). Descriptive sta- tistics were used to characterize the participants’
demographics and clinical findings. Data normality was tested with the Kolmogorov-Smirnov test (p>.05). Spearman correlation coefficients were cal- culated for continuous variables to examine the rela- tionship between the POMA-G and each spatio- temporal parameter. Variables determined as sig- nificant by univariate analyses were entered into multiple stepwise regression analyses to identify pre- dictors associated with POMA-G. These predictors were then tested for multicollinearity to prevent over-parameterization of the prediction model. The level of significance used was p<.05.
Results
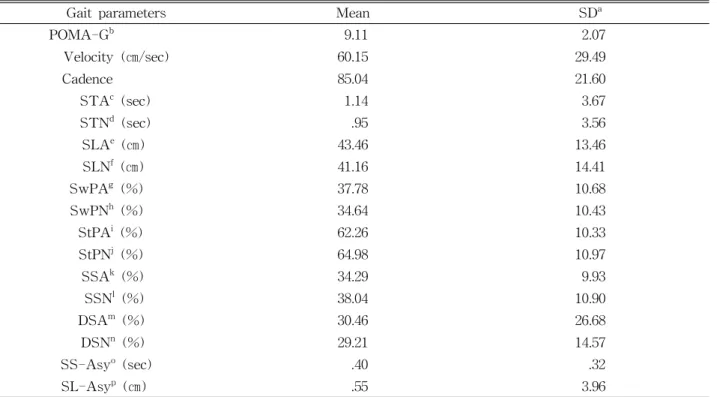
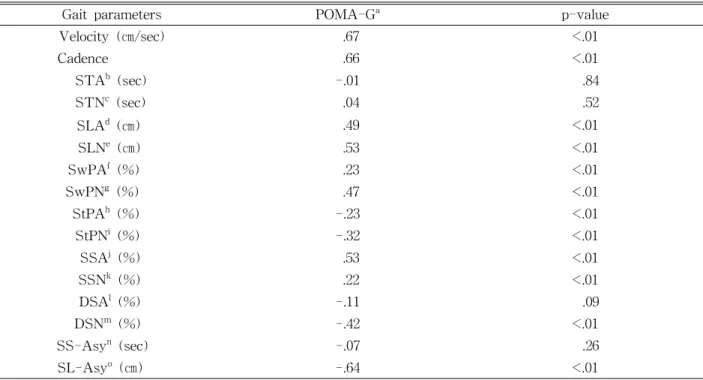
Table 2 summarizes the POMA-G and each of the spatiotemporal parameters, presented as mean±stand- ard deviation. As shown in Table 3, the POMA-G was positively associated with gait velocity (r=.67, p<.01), cadence (r=.66, p<.01), step length of the af- fected side (r=.49, p<.01), step length of the non-af- fected side (r=.53, p<.01), SwP of the affected side (r=.23, p<.01), SwP of the non-affected side (r=.47, p<.01), and SSP of the affected side (r=.53, p<.01), while it was negatively associated with the StP of the affected side (r=-.23, p<.01), StP of the non-af- fected side (r=-.32, p<.01), DSP of the non-affected side (-.42, p<.01), and SL-Asy (r=-.64, p<.01). There were no significant correlations between the POMA-G and the SSP of the non affected side, DSP of the affected side, the step time of either limb, the DSP of the affected side, or the SS-Asy (p>.05) (Table 3).
The results of the multiple stepwise regressions, including each parameter of the four stages, are shown in Table 4. The gait velocity (p<.001), SL-Asy (p<.001), cadence (p=.001), and SSP of the affected side (p<.05) explained 67%, 2%, 2%, and 1%
of the variance in the POMA-G, respectively, for a total of 72%. The following equations could be used to predict the POMA-G: POMA-G=5.78+.016 (velocity)-1.386 (SS-Asy)+.023 (cadence)+.028 (SSP of the affected side).
Discussion
This is the first study to evaluate the relationship between the POMA-G and spatiotemporal gait pa- rameters in particularly large samples with hemi- plegic stroke. Our study showed that the POMA-G
was associated with most of the spatiotemporal gait parameters including high correlations of gait veloc- ity, cadence and SL-Asy and moderate correlations of step length of the affected side, step length of the non-affected side, SwP of the non-affected side, SSP of the affected side, and DSP of the non-affected side. Among these parameters, in order, the gait ve- locity, SL-Asy, cadence, and SSP of the affected side were predictor factors for POMA-G.
The GAITRite system provides an extremely de- tailed quantitative description of gait patterns, but it did not allow a comprehensive assessment of gait, such as the motion of the trunk and the lower extremity. In contrast, the POMA-G is relatively subjective and difficult for clinicians to accurately judge gait assessment in observation. But it allows a possible overall assessment without any equipment, and it is easy to use.
Gait parameters Mean SDa
POMA-Gb 9.11 2.07
Velocity (㎝/sec) 60.15 29.49
Cadence 85.04 21.60
STAc (sec) 1.14 3.67
STNd (sec) .95 3.56
SLAe (㎝) 43.46 13.46
SLNf (㎝) 41.16 14.41
SwPAg (%) 37.78 10.68
SwPNh (%) 34.64 10.43
StPAi (%) 62.26 10.33
StPNj (%) 64.98 10.97
SSAk (%) 34.29 9.93
SSNl (%) 38.04 10.90
DSAm (%) 30.46 26.68
DSNn (%) 29.21 14.57
SS-Asyo (sec) .40 .32
SL-Asyp (㎝) .55 3.96
astandard deviation, bgait component of Tinetti performance-oriented mobility assessment, cstep time affected side,
dstep time non-affected side, estep length affected side, fstep length non-affected side, gswing percentage affected side, hstance percentage non-affected side, istance affected side, jstance non-affected side, ksingle-limb support affected side, lsingle-limb support non-affected side, mdouble-limb support affected side, ndouble-limb support non-affected side, osingle-limb support time asymmetry, pstep-length asymmetry.
Table 2. Results (mean and standard deviation) of the POMA-G and spatiotemporal gait parameters
Gait parameters POMA-Ga p-value
Velocity (㎝/sec) .67 <.01
Cadence .66 <.01
STAb (sec) -.01 .84
STNc (sec) .04 .52
SLAd (㎝) .49 <.01
SLNe (㎝) .53 <.01
SwPAf (%) .23 <.01
SwPNg (%) .47 <.01
StPAh (%) -.23 <.01
StPNi (%) -.32 <.01
SSAj (%) .53 <.01
SSNk (%) .22 <.01
DSAl (%) -.11 .09
DSNm (%) -.42 <.01
SS-Asyn (sec) -.07 .26
SL-Asyo (㎝) -.64 <.01
agait component of tinetti performance-oriented mobility assessment, bstep time affected side, cstep time non-affected side, dstep length affected side, estep length non-affected side, fswing percentage affected side, gstance percentage non-affected side, hstance affected side, istance non-affected side, jsingle-limb support affected side, ksingle-limb support non-affected side, ldouble-limb support affected side,mdouble-limb support non-affected side, nsingle-limb support time asymmetry, ostep-length asymmetry.
Table 3. Spearman correlations between the POMA-G and each spatiotemporal gait parameters
Independent Variables R2 Adjusted R2 Ba (S.E.b) βc p-value
Model 1 .67 .25
Velocity (㎝/sec) .047 (.003) .67 <.001*
Model 2 .69 .48
Velocity (㎝/sec) .032 (.005) .45 <.001*
SL-Asyd (sec) -1.841 (.473) -.28 <.001*
Model 3 .71 .51
Velocity (㎝/sec) .017 (.007) .24 .010*
SL-Asy (sec) -1.619 (.468) -.25 <.001*
Cadence .027 (.008) .28 .001*
Model 4 .72 .52
Velocity (㎝/sec) .016 (.007) .22 .010*
SL-Asy (sec) -1.386 (.474) -.21 <.001*
Cadence .023 (.008) .24 <.001*
SSAe (%) .028 (.012) .13 .020*
aunstandardized regression coefficient, bstandard error, cstandardized regression coefficient, dstep-length asymmetry,
esingle-limb support affected side, *significance at the p<.01 level (two-tailed).
Table 4. Multiple linear regression analyses (stepwise method) relating POMA-G with the other variables
Gait velocity has commonly been used as a meas- urement of gait performance and as a discriminator of levels of disability in the stroke population (Dickstein, 2008). Gait velocity is known to be de- termined by combinations of cadence and step length (Schmid et al, 2007). In our study, the most pre- dictive factor for the POMA-G was gait velocity, which explained approximately 67% of variance in the POMA-G. Our findings provide evidence of a strong relationship between the observational meas- ures of the POMA-G and gait velocity in a compu- terized gait analysis. This is likely because the POMA-G measures some spatiotemporal aspects of gait such as step length and cadence, which are re- lated to gait velocity (Roth et al, 1997). Similar to our findings, a moderate relationship between the POMA and gait velocity has also been found in per- sons with Parkinson’s disease (Kegelmeyer et al, 2007). The present study is the first to confirm these results in a hemiparetic population.
Spatiotemporal asymmetry has been considered one of the major problems to gait impairment in hemi- plegic patients with stroke (Dewar and Judge, 1980;
Patterson et al, 2008; Rinaldi and Monaco, 2013).
Patients with stroke generally exhibit an asymmetry of step, which leads to an inefficiency of gait, a loss of balance control, risks of musculoskeletal injury to the nonparetic lower extremities, and abnormal func- tional aspects of gait (Patterson et al, 2008). The moderate correlation between the SL-Asy and the POMA-G was explained by the fact that the POMA-G score was calculated with step length and symmetry based on spatial asymmetry. However, the POMA-G could not assess the temporal symmetry, even though temporal asymmetry is also an im- portant predictor of walking performance in hemi- plegic patients with stroke (Patterson et al, 2008).
Cadence is known to be one of the determinant of gait velocity (Schmid et al, 2007) and the sub-items of the POMA-G were actually calculated on ob- servation of cadence, which is partly explained in our study. Even though the SL-Asy and cadence
were the predictive factors for the POMA-G, those only explain the POMA-G to a small extent (1∼2%).
The present study has some limitations. Because the POMA-G was assessed by various licensed clinicians, the objectivity and sensitivity of this test may also have been affected. Second, we did not consider functional ambulatory outcomes such as in- dependent ambulation on level ground, stairs, slopes, or uneven surfaces; nor did we consider social ambulation. Additional detailed study will be needed of the relationship between the POMA-G and com- puterized gait parameters by divided functional am- bulation levels.
Conclusion
The purpose of this study was to investigate which spatiotemporal gait parameters collected during hemiplegic walking could be predictors for the POMA-G. The results of our study demonstrate that velocity, cadence, and the SL-Asy are correlated with POMA-G performance and that velocity is the most predictive factor for the POMA-G. Therefore, the findings of our study suggest that there is a strong relationship between observational measure of gait and gait velocity measured by computerized gait analysis, but it is necessary to develop more effec- tive and easy to use evaluation tools which better reflect more detailed gait parameters than the POMA-G with hemiplegia.
References
Canbek J, Fulk G, Nof L, et al. Test-retest reliability and construct validity of the tinetti perform- ance-oriented mobility assessment in people with stroke. J Neuro Phys Ther. 2013;37(1):14-19.
http://dx.doi.org/10.1097/NPT.0b013e318283ffcc Coutts F. Gait analysis in the therapeutic
environment. Man Ther. 1999;4(1):2-10.
Daly JJ, Roenigk K, Holcomb J, et al. A randomized controlled trial of functional neuromuscular stim- ulation in chronic stroke subjects. Stroke. 2006;
37(1):172-178.
Dewar ME, Judge G. Temporal asymmetry as a gait quality indicator. Med Biol Eng Comput. 1980;18 (5):689-693.
Dickstein R. Rehabilitation of gait speed after stroke:
A critical review of intervention approaches.
Neurorehabil Neural Repair. 2008;22(6):649-660.
http://dx.doi.org/10.1177/1545968308315997
Faber MJ, Bosscher RJ, van Wieringen PC.
Clinimetric properties of the performance -oriented mobility assessment. Phys Ther. 2006;
86(7):944-954.
Kegelmeyer DA, Kloos AD, Thomas KM, et al.
Reliability and validity of the tinetti mobility test for individuals with parkinson disease. Phys Ther. 2007;87(10):1369-1378.
Lin PY, Yang YR, Cheng SJ, et al. The relation be- tween ankle impairments and gait velocity and symmetry in people with stroke. Arch Phys Med Rehabil. 2006;87(4):562-568.
McDonough AL, Batavia M, Chen FC, et al. The validity and reliability of the gaitrite system’s measurements: A preliminary evaluation. Arch Phys Med Rehabil. 2001;82(3):419-425.
McGinley JL, Goldie PA, Greenwood KM, et al.
Accuracy and reliability of observational gait analysis data: Judgments of push-off in gait af- ter stroke. Phys Ther. 2003;83(2):146-160.
Menz HB, Latt MD, Tiedemann A, et al. Reliability of the gaitrite walkway system for the quantifica- tion of temporo-spatial parameters of gait in young
and older people. Gait Posture. 2004;20(1):20-25.
Patterson KK, Parafianowicz I, Danells CJ, et al. Gait asymmetry in community-ambulating stroke survivors. Arch Phys Med Rehabil. 2008;89(2):
304-310. http://dx.doi.org/10.1016/j.apmr.2007.08.142 Rinaldi LA, Monaco V. Spatio-temporal parameters
and intralimb coordination patterns describing hemiparetic locomotion at controlled speed. J Neuroeng Rehabil. 2013;10(1):53. http://dx.doi.org/
10.1186/1743-0003-10-53
Roth EJ, Merbitz C, Mroczek K, et al. Hemiplegic gait: Relationships between walking speed and other temporal parameters. Am J Phys Med Rehabil. 1997;76(2):128-133.
Schmid A, Duncan PW, Studenski S, et al.
Improvements in speed-based gait classifications are meaningful. Stroke. 2007;38(7):2096-2100.
Stokic DS, Horn TS, Ramshur JM, et al. Agreement between temporospatial gait parameters of an electronic walkway and a motion capture system in healthy and chronic stroke populations. Am J Phys Med Rehabil. 2009;88(6):437-444. http://dx.
doi.org/10.1097/PHM.0b013e3181a5b1ec
Tinetti ME. Performance-oriented assessment of mo- bility problems in elderly patients. J Am Geriatr Soc. 1986;34(2):119-126.
Toro B, Nester CJ, Farren PC. The status of gait assessment among physiotherapists in the united kingdom. Am J Phys Med Rehabil. 2003;84(12):
1878-1884.
This article was received September 11, 2015, was reviewed September 11, 2015, and was accepted October 15, 2015.