INTRODUCTION
Eosinophils play an important role in the development of asth- ma and allergic disease as an effector cell. The extent of eosino- philic inflammation is a determinant of the severity of asthma symptoms,1 and it usually correlates with airflow limitations.2 Relationships between eosinophilic infiltration and Th2 cyto- kines have been identified within the target tissues of allergic disorders.3 The processes of eosinophilic infiltration and periph- eral eosinophilia are dependent on eosinophil-specific cyto- kines and chemokines (e.g., IL-5; the eotaxin family; RANTES;
and MCP-2, -3, and -4), which provoke an eosinophilic response in the peripheral blood and airways via CCR3.4,5 CCR3 mRNA and protein levels are elevated in the bronchial mucosa of asth- matics, and this elevation is associated with airway hyperre- sponsiveness.6 The participation of CCR3 in airway eosinophil- ic infiltration has been demonstrated in a study of CCR3-defi- cient mice, which showed that most eosinophils are arrested in the subendothelial space.7 Eosinophils are derived from CD34(+) hematopoietic progenitor cells.8 Eotaxin-1 and -2 induce the migration of bone marrow and blood CD34(+) CCR3(+) cells in
Gene-Gene Interaction Between CCR3 and Eotaxin Genes:
The Relationship W ith Blood Eosinophilia in Asthma
June-Hyuk Lee, An-Soo Jang, Sung-Woo Park, Do-Jin Kim, Choon-Sik Park*
Genome Research Center for Allergy and Respiratory Diseases, Division of Respiratory and Allergy, Department of Internal Medicine, Soonchunhyang University Bucheon Hospital, Bucheon, Korea
vitro.9 Therefore, the CCR3-eotaxin pathway is important in the regulation of allergen-induced hematopoiesis and in the accu- mulation and mobilization of eosinophil lineage-committed progenitor cells in the lung.9 The human CCR3 gene (MIM
#601268) is located on chromosome 3p21.3.10 The single-nucle- otide polymorphisms (SNPs) CCR3-22557G>A and -174C>T are associated with the number of eosinophils in asthmatic pa- tients. It has previously been reported that CCR3 expression is higher on the eosinophils of asthmatic patients lacking a haplo- type composed of rare alleles of 4 CCR3 SNPs.11
Eotaxin-1 is important for eosinophilic inflammation in early stages of the asthmatic response, while eotaxin-3 may account for eosinophil recruitment to the airways in late stages of the asthmatic response.12 Three eotaxin family members, eotaxin-1, Allergy Asthma Immunol Res. 2014 January;6(1):55-60.
http://dx.doi.org/10.4168/aair.2014.6.1.55 pISSN 2092-7355 • eISSN 2092-7363
Purpose: Eosinophils function as an effector cell in the development of asthma and allergic disease. Eotaxins are cytokines that promote pulmo- nary eosinophilia via the receptor CCR3. Single-nucleotide polymorphisms (SNPs) in CCR3 and eotaxin genes are associated with asthma. In this study, genetic interactions among SNPs of several eotaxin genes and CCR3 were assessed and their relationship with blood eosinophilia in asthma was examined. Methods: A total of 533 asthmatics were enrolled in this study. Asthmatics with eosinophilia (>0.5×10⁹/L) were compared with those without eosinophilia (≤0.5×10⁹/L). Chi-square tests were used to compare SNP frequencies. Two different models were used to evaluate gene-gene interactions: logistic regression and generalized multifactor dimensionality reduction (GMDR). Results: EOT2+304C>A (29L>I) was significantly associated with 3 of the 4 CCR3 SNPs among asthmatics with eosinophilia (P=0.037-0.009). EOT2+304C>A (29L>I) and the CCR3 SNPs were also significantly associated with blood eosinophilia in an interaction model constructed by logistic regression (P=0.0087). GMDR analysis showed that the combination of EOT2+304C>A (29L>I) and CCR3-174C>T was the best model (accuracy=0.536, P=0.005, CVC 9/10). Conclu- sions: The epistatic influence of CCR3 on eotaxin gene variants indicates that these variants may be candidate markers for eosinophilia in asthma.
Key Words: Asthma; epistasis; polymorphisms; CCR3; eotaxin
This is an Open Access article distributed under the terms of the Creative Commons Attribution Non-Commercial License (http://creativecommons.org/licenses/by-nc/3.0/) which permits unrestricted non-commercial use, distribution, and reproduction in any medium, provided the original work is properly cited.
Correspondence to: Choon-Sik Park, MD, PhD, Division of Respiratory and Allergy, Department of Internal Medicine, Soonchunhyang University Bucheon Hospital, 170 Jomaru-ro, Wonmi-gu, Bucheon 420-767, Korea.
Tel: +82-32-621-5105; Fax: +82-32-621-5023; E-mail: [email protected] Received: February 19, 2013; Revised: April 10, 2013; Accepted: April 24, 2013
•There are no financial or other issues that might lead to conflict of interest.
-2, and -3, are selectively bound by CCR3. Eotaxin-1 and -2 show different pathophysiologic responses in relation to eosinophils.
Disruption of the eotaxin-1 gene leads to a slight reduction in the eosinophil count in the blood and airways.13 Eotaxin-2-de- ficient mice have normal baseline eosinophil levels in their tar- get tissues, and they do not develop airway eosinophilia in re- sponse to IL-13.14 Two eotaxin polymorphisms, EOT2+1272A>G and EOT1+123G>A, are associated with asthma and high serum total IgE levels, respectively.15
Because asthma is a multifactorial disease, the genetic com- ponent may be derived from the combined effect of numerous genes. Individual genes may act independently or in combina- tion with other genes in the same biological pathway, resulting in variable effects.16 The CCR3 gene and eotaxin gene family are possible contributors to the development of asthma or other al- lergic phenotypes via the receptor-ligand interaction.
In this study, we evaluated gene-gene interactions between CCR3 and eotaxin in relation to eosinophilia in patients with asthma.
MATERIALS AND METHODS Subjects
We enrolled 533 Korean asthmatics in our study. The Institu- tional Review Board of [Soonchunhyang University Bucheon Hospital] approved the study. All of the patients had current symptoms, including wheezing, dyspnea, and cough, and met the criteria for asthma as defined by the American Thoracic So- ciety.17 Each patient showed airway reversibility as document- ed by an inhalant bronchodilator-induced improvement in the forced expiratory volume in one second (FEV1) of >15%18 and/
or airway hyperresponsiveness as shown by a provocative con- centration of methacholine required to cause a 20% decrease in the FEV1 (PC20) of <8 mg/mL.18 The asthma subjects were di- vided into 2 groups according to the presence of eosinophilia.
Eosinophilia was defined as a blood eosinophil count exceed- ing 0.5×10⁹/L.19 No subject had used systemic or inhaled ste- roids for 4 weeks before peripheral blood eosinophil counting.
No subject had a history of medication or the ingestion of raw foods that could produce blood eosinophilia. ELISAs for 4 com- mon parasites (Paragonimus, Clonorchis, Cysticercus, and Spar- ganum) were negative in the enrolled patients. The clinical characteristics of the subjects are summarized in Table 1.
Genotyping by single-base extension and electrophoresis To genotype polymorphic sites, amplifying and extension primers were designed for single-base extension. All primer ex- tension reactions were performed using a SNaPshot ddNTP Primer Extension Kit (Applied Biosystems, Foster City, CA) ac- cording to the manufacturer’s instructions. Detailed methods are described in the online supplement.
Analysis of polymorphisms, Hardy-Weinberg equilibrium, and linkage disequilibrium
A total of 14 SNPs in eotaxin-1, -2, and -3 (6 SNPs in eotaxin-1, 5 in eotaxin-2, and 3 in eotaxin-3), and 4 SNPs in CCR3 were in- cluded in our analysis. Testing for Hardy-Weinberg equilibrium and the calculation of D’ for the identification of linkage disequi- librium were performed using PHASE v2.0.220 and Arelquin v2.0.21 Continuous variables, such as the blood eosinophil count and percentage, serum total IgE level, and PC20 methacholine level, were log-transformed to approximate normal distribu- tions. Differences in the log-transformed values among geno- types were examined using a generalized linear model type III SS. Statistical significance was defined at the standard 5% level.
Dependency of allele frequency and logistic regression interaction modeling
The dependency between each pair of CCR3 and eotaxin SNPs in asthmatics with and without eosinophilia was tested by Chi-square analysis.
An epistatic model was designed based on the logistic regres- sion model.22 “CCR3eff,” a new numerical variable as an effect of CCR3 SNPs on blood eosinophilia, was derived according to the extent of contribution to eosinophilia in asthma using logistic regression. Odds ratios (ORs) for eosinophilia for each geno- type at each locus were calculated in asthmatics with eosino- philia. Each genotype was coded according to the ORs as fol- lows: homozygote with the highest OR, 2; heterozygote, 1; and the other homozygote, 0.
In CCR3eff=α1 (-22557G>A)+α2 (-520T>G)+α3 (-174C>T)+α4
(+51T>C),
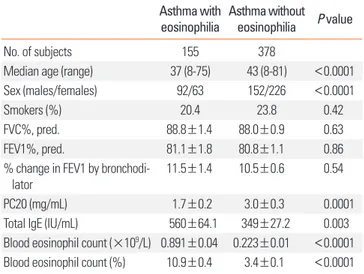
Table 1. Clinical characteristics of asthma subjects according to the presence of eosinophilia
Asthma with
eosinophilia Asthma without eosinophilia P value
No. of subjects 155 378
Median age (range) 37 (8-75) 43 (8-81) <0.0001
Sex (males/females) 92/63 152/226 <0.0001
Smokers (%) 20.4 23.8 0.42
FVC%, pred. 88.8±1.4 88.0±0.9 0.63
FEV1%, pred. 81.1±1.8 80.8±1.1 0.86
% change in FEV1 by bronchodi-
lator 11.5±1.4 10.5±0.6 0.54
PC20 (mg/mL) 1.7±0.2 3.0±0.3 0.0001
Total IgE (IU/mL) 560±64.1 349±27.2 0.003
Blood eosinophil count (×109/L) 0.891±0.04 0.223±0.01 <0.0001 Blood eosinophil count (%) 10.9±0.4 3.4±0.1 <0.0001 Eosinophilia was defined as a blood eosinophil count >0.5×10⁹/L. P values were calculated for comparisons between asthmatics with eosinophilia and without eosinophilia. Chi-square tests were used to compare categorical vari- ables; Student’s t-test was used to compare continuous variables. Mean±SEM.
α denotes the coefficient fitted by logistic regression (α1=0.3601, α2=0.3525, α3=0.4204, and α4=0.1867). Epistasis was subse- quently tested independently for each SNP in eotaxin by fitting the following logistic regression model:
P (Eosinophilia)=exp (X)/[1+exp (X)]
where X=β0+β1CCR3eff+β2SNPEotaxin+β3 (CCR3eff×SNPEotaxin), β0
is the intercept, β represents the parameter estimates, and SNP
Eotaxin is each eotaxin genotype (0, 1, or 2).
The Bonferroni correction for multiple comparisons was used for each eotaxin gene (the global significance level was adjusted to P<0.0083 for 6 eotaxin-1 SNPs, P<0.01 for 5 eotaxin-2 SNPs, and P<0.017 for 3 eotaxin-3 SNPs). Statistical significance was defined at the standard 5% level.
Generalized multifactor dimensionality reduction (GMDR) To validate the results of our logistic model, we performed GMDR analysis. First, the data were randomly split into 10 equal parts for cross-validation. Nine of these were used as a training set; the remaining set was used for independent testing. Cross- validation is a measure of the number of times a particular set of loci is identified in each possible 9/10 of the subjects. Second, a set of n genetic factors was selected. Third, all possible multi- factor classes or cells were represented in n-dimensional space and a cumulative score was calculated within each cell.23 Fourth, each multifactor cell in n-dimensional space was labeled as
“high-risk” if the average score met or exceeded the threshold (0) or as “low-risk” if the threshold was not exceeded. This pro- cess was repeated for each possible cross-validation interval.
Fifth, all potential combinations of n factors were evaluated se- quentially for their ability to classify cases and controls in the training data, and the best n-factor model that yielded the min-
imum misclassification error was chosen. Sixth, the indepen- dent testing set was used to estimate the prediction error of the best model selected in the fifth step. Finally, among this set of the best models, we pick the model with minimum prediction error and/or maximum cross-validation consistency.23,24 A co- variate analysis was performed as described above23 with age (continuous variable) and sex (discrete variable) as covariates.
RESULTS
The genotype distributions of the four SNPs in CCR3 and 14 SNPs in the eotaxin genes were in the Hardy-Weinberg equilib- rium (data not shown). No pair of SNPs showed strong linkage disequilibrium (>0.8) between the eotaxin gene SNPs and CCR3 SNPS (see Supplementary Table S2).
Epistasis was evaluated to access whether the eotaxin SNPs modified the effect of the CCR3 SNPs on blood eosinophilia susceptibility. We examined whether dependence existed be- tween the CCR3 SNPs and eotaxin gene SNPs before the epista- sis tests. EOT2+304C>A was dependent on 3 intronic SNPs (CCR3-22557G>A, CCR3-520T>G, and CCR3-174C>T) in CCR3 among asthmatics with eosinophilia by Chi-square analysis (Table 2).
The epistatic model constructed by logistic regression that tested the effect of the combined CCR3 SNPs on blood eosino- philia differed depending on the eotaxin SNP: EOT2+304C>A (29L>I) with the CCR3 SNPs was significantly associated with blood eosinophilia (P=0.0087; Table 3). Thus, genetic suscepti- bility to blood eosinophilia in asthmatics is conferred by both CCR3 and eotaxin.
According to our GMDR results, the combination of CCR3- Table 2. Tests for dependence between the CCR3 gene SNPs and eotaxin gene SNPs
Eotaxin CCR3 With eosinophilia Without eosinophilia
-22557G>A -520T>G -174C>T +51T>C -22557G>A -520T>G -174C>T +51T>C
Eotaxin-1 -1329G>A 0.13 0.37 0.91 0.97 0.41 0.24 0.043 0.45
-329A>G 0.43 0.71 0.8 0.84 0.54 0.84 0.95 0.49
+123G>A 0.61 0.93 0.77 0.17 0.12 0.042 0.47 0.23
+371T>A 0.17 0.52 0.85 0.5 0.40 0.84 0.51 0.8
+1654G>A 0.3 0.29 0.77 0.83 0.83 0.43 0.43 0.69
+1671T>C 0.99 0.037 0.26 0.62 0.66 0.71 0.87 0.55
Eotaxin-2 +96G>A 0.83 0.75 0.67 0.92 0.33 0.12 0.41 0.61
+304C>A 0.037 0.016 0.009 0.53 0.65 0.74 0.41 0.54
+447C>T 0.85 0.85 0.69 0.37 0.84 0.92 0.58 0.14
+1272A>G 0.64 0.16 0.09 0.45 0.77 0.59 0.39 0.86
+1923A>C 0.91 0.57 0.83 0.47 0.87 0.36 0.4 0.77
Eotaxin-3 +77C>T 0.24 0.94 0.94 0.95 0.83 0.39 0.39 0.15
+7164A>G 0.33 0.2 0.1 0.52 0.42 0.64 0.75 0.87
+1579G>A 0.61 0.12 0.35 0.15 0.93 0.59 0.47 0.41
P values calculated from chi-square tests are presented for asthmatics with and without eosinophilia. P values in boldface are significant (P<0.05).
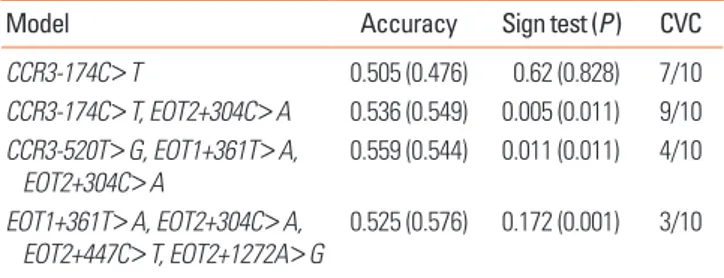
174C>T and EOT2+304C>A was the best model (accuracy=
0.536, CVC 9/10; Table 4). This combination was also the best model after adjustment for age and sex as covariates. The com- bination of the CC genotype of CCR3-174C>T and AA or AC genotype of EOT2+304C>A was detected in the high-risk group.
The combination of CT of CCR3-174C>T and CC of EOT2+304C
>A was also detected in the high-risk group (Figure).
DISCUSSION
Given the wealth of data showing that CCR3 and eotaxin par- ticipate in eosinophilic infiltration, the cooperative effect of the SNPs of CCR3 and eotaxin on eosinophilia in asthmatics was analyzed in this study. Three SNPs (CCR3-22557G>A, CCR3- 520T>G, and CCR3-174C>T) in CCR3 were significantly asso- ciated with the number of eosinophils in patients with asthma.11 Associations between EOT2+1272A>G and the risk of asthma, and between EOT1+123G>A and high serum total IgE levels, were reported in Korean asthmatics.15 However, these SNPs were not found as a best single-locus model in relation to blood eo- sinophilia in this study.
Gene-gene interactions in various diseases have been studied using a variety of approaches. These studies demonstrated that the overall disease risk can be modeled as the product of the risk conferred by many independent risk factors.16 In this study, gene-gene interactions were examined using 3 methods. First, a Chi-square test was conducted. Using this approach, EOT2+
304C>A was found to be significantly associated with the 3 in-
tronic SNPs of CCR3 in patients with eosinophilia (Table 2). Next, we used logistic regression analysis and designed an epistatic model as described previously.22 Three of the 4 CCR3 SNPs con- tributed independently to the eosinophilic phenotype in asth- ma. This model can be used to evaluate the mean effect of all SNPs in CCR3. Of the 14 SNPs in the eotaxin gene family, only 1 in eotaxin-2 (EOT2+304C>A [29L>I]) was significantly associ- ated with blood eosinophilia; however, the association was modified by the effect of CCR3 SNPs (P=0.0087; Table 3). Final- ly, we constructed an epistasis model using GMDR with and without covariate adjustment. Because the number of subjects in the 2 groups (asthmatics with or without eosinophilia) was different, GMDR was used instead of regular MDR. The combi- nation of EOT2+304C>A and CCR3-174C>T was the best mod- el. This model was still the best after adjustment for age and sex as covariates (Table 4). We successfully identified genotype combinations that contribute to eosinophilia in asthma using this model. Asthmatics, who had the C genotype of CCR3- 174C>T and A or AC of EOT2+304C>A and who had the CT genotype of CCR3-174C>T and C of EOT2+304C>A (Figure), Table 3. Gene-gene interactions between the CCR3 SNPs and eotaxin gene
SNPs in blood eosinophilia in asthmatics
Model β3 SE Chi-square P value
Eotaxin-1 SNP×CCR3 effect
-1328G>A×CCR3eff 0.11 0.46 0.06 0.81
-329A>G×CCR3eff -0.31 0.24 1.70 0.19
+123G>A×CCR3eff -0.62 0.36 3.07 0.08
+371T>A×CCR3eff -0.15 0.26 0.34 0.56
+1654G>A×CCR3eff 0.26 0.42 0.40 0.53
+1671T>C×CCR3eff 0.06 0.33 0.03 0.87
Eotaxin-2 SNP×CCR3 effect
+96G>A×CCR3eff 0.04 0.42 0.01 0.93
+304C>A(29L>I)×CCR3eff -0.68 0.26 6.89 0.0087*
+447C>T×CCR3eff 0.19 0.23 0.68 0.41
+1272A>G×CCR3eff -0.17 0.35 0.23 0.63
+1923A>C×CCR3eff -0.14 0.33 0.17 0.68
Eotaxin-3 SNP×CCR3 effect
+77C>T×CCR3eff -0.10 0.25 0.15 0.70
+7164A>G×CCR3eff 0.47 0.34 1.94 0.16
+1579G>A×CCR3eff -0.36 0.46 0.60 0.44
P values were calculated by logistic regression analysis. *Significant after the Bonferroni correction (P<0.01 for eotaxin-2). SE, standard error.
Table 4. Analysis of gene-gene interactions by GMDR
Model Accuracy Sign test (P) CVC
CCR3-174C>T 0.505 (0.476) 0.62 (0.828) 7/10 CCR3-174C>T, EOT2+304C>A 0.536 (0.549) 0.005 (0.011) 9/10 CCR3-520T>G, EOT1+361T>A,
EOT2+304C>A 0.559 (0.544) 0.011 (0.011) 4/10 EOT1+361T>A, EOT2+304C>A,
EOT2+447C>T, EOT2+1272A>G
0.525 (0.576) 0.172 (0.001) 3/10
The numbers in parentheses are the results after adjustment for age and sex as covariates. Age was used as a continuous variable and sex as a discrete vari- able. CVC, cross-validation consistency.
EOT2+304 C>A
CCR3-174 C>T
Accuracy 0.5355 CVC 10/10 P=0.005 lD’l=0.1871
C CT T
13.7
24.0
6.8
5.5
14.4
17.1
0.7
3.4
1.4 -6.9
-16.1
-10.7
-6.6
-19.9
-11.7
-2.8
-6.6
-2.5 A
AC
C
Figure. The best model was composed of CCR3-174C>T and EOT2+304C>A.
In each cell, the left bar represents a positive score and the right bar a negative score. High-risk genotype combinations are shaded dark grey, while low-risk genotypes are shaded light grey. Each P-value was obtained from a sign test, CVC, cross-validation consistency; |D’|: Lewontin’s |D’| for linkage disequilibrium.
were included in the high-risk group. Thus, the number of blood eosinophils is higher in asthmatics bearing these geno- type combinations.
No single SNP in the eotaxin gene family was associated with blood eosinophilia in asthma (data not shown). However, EOT2+304C>A in which leucine is changed to isoleucine inter- acted significantly with the effect of CCR3 SNPs on blood eo- sinophilia in asthmatics. This finding remained significant after correction with the Bonferroni test (P<0.01). The eotaxin and CCR3 pathways are thought to interact biologically, suggesting a gene-gene interaction, or epistasis. The term “epistasis” has been used to describe a “non-independence of effect”. In essence, if the effect of one unit is not predictable unless the value of an- other unit is known, the effect is epistatic.25 In this regard, the effect of EOT2+304C>A may not be disclosed if the effect of CCR3 SNPs is not considered. Moreover, there is no definite ev- idence that gene-gene interactions can be identified only among loci that show a significant association with phenotype.
There are some limitations to this study. First, blood eosino- philia was included in our models instead of sputum eosino- philia; however, a small number of patients had sputum eosin- ophilia. Second, it is difficult to confirm the results of interac- tion models biologically. Eosinophils are further decreased in the lungs and peribronchial tissues of eotaxin-1/-2 double- knockout mice, compared with CCR3-deficient mice.26 Howev- er, the knockout of eotaxin and CCR3 in animals has not been reported.
In summary, novel gene-gene interactions between SNPs of CCR3 and an SNP of eotaxin-2 in the same phenotype were identified in this study. Our analysis of the epistatic influence of CCR3 and eotaxin gene variants suggests that these variants may be candidate markers for eosinophilia in asthma and could be important in understanding the genetics underlying allergic diseases.
REFERENCES
1. Bousquet J, Chanez P, Lacoste JY, Barnéon G, Ghavanian N, Enander I, Venge P, Ahlstedt S, Simony-Lafontaine J, Godard P, Michel FB.
Eosinophilic inflammation in asthma. N Engl J Med 1990;323:
1033-9.
2. Oehling AG Jr, Walker C, Virchow JC, Blaser K. Correlation be- tween blood eosinophils, T-helper cell activity markers and pul- monary function in patients with allergic and intrinsic asthma. J Investig Allergol Clin Immunol 1992;2:295-9.
3. Ciprandi G, Cirillo I, Vizzaccaro A, Milanese M, Tosca MA. Airway function and nasal inflammation in seasonal allergic rhinitis and asthma. Clin Exp Allergy 2004;34:891-6.
4. Heath H, Qin S, Rao P, Wu L, LaRosa G, Kassam N, Ponath PD, Mackay CR. Chemokine receptor usage by human eosinophils.
The importance of CCR3 demonstrated using an antagonistic monoclonal antibody. J Clin Invest 1997;99:178-84.
5. Tillie-Leblond I, Hammad H, Desurmont S, Pugin J, Wallaert B, Tonnel AB, Gosset P. CC chemokines and interleukin-5 in bronchi-
al lavage fluid from patients with status asthmaticus. Potential im- plication in eosinophil recruitment. Am J Respir Crit Care Med 2000;
162:586-92.
6. Ying S, Robinson DS, Meng Q, Rottman J, Kennedy R, Ringler DJ, Mackay CR, Daugherty BL, Springer MS, Durham SR, Williams TJ, Kay AB. Enhanced expression of eotaxin and CCR3 mRNA and protein in atopic asthma. Association with airway hyperrespon- siveness and predominant co-localization of eotaxin mRNA to bronchial epithelial and endothelial cells. Eur J Immunol 1997;27:
3507-16.
7. Ma W, Bryce PJ, Humbles AA, Laouini D, Yalcindag A, Alenius H, Friend DS, Oettgen HC, Gerard C, Geha RS. CCR3 is essential for skin eosinophilia and airway hyperresponsiveness in a murine model of allergic skin inflammation. J Clin Invest 2002;109:621-8.
8. Blanchet MR, McNagny KM. Stem cells, inflammation and allergy.
Allergy Asthma Clin Immunol 2009;5:13.
9. Rådinger M, Bossios A, Sjöstrand M, Lu Y, Malmhäll C, Dahlborn AK, Lee JJ, Lötvall J. Local proliferation and mobilization of CCR3(+) CD34(+) eosinophil-lineage-committed cells in the lung. Immu- nology 2011;132:144-54.
10. Daugherty BL, Springer MS. The beta-chemokine receptor genes CCR1 (CMKBR1), CCR2 (CMKBR2), and CCR3 (CMKBR3) cluster within 285 kb on human chromosome 3p21. Genomics 1997;41:
294-5.
11. Lee JH, Chang HS, Kim JH, Park SM, Lee YM, Uh ST, Rhim T, Chung IY, Kim YH, Park BL, Park CS, Shin HD. Genetic effect of CCR3 and IL5RA gene polymorphisms on eosinophilia in asthmatic patients.
J Allergy Clin Immunol 2007;120:1110-7.
12. Garcia-Zepeda EA, Rothenberg ME, Ownbey RT, Celestin J, Leder P, Luster AD. Human eotaxin is a specific chemoattractant for eosin- ophil cells and provides a new mechanism to explain tissue eosin- ophilia. Nat Med 1996;2:449-56.
13. Rothenberg ME, MacLean JA, Pearlman E, Luster AD, Leder P. Tar- geted disruption of the chemokine eotaxin partially reduces anti- gen-induced tissue eosinophilia. J Exp Med 1997;185:785-90.
14. Pope SM, Fulkerson PC, Blanchard C, Akei HS, Nikolaidis NM, Zimmermann N, Molkentin JD, Rothenberg ME. Identification of a cooperative mechanism involving interleukin-13 and eotaxin-2 in experimental allergic lung inflammation. J Biol Chem 2005;280:
13952-61.
15. Shin HD, Kim LH, Park BL, Jung JH, Kim JY, Chung IY, Kim JS, Lee JH, Chung SH, Kim YH, Park HS, Choi JH, Lee YM, Park SW, Choi BW, Hong SJ, Park CS. Association of Eotaxin gene family with asthma and serum total IgE. Hum Mol Genet 2003;12:1279-85.
16. Carlson CS, Eberle MA, Kruglyak L, Nickerson DA. Mapping com- plex disease loci in whole-genome association studies. Nature 2004;
429:446-52.
17. Standards for the diagnosis and care of patients with chronic ob- structive pulmonary disease (COPD) and asthma. This official statement of the American Thoracic Society was adopted by the ATS Board of Directors, November 1986. Am Rev Respir Dis 1987;
136:225-44.
18. Crapo RO, Casaburi R, Coates AL, Enright PL, Hankinson JL, Irvin CG, MacIntyre NR, McKay RT, Wanger JS, Anderson SD, Cockcroft DW, Fish JE, Sterk PJ. Guidelines for methacholine and exercise challenge testing-1999. This official statement of the American Thoracic Society was adopted by the ATS Board of Directors, July 1999. Am J Respir Crit Care Med 2000;161:309-29.
19. Holland SM, Gallin JI. Disorders of granulocytes and monocytes.
In: Braunwald E, Fauci AS, Kaper DL, Hauser SL, Longo DL, Jame- son JL, editors. Harrison’s principles of internal medicine. 15th ed.
New York (NY): McGraw-Hill; 2001. 366-73.
20. Stephens M, Smith NJ, Donnelly P. A new statistical method for haplotype reconstruction from population data. Am J Hum Genet 2001;68:978-89.
21. Hedrick PW. Gametic disequilibrium measures: proceed with cau- tion. Genetics 1987;117:331-41.
22. Bugawan TL, Mirel DB, Valdes AM, Panelo A, Pozzilli P, Erlich HA.
Association and interaction of the IL4R, IL4, and IL13 loci with type 1 diabetes among Filipinos. Am J Hum Genet 2003;72:1505-14.
23. Lou XY, Chen GB, Yan L, Ma JZ, Zhu J, Elston RC, Li MD. A general- ized combinatorial approach for detecting gene-by-gene and gene- by-environment interactions with application to nicotine depen-
dence. Am J Hum Genet 2007;80:1125-37.
24. Ritchie MD, Hahn LW, Roodi N, Bailey LR, Dupont WD, Parl FF, Moore JH. Multifactor-dimensionality reduction reveals high-or- der interactions among estrogen-metabolism genes in sporadic breast cancer. Am J Hum Genet 2001;69:138-47.
25. Brodie ED III. Why evolutionary genetics does not always add up.
In: Wolf JB, Brodie ED III, Wade MJ, editors. Epistasis and the evo- lutionary process. New York (NY): Oxford University Press; 2000.
3-19.
26. Pope SM, Zimmermann N, Stringer KF, Karow ML, Rothenberg ME. The eotaxin chemokines and CCR3 are fundamental regula- tors of allergen-induced pulmonary eosinophilia. J Immunol 2005;
175:5341-50.