INTRODUCTION
Atopic dermatitis (AD) is a chronic, pruritic inflammatory skin disease and is one of the most common allergic diseases in children. The prevalence of AD is currently increasing and the incidence in children is reported to range from 15%−30% world- wide.1,2 Although the occurrence of AD is associated with genet- ic factors,3,4 recent rising incidence rate is more likely to be re- lated with environmental factors.5-7 Many studies have reported on the effects of aeroallergens including pet hair, house dust mite, pollen, and others on the deterioration of AD.8-12 In addi- tion, the role of environmental pollutants on the occurrence and deterioration of AD has been investigated.13-15 Airborne particulate matters (PM) have been identified to be one of the risk factors related with deteriorating skin condition of AD pa-
Relationship Between Indoor Air Pollutant Levels and Residential Environment in Children With Atopic Dermatitis
Jung Hyun Lee,
1Ho Seok Lee,
2Mi Ran Park,
2Sang Woon Lee,
3Eun Hye Kim,
4Joong Bum Cho,
2Jihyun Kim,
2,3Youngshin Han,
3Kweon Jung,
5Hae Kwan Cheong,
4Sang Il Lee,
2,3Kangmo Ahn
2,3*
1Department of Pediatrics, Gwangmyeong Sungae Hospital, Gwangmyeong, Korea
2 Department of Pediatrics and 3Environmental Health Center for Atopic Diseases, Samsung Medical Center, Sungkyunkwan University School of Medicine, Seoul, Korea
4Department of Social and Preventive Medicine, Sungkyunkwan University School of Medicine, Suwon, Korea
5Seoul Research Institute of Public Health & Environment, Seoul, Korea
tients.16 Indoor redecoration activities before birth and in the first years of life are associated with the development of AD in early childhood.17 Exposure to volatile organic compounds (VOCs) can damage the epidermal barrier and enhance ad- verse effects of house dust mites on sensitized subjects with AD.18 Exposure to formaldehyde and nitrogen dioxide (NO2) at Purpose: This study was aimed to investigate the relationship between indoor air pollutant levels and residential environment in children with atopic dermatitis (AD) living in Seoul. Methods: A total of 150 children with AD were included. Residential environment was assessed by question- naires which were completed by their parents. To evaluate the level of exposure to the indoor air pollutants, concentrations of the indoor air pollut- ants including particulate matter with diameter less than 10 µm (PM10), formaldehyde, carbon dioxide (CO2), carbon monoxide (CO), nitrogen dioxide (NO2), Total Volatile Organic Compound (TVOC), benzene, toluene, ethyl-benzene, xylene, styrene, bacterial aerosols, and airborne fungi were mea- sured. Results: A significant difference was exhibited in the levels of PM10 in case of visible fungus on the walls (P=0.047). There was relationship between the construction year of the house, moving to a newly constructed building within 1 year and formaldehyde level. With the use of artificial air freshener, the differences were found in the concentrations of TVOC (P=0.003), benzene (P=0.015), toluene (P=0.012) and ethyl-benzene (P=0.027). The concentration of xylene was significantly high when oil was used as heating fuel (P=0.015). Styrene exhibited differences depend- ing on building type and its concentrations were significantly high in a residential and commercial complex building (P=0.005). The indoor concen- tration of bacterial aerosols was significantly low with the use of air cleaner (P=0.045). High NO2, benzene concentrations were present in case of almost no ventilation (P=0.028 and P=0.028, respectively). Conclusions: Individual residential environments are closely related with the levels of the indoor air pollutants. To alleviate AD symptoms, simple questions about residential environments such as visible fungus on the walls and the use of artificial air freshener are helpful to assess the possibility of increased indoor air pollutant levels when direct measurement is not available.
Key Words: Atopic dermatitis; environment; childhood; air pollution; pollutant
This is an Open Access article distributed under the terms of the Creative Commons Attribution Non-Commercial License (http://creativecommons.org/licenses/by-nc/3.0/) which permits unrestricted non-commercial use, distribution, and reproduction in any medium, provided the original work is properly cited.
Correspondence to: Kangmo Ahn, MD, PhD, Department of Pediatrics, Samsung Medical Center, Sungkyunkwan University School of Medicine, 81 Irwon-ro, Gangnam-gu, Seoul 135-710, Korea.
Tel: +82-2-3410-3530; Fax: +82-2-3410-0805; E-mail: [email protected] Received: July 8, 2013; Revised: April 26, 2014; Accepted: May 2, 2014
•This study was funded by Environmental Health Research Center Project by the Ministry of Environment, Korea.
•There are no financial or other issues that might lead to conflict of interest.
Allergy Asthma Immunol Res. 2014 November;6(6):517-524.
http://dx.doi.org/10.4168/aair.2014.6.6.517 pISSN 2092-7355 • eISSN 2092-7363
domestic concentration can cause skin barrier function impair- ment in patients with AD.15 High levels of Staphylococcus aure- us may contribute to disease severity and persistence in AD pa- tients.19
The concentrations of indoor air pollutants are affected by lifestyle and residential environment.20 Identifying sources of indoor air pollution could be beneficial in creating favorable environment for AD patients. However, there was no report on the residential environments in relation to the concentrations of indoor pollutants in Korean houses. This study was aimed to investigate the relationship between residential environment and indoor air pollutant levels in the houses of AD patients liv- ing in Seoul, Korea.
MATERIALS AND METHODS Participants
The study subjects comprised 150 AD patients living in Seoul.
Assessment of residential environment was by a questionnaire and direct measurement of indoor air pollutant levels was con- ducted in the residences of all the subjects from March, 2008 to April, 2010. The diagnosis of AD was conducted by Hanifin and Rajka’s diagnostic criteria.21 This study was approved by the insti- tutional review board at Samsung Medical Center in Seoul (IRB approval number: 2013-02-024-001). Written informed consent was obtained from parents prior to participation in the study.
Assessment of residential environments by questionnaires The parents of all participants were asked to complete a ques- tionnaire for assessing residential environment. The contents of the questionnaire included age, gender, socioeconomic status (monthly family income, educational background of mother) and environmental factors relating to indoor air quality (paren- tal smoking, frequency of vacuuming and frequency of ventila- tion, distance to nearest major roads, facilities within 2 km of the home, building type, type of floors, indoor renovations within 5 years, moving to newly constructed house within 1 year, carpet, fabric sofa, air cleaner, air conditioning, humidifi- er, insecticide use and indoor domestic pets).
Direct measurement of indoor air pollutant concentrations Indoor air pollutant concentrations were measured including particulate matter with diameter less than 10 µm (PM10), form- aldehyde, carbon dioxide (CO2), carbon monoxide (CO), nitro- gen dioxide (NO2), total volatile organic compound (TVOC), benzene, toluene, ethyl-benzene, xylene, styrene, bacterial aero- sols and airborne fungi.
Mini-volume Air Sampler, Model 4.1 (Airmetrics Co, Eugene, OR, USA) was used to sample PM10. Each sample collection was conducted in the living room for 8 hours during the daytime at a constant sampling flow rate of 10 L/min. The sampling spot was chosen at a place 1 meter or more away from the walls, ceil-
ing and floor, and the sampler was positioned 1.2−1.5 meters above the floor. Formaldehyde was assessed using personal air sampler (SIBATA MP -∑100H, Japan). Sampling was for 30 min- utes at a flow rate of 1 L/min. TVOC was assessed using a stain- less steel adsorption tube (1/4 inch×9 cm, PerkinElmer, Inc., Shelton, UK) charged with 200 mg or above Tenax-TA (60/80 mesh; Supelco, Bellerfonte, PA, USA) through solid-phase ad- sorption. This sampler was also positioned 1.2−1.5 meters above the living room floor and at the same height in a child’s room.
Sampling was for 30 minutes at a flow rate of 0.1 L/min. A Tur- bomatrix ATD (PerkinElmer Inc) heat processor, and various types of gas chromatography (GC-MSD, HP-6890 and Agilent 5973; Hewlett-Packard, USA; Agilent, USA) were used in the analyses. The pump used in capturing CO, CO2 and NO2 gases was APEX personal air sampler (Casella, Bedford, UK) with re- duced fluctuating flow rate before and after sampling. These gases were consecutively collected in a 10 L tetra bag (Supelco) at a flow rate of 1 L/min, and analyzed by a gas analyzer (Eco- tech, Australia). Bacterial aerosols and airborne fungi were as- sessed using a model 10-880 Single Stage Ambient Viable Sam- pler (Tisch Environmental, Cleves, OH, USA). Tryptic Soy Agar (TSA) for bacterial aerosols, Malt Extract Agar (MEA) for air- borne fungi was the medium. Microbial sampling lasted for 5 minutes at a flow rate of 28.3 L/min 1.2−1.5 meters above living room and child’s room floors. The media were cultivated in a MIR252 incubator (SANYO, Japan) at 35°C for 48 hours. Colony forming units (CFU) per area was calculated by dividing CFU value by indoor air volume.
Statistical analyses
Data gathered through indoor environment assessment and survey was analyzed using SAS version 9.1 (SAS Institute, Cary, NC, USA). All values are presented as the mean±SD. The cor- relation between various environmental factors in question- naires and the direct measurement values of indoor air quality was examined by Pearson correlation analysis to select the resi- dential environment mainly contributing indoor air pollution.
Subsequently, influencing variables were adjusted and are pre- sented as least squares mean±standard error. A one-way ANO- VA was conducted to compare the relationship between the di- rect measurement values of indoor air quality and the residen- tial environment mainly contributing indoor air pollution. In- fluencing variables were adjusted by analysis of covariance (ANCOVA). The results were determined to be statistically sig- nificant if the P value was<0.05.
RESULTS
AD patients comprised of 93 boys and 57 girls. The mean age of the respondents was 27.0±21.7 months (range 2-168 months).
Table 1 shows the distributions of indoor air pollutants levels.
Furthermore, the descriptive statistics are shown for tempera-
Table 1. The temperature, humidity and concentrations of indoor air pollutants in the homes of the participants
Mean SD Percentile
5 25 50 75 90 95 99
Temperature (°C) 23.4 2.2 19.8 21.9 23.5 25.0 26.1 26.9 31.2
Humidity (%) 42.6 9.3 30.0 36.0 42.0 48.4 55.5 59.1 66.0
PM10 (µg/m3) 66.3 30.3 24.6 42.9 63.8 82.4 107.5 124.7 147.7
Formaldehyde (µg/m3) 75.6 52.1 23.7 40.0 61.0 98.2 145.7 171.7 284.6
TVOC (µg/m3) 648.2 512.5 181.5 312.2 556.5 735.7 1,124.4 1,893.3 2,591.9
Benzene (µg/m3) 2.8 2.0 1.0 1.5 2.4 3.4 4.6 6.1 11.8
Toluene (µg/m3) 95.3 100.7 17.8 30.6 60.8 124.2 218.1 271.0 559.3
Ethyl-benzene (µg/m3) 5.7 5.8 0.9 2.4 4.0 7.2 14.5 16.8 33.8
Xylene (µg/m3) 10.6 15.9 0.9 2.9 5.9 11.1 31.1 38.6 85.8
Styrene (µg/m3) 3.5 5.8 0.2 0.9 1.7 3.0 15.4 17.0 33.4
Bacterial aerosols (CFU/m3) 646.6 417.1 132.7 366.5 575.0 824.9 1,134.9 1,500.0 2,550.0
Airborne fungi (CFU/m3) 212.3 281.8 22.7 68.3 114.3 245.0 465.0 650.0 1,600.0
SD, standard deviation; PM, particulate matter; TVOC, total volatile organic compound.
PM10 Formald-
ehyde CO2 CO NO2 Benzene Toluene Ethyl-benzene Xylene Styrene TVOCs Bacteria Fungi Building type
Construction year Number of floors
Type of living room floor covering Type of bedroom floor covering Indoor renovations
within 5 years Painting New floor covering Wallpaper change New furniture or electronics Moving to newly constructed building within 1 year Frequency of vacuuming Ventilation type Use of air cleaner Type of heating fuel Visible mold on the walls Use of artificial air freshener Insecticide use
Indoor domestic pets Air-purifying indoor plants Parental smoking
Distance to the nearest major roads Facilities within 2 km of the home
Figure. Distribution of environmental factors mainly contributing to level of the indoor air pollutants.
P<0.05, P<0.1, P<0.15 . PM, particulate matter; CO2, carbon dioxide; CO, carbon monoxide; NO2, nitrogen dioxide; TVOC, total volatile organic compound.
ture, humidity, PM10, formaldehyde, TVOC, benzene, toluene, ethyl-benzene, xylene, styrene, bacterial aerosols and airborne
fungi levels.
The relationship between the residential environment and in-
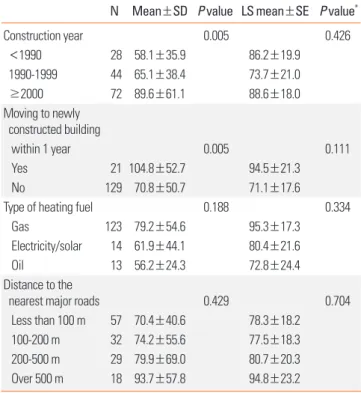
Table 3. The relationship between formaldehyde level (µg/m3) and contributing environmental factors
N Mean±SD P value LS mean±SE P value*
Construction year 0.005 0.426
<1990 28 58.1±35.9 86.2±19.9
1990-1999 44 65.1±38.4 73.7±21.0
≥2000 72 89.6±61.1 88.6±18.0
Moving to newly constructed building
within 1 year 0.005 0.111
Yes 21 104.8±52.7 94.5±21.3
No 129 70.8±50.7 71.1±17.6
Type of heating fuel 0.188 0.334
Gas 123 79.2±54.6 95.3±17.3
Electricity/solar 14 61.9±44.1 80.4±21.6
Oil 13 56.2±24.3 72.8±24.4
Distance to the
nearest major roads 0.429 0.704
Less than 100 m 57 70.4±40.6 78.3±18.2
100-200 m 32 74.2±55.6 77.5±18.3
200-500 m 29 79.9±69.0 80.7±20.3
Over 500 m 18 93.7±57.8 94.8±23.2
*Adjusted for age, gender, temperature, humidity, building type, construction year, distance to the nearest major roads, ventilation type, type of heating fuel, indoor domestic pets and moving to newly constructed building.
SD, standard deviation; LS mean, least squares mean; SE, standard error.
Table 2. The relationship between PM10 level (µg/m3) and contributing environ- mental factors
N Mean±SD P value LS mean±SE P value*
Construction year 0.305 0.571
<1990 28 62.3±27.1 78.6±12.4
1990-1999 44 63.6±26.2 72.3±12.9
≥2000 71 70.9±33.8 81.0±12.0
Number of floors 0.191 0.698
1st-5th 73 71.7±31.2 80.7±11.2
6-9th 26 63.6±34.0 73.4±12.8
≥10th 43 61.9±25.4 77.7±13.1
Indoor renovation:
painting within
5 years 0.123 0.185
Yes 35 59.4±24.4 72.3±12.9
No 114 68.4±31.6 82.3±11.1
Ventilation type 0.248 0.487
Windows 129 65.4±29.4 69.8±10.1
Mixed (central +
windows) 15 70.9±34.3 70.6±12.1
Almost no
ventilation 3 92.8±37.1 91.5±20.6 Visible mold on the
walls 0.038 0.047
Yes 42 74.5±31.7 83.3±12.6
No 107 63.1±29.2 70.3±11.1
*Adjusted for age, gender, temperature, humidity, building type, construction year, distance to the nearest major roads, ventilation type, type of heating fuel, indoor domestic pets, number of floors, indoor renovation(painting) and visible mold on the walls.
PM, particulate matter; SD, standard deviation; LS mean, least squares mean;
SE, standard error.
door air pollutant levels are presented in Figure. Pearson corre- lation analysis was used to examine the relationship between each environmental factor in the questionnaires and the con- centrations of each indoor air pollutant. Those factors with no statistical significance were excluded. For the next analysis, we selected the environmental factors with P value<0.05 and 0.05−0.15, although the latter were weakly statistically signifi- cant. One-way ANOVA was conducted on the environmental factors with P<0.15.
Presence of visible mold on the walls was significantly corre- lated with concentration of PM10 (P=0.038) (Table 2), while other contributing factors such as construction year, number of floors, indoor renovation and ventilation type were not statisti- cally significant. This difference persisted after adjusting with the other contributing factors (P=0.047).
The concentration of formaldehyde was significantly related with the house construction year (P=0.005) and moving to a newly constructed building within 1 year (P=0.005) (Table 3).
However, no significant difference was found after adjustment.
The concentration of TVOC was significantly high with mixed type of ventilation (P=0.009) and the use of artificial air fresh- ener (P<0.001). When adjusted with age, gender, temperature, humidity, building type, construction year, distance to the near- est major roads, ventilation type, type of heating fuel, indoor domestic pets, type of bedroom floor covering, use of air clean- er and use of artificial air freshener, a significant difference was persistent in TVOC concentrations with the use of artificial air freshener (P=0.003) (Table 4).
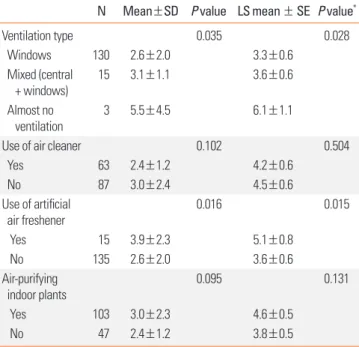
We also analyzed the concentration of each air pollutant con- stituting indoor TVOC, including benzene, toluene, ethyl-ben- zene, xylene and styrene. The indoor concentration of benzene exhibited significant relationships with ventilation types (P=0.035), and the use of artificial air freshener (P=0.016). After adjustment of confounding factors, a statistical significance was still present concerning ventilation type (P=0.028) and the use of artificial air freshener (P=0.015). A significantly high concen- tration of benzene was observed in case of ‘almost no ventila- tion’ compared with ventilation through windows or a central ventilation system (Table 5). The concentrations of toluene and ethyl-benzene were significantly high with the use of artificial air freshener (P=0.012 and P=0.027, respectively) even after ad- justment (data not shown). The concentration of xylene exhibit-
Table 4. The relationship between TVOC level (µg/m3) and contributing envi- ronmental factors
N Mean±SD P value LS mean±SE P value* Type of bedroom
floor covering 0.812 0.984
Polyvinyl chloride 107 614.9±482.5 1,027.4±196.4
Paper 7 539.4±233.7 1,192.4±584.7
Wood 31 711.3±561.9 1,036.8±221.5
Others† 5 1,122.1±896.9 1,091.4±263.4
Ventilation type 0.009 0.471
Windows 130 588.3±406.3 1,080.9±241.7
Mixed (central + windows)
15 995.4±925.0 1,282.4±220.0 Almost no
ventilation 3 633.4±250.6 897.8±375.8
Use of air cleaner 0.151 0.327
Yes 63 718.9±640.3 1,136.6±242.2
No 87 597.0±391.5 1,037.4±230.0
Use of artificial
air freshener <0.001 0.003
Yes 15 1,182.6±20.2 1,355.1±272.5
No 135 588.9±410.0 818.9±220.0
*Adjusted for age, gender, temperature, humidity, building type, construction year, distance to the nearest major roads, ventilation type, type of heating fuel, indoor domestic pets, type of bedroom floor covering, use of air cleaner and use of artificial air freshener; †marble, ceramic and clay tile.
TVOC, total volatile organic compound; SD, standard deviation; LS mean, least squares mean; SE, standard error.
Table 5. The relationship between benzene level (µg/m3) and contributing envi- ronmental factors
N Mean±SD P value LS mean ± SE P value*
Ventilation type 0.035 0.028
Windows 130 2.6±2.0 3.3±0.6
Mixed (central
+ windows) 15 3.1±1.1 3.6±0.6
Almost no
ventilation 3 5.5±4.5 6.1±1.1
Use of air cleaner 0.102 0.504
Yes 63 2.4±1.2 4.2±0.6
No 87 3.0±2.4 4.5±0.6
Use of artificial
air freshener 0.016 0.015
Yes 15 3.9±2.3 5.1±0.8
No 135 2.6±2.0 3.6±0.6
Air-purifying
indoor plants 0.095 0.131
Yes 103 3.0±2.3 4.6±0.5
No 47 2.4±1.2 3.8±0.5
*Adjusted for age, gender, temperature, humidity, building type, construction year, distance to the nearest major roads, ventilation type, type of heating fuel, indoor domestic pets, use of air cleaner, artificial air freshener and air-purifying indoor plants.
SD, standard deviation; LS mean, least squares mean; SE, standard error.
Table 6. The relationship between bacterial aerosols level (CFU/m3) and con- tributing environmental factors
N Mean±SD P value LS mean ± SE P value*
Number of floors 0.053 0.837
1st-5th 74 729.4±436.9 593.6±174.9
6-9th 26 514.2±302.3 531.3±194.6
≥ 10th 43 602.0±444.4 536.6±200.1
Type of bedroom
floor covering 0.527 0.430
Polyvinyl chloride 77 720.8±488.8 702.4±170.8
Paper 2 435.0±77.8 354.1±305.0
Wood 57 585.7±319.7 696.4±207.3
Others† 10 581.8±282.0 462.5±241.6
Use of air cleaner 0.025 0.045
Yes 63 557.7±411.5 482.1±184.3
No 87 711.0±411.6 625.6±180.0
Visible mold on the
walls 0.146 0.087
Yes 42 726.0±364.9 638.6±194.1
No 108 615.8±433.4 469.1±172.6
*Adjusted for age, gender, temperature, humidity, building type, construction year, distance to the nearest major roads, ventilation type, type of heating fuel, indoor domestic pets, number of floors, type of bedroom floor covering, use of air cleaner and visible mold on the walls; †marble, ceramic and clay tile.
SD, standard deviation; LS mean, least squares mean; SE, standard error.
ed a significant relationship only with heating fuels (P=0.015).
Concentration of xylene was significantly higher when oil was used as fuel than gas or electricity (data not shown). The con- centration of styrene was significantly related with building type (P=0.005) after adjustment. Concentration of styrene concen- tration was significantly higher in a residential and commercial complex building than a detached house, apartment or row house. Although styrene concentration seemed to be related with new furniture or electronics, use of air purifier, use of artifi- cial air freshener and air-purifying indoor plants, there was no significant difference (data not shown).
With regard to bacterial aerosols, a significant difference was shown by the use of air cleaner (P=0.045) when the contribut- ing factors were adjusted. The indoor concentration of bacterial aerosols was significantly low with the use of air cleaner (Table 6). The concentration of airborne fungi had significant relation- ships with ventilation type (P=0.034) and indoor domestic pets (P=0.001). However, this difference disappeared when adjust- ing with confounders (Table 7).
When the relationship between CO2 concentrations and resi- dential environment survey was analyzed, the concentration of CO2 was significantly low when moving to a newly constructed building within 1 year (P=0.017). In contrast, CO2 concentration
was significantly high for residences containing pets (P=0.003).
Although the concentration of CO2 was related with the number of floors and the purchase of new furniture or electronics, no sta- tistical difference was observed (data not shown). The concen- tration of CO was related with types of living room floor cover- ing, moving to a newly constructed building and the use of artifi- cial air freshener among survey items. However, no significant difference was found after the adjustment (data not shown). The indoor concentration of NO2 showed a significant relationship with ventilation type among effective factors in residential envi- ronment survey (P=0.013). A significant difference was also ob- served after adjusting confounding factors (P=0.028). A signifi- cantly high concentration of NO2 was observed in case of ‘al- most no ventilation’ compared with ventilation through win- dows or a central ventilation system (data not shown).
DISCUSSION
In several studies, indoor air pollution has been considered to act as an aggravating factor in AD.22-24 More attention need to be paid to indoor air quality in AD patients, because AD is most prevalent in infants and young children and they spend most of their time indoors. Therefore, it is important to detect hazard- ous indoor air pollutants to prevent exacerbation of AD symp- toms. Although direct measurement of indoor air pollutant lev- el is the best way, it is not easily available in every house of indi- vidual AD patient. In this study, we measured the concentra- tions of 13 indoor air pollutants by visiting the residence of each AD patient and investigated which residential environment could be attributed to increased level of each air pollutant in an
attempt to evaluate indoor air quality indirectly. In particular, our results would be helpful for Korean children with AD, be- cause residential environment varies in each region according to life style, economic status and outdoor air pollutant level.
In homes, particles from combustion (e.g., use of wood stoves, kitchen cooking and candles) and tobacco smoking are major components of indoor air pollution.25,26 Higher prenatal expo- sure to fine particulate matter combined with postnatal expo- sure to environmental tobacco smoke may increase the risk of infant eczema.27 A moderate increase in long-term exposure to background ambient air pollutants such as ozone and PM10 has been associated with an increased prevalence of AD in chil- dren.28 The concentration of ambient ultrafine particles may ex- acerbate skin symptoms in children with AD.29 Our study showed that significantly high concentration of PM10 was relat- ed with visible mold on the walls. As PM includes particles from fungi,30,31 our result suggests that removal of visible mold might be helpful to lower indoor PM10 concentration.
Formaldehyde is a well-known irritant of the upper respiratory tract with symptoms such as eye, nose and throat irritation com- monly associated with indoor exposure to the gas. Indoor sourc- es of formaldehyde include particle board, plywood, fireboard, paneling, urea formaldehyde foam insulation and some carpets and furniture, as well as some household chemicals.32 Exposure to low concentrations of formaldehyde for a short period of time influences skin surface parameters, especially the skin barrier function, in patients with AD.15 Low level exposure to indoor formaldehyde may increase the risk of allergic sensitization to common aeroallergens in children.32 In one study, participants experiencing recent indoor renovation showed the odds ratios of 1.9 (95% CI: 1.4-2.7) for eczema.17 As the level of formalde- hyde increases in cases of moving to a newly-built building or a renovated house,33,34 lowering formaldehyde level should be taken into account if there is a family member with AD.
Floor wall coverings were the most influential source of in- door VOCs, followed by household cleaning products, wood paneling/furniture, paints and moth repellents.35 Exposure to VOCs can damage the epidermal barrier and enhance adverse effects of house dust mites on sensitized subjects with AD.18 The recruitment and differentiation of eosinophil/basophil progen- itors in response to exposure to environmental tobacco smoke (ETS)-related VOCs during pregnancy or at 1 year of age may play a role in the development of AD or cradle cap during the first year of life.36 In this study, the use of artificial air freshener was significantly associated with high concentrations of ben- zene, toluene, ethyl-benzene and TVOC, supporting previous data.37 Building type was also one of the factors related to in- door air pollutants including styrene. The levels of volatile sub- stances such as styrene were significantly high in commercial buildings. Our results were similar to those from the previous studies where the levels of volatile substances, particulate mat- ter and CO2 were high due to a large transient population and Table 7. The relationship between airborne fungi level (CFU/m3) and contribut-
ing environmental factors
N Mean ± SD P value LS mean ± SE P value* Moving to newly
constructed building 0.077 0.340
within 1 year
Yes 19 106.0±63.4 242.9±107.1
No 127 228.2±298.1 315.5±89.6
Ventilation type 0.034 0.175
Windows 126 194.8±250.0 237.3±83.9
Mixed (central +
windows) 15 391.1±471.2 388.0±92.8
Almost no ventilation 3 135.8±93.0 212.4±168.5
Indoor domestic pets 0.001 0.072
Yes 8 514.3±554.9 395.4±138.1
No 138 194.8±250.4 163.0±75.8
*Adjusted for age, gender, temperature, humidity, building type, construction year, distance to the nearest major roads, ventilation type, type of heating fuel, indoor domestic pets, moving to newly constructed building and indoor domestic pets.
SD, standard deviation; LS mean, least squares mean; SE, standard error.
displaced various products in buildings.38 Heating fuel was re- lated to xylene, since the concentration of xylene was signifi- cantly high with the use heating oil as the fuel. Xylene is one of the basic and primary oils produced in the petroleum and pet- rochemical industries. It has been reported to increase the risk of sick house syndrome along with toluene and TVOC.39 The indoor concentrations of CO2 and airborne fungi were signifi- cantly high in case of subjects raising domestic pets. When in- dividuals are frequently exposed to domestic pets, they could be infected by fungus such as Stachybotrys chartarum.40,41 With regard to indoor bacterial aerosols, a significantly low concen- tration was associated with the use of air cleaner.
The aim of this study was not to verify the causality between the indoor air pollution and exacerbation of AD symptoms, but to investigate the relationship between the residential environ- ment and indoor air pollutant levels in the homes of Korean children with AD. In addition, some limitations should be con- sidered when interpreting our results. First, our results did not represent general Korean life style, because the residential areas of the participants in this study were restricted to Seoul, the larg- est metropolitan city in Korea. Secondly, we measured the con- centrations of indoor air pollutants at a single time point in each house, although the questionnaire solicited information on the life style and environmental change in the previous 12 months.
The measured levels possibly did not reflect the exact level of exposure to each air pollutant, because those levels might be in- fluenced by various confounding factors on a daily basis.
In conclusion, the residential environment of AD patients liv- ing in Seoul is closely related with each indoor air pollutant lev- els. To alleviate AD symptoms, identifying aggravating factors including indoor air quality is important. In this regard, simple questioning about aspects of residential environment such as visible fungus on the walls and the use of artificial air freshener are helpful to assess the possibility of increased indoor air pol- lutant levels when direct measurement is not feasible.
REFERENCES
1. Leung DY, Bieber T. Atopic dermatitis. Lancet 2003;361:151-60.
2. Williams H, Flohr C. How epidemiology has challenged 3 prevail- ing concepts about atopic dermatitis. J Allergy Clin Immunol 2006;
118:209-13.
3. Kim HY, Jang EY, Sim JH, Kim JH, Chung Y, Park SH, Hwang EM, Han Y, Ahn K, Lee SI. Effects of family history on the occurrence of atopic dermatitis in infants. Pediatr Allergy Respir Dis 2009;19:106- 14.
4. Bisgaard H, Halkjaer LB, Hinge R, Giwercman C, Palmer C, Silveira L, Strand M. Risk analysis of early childhood eczema. J Allergy Clin Immunol 2009;123:1355-60.e5.
5. Wang IJ, Guo YL, Weng HJ, Hsieh WS, Chuang YL, Lin SJ, Chen PC.
Environmental risk factors for early infantile atopic dermatitis. Pe- diatr Allergy Immunol 2007;18:441-7.
6. Miyake Y, Ohya Y, Tanaka K, Yokoyama T, Sasaki S, Fukushima W, Ohfuji S, Saito K, Kiyohara C, Hirota Y; Osaka Maternal and Child
Health Study Group. Home environment and suspected atopic ec- zema in Japanese infants: the Osaka Maternal and Child Health Study. Pediatr Allergy Immunol 2007;18:425-32.
7. Sebõk B, Schneider I, Harangi F; Primary Care Paediatricians in Baranya County. Familiar and environmental factors influencing atopic dermatitis in the childhood. J Eur Acad Dermatol Venereol 2006;20:418-22.
8. Matsunaga I, Miyake Y, Yoshida T, Miyamoto S, Ohya Y, Sasaki S, Tanaka K, Oda H, Ishiko O, Hirota Y; Osaka Maternal and Child Health Study Group. Ambient formaldehyde levels and allergic disorders among Japanese pregnant women: baseline data from the Osaka maternal and child health study. Ann Epidemiol 2008;
18:78-84.
9. Purvis DJ, Thompson JM, Clark PM, Robinson E, Black PN, Wild CJ, Mitchell EA. Risk factors for atopic dermatitis in New Zealand chil- dren at 3.5 years of age. Br J Dermatol 2005;152:742-9.
10. Capristo C, Romei I, Boner AL. Environmental prevention in atop- ic eczema dermatitis syndrome (AEDS) and asthma: avoidance of indoor allergens. Allergy 2004;59 Suppl 78:53-60.
11. Schäfer T, Heinrich J, Wjst M, Adam H, Ring J, Wichmann HE. As- sociation between severity of atopic eczema and degree of sensiti- zation to aeroallergens in schoolchildren. J Allergy Clin Immunol 1999;104:1280-4.
12. Darsow U, Vieluf D, Ring J. The atopy patch test: an increased rate of reactivity in patients who have an air-exposed pattern of atopic eczema. Br J Dermatol 1996;135:182-6.
13. Solé D, Camelo-Nunes IC, Wandalsen GF, Pastorino AC, Jacob CM, Gonzalez C, Wandalsen NF, Rosário Filho NA, Fischer GB, Naspitz CK. Prevalence of symptoms of asthma, rhinitis, and atopic ecze- ma in Brazilian adolescents related to exposure to gaseous air pol- lutants and socioeconomic status. J Investig Allergol Clin Immunol 2007;17:6-13.
14. Ibargoyen-Roteta N, Aguinaga-Ontoso I, Fernandez-Benitez M, Marin-Fernandez B, Guillen-Grima F, Serrano-Monzo I, Hermoso- de-mendoza J, Brun-Sandiumetge C, Ferrer-Nadal A, Irujo-Andue- za A. Role of the home environment in rhinoconjunctivitis and ec- zema in schoolchildren in Pamplona, Spain. J Investig Allergol Clin Immunol 2007;17:137-44.
15. Eberlein-König B, Przybilla B, Kühnl P, Pechak J, Gebefügi I, Klein- schmidt J, Ring J. Influence of airborne nitrogen dioxide or formal- dehyde on parameters of skin function and cellular activation in patients with atopic eczema and control subjects. J Allergy Clin Im- munol 1998;101:141-3.
16. Hon KL, Leung TF, Ching G, Chow CM, Luk V, Ko WS, Ng PC. Pat- terns of food and aeroallergen sensitization in childhood eczema.
Acta Paediatr 2008;97:1734-7.
17. Herbarth O, Fritz GJ, Rehwagen M, Richter M, Röder S, Schlink U.
Association between indoor renovation activities and eczema in early childhood. Int J Hyg Environ Health 2006;209:241-7.
18. Huss-Marp J, Eberlein-König B, Breuer K, Mair S, Ansel A, Darsow U, Krämer U, Mayer E, Ring J, Behrendt H. Influence of short-term exposure to airborne Der p 1 and volatile organic compounds on skin barrier function and dermal blood flow in patients with atopic eczema and healthy individuals. Clin Exp Allergy 2006;36:338-45.
19. Leung AD, Schiltz AM, Hall CF, Liu AH. Severe atopic dermatitis is associated with a high burden of environmental Staphylococcus aureus. Clin Exp Allergy 2008;38:789-93.
20. Schirmer WN, Pian LB, Szymanski MS, Gauer MA. Air pollution in internal environments and sick building syndrome. Cien Saude
Colet 2011;16:3583-90.
21. Hanifin JM, Rajka G. Diagnositc features of atopic dermatitis. Acta Derm Venereol Suppl (Stockh) 1980;Suppl 92:44-7.
22. Choi H, Schmidbauer N, Sundell J, Hasselgren M, Spengler J, Bornehag CG. Common household chemicals and the allergy risks in pre-school age children. PLoS One 2010;5:e13423.
23. Kim H, Bernstein JA. Air pollution and allergic disease. Curr Aller- gy Asthma Rep 2009;9:128-33.
24. Charpin D, Penard-Morand C, Raherison C, Kopferschmitt C, La- vaud F, Caillaud D, Annesi-Maesano I. Long-term exposure to ur- ban air pollution measured through a dispersion model and the risk of asthma and allergy in children. Bull Acad Natl Med 2009;
193:1317-28.
25. Weichenthal S, Dufresne A, Infante-Rivard C. Indoor ultrafine par- ticles and childhood asthma: exploring a potential public health concern. Indoor Air 2007;17:81-91.
26. Naeher LP, Brauer M, Lipsett M, Zelikoff JT, Simpson CD, Koenig JQ, Smith KR. Woodsmoke health effects: a review. Inhal Toxicol 2007;19:67-106.
27. Jedrychowski W, Perera F, Maugeri U, Mrozek-Budzyn D, Miller RL, Flak E, Mroz E, Jacek R, Spengler JD. Effects of prenatal and perinatal exposure to fine air pollutants and maternal fish con- sumption on the occurrence of infantile eczema. Int Arch Allergy Immunol 2011;155:275-81.
28. Pénard-Morand C, Charpin D, Raherison C, Kopferschmitt C, Cail- laud D, Lavaud F, Annesi-Maesano I. Long-term exposure to back- ground air pollution related to respiratory and allergic health in schoolchildren. Clin Exp Allergy 2005;35:1279-87.
29. Song S, Lee K, Lee YM, Lee JH, Lee SI, Yu SD, Paek D. Acute health effects of urban fine and ultrafine particles on children with atopic dermatitis. Environ Res 2011;111:394-9.
30. Alghamdi MA, Shamy M, Redal MA, Khoder M, Awad AH, Else- rougy S. Microorganisms associated particulate matter: a prelimi- nary study. Sci Total Environ 2014;479-480:109-16.
31. Jenerowicz D, Silny W, Dańczak-Pazdrowska A, Polańska A, Osmola -Mańkowska A, Olek-Hrab K. Environmental factors and allergic diseases. Ann Agric Environ Med 2012;19:475-81.
32. Garrett MH, Hooper MA, Hooper BM, Rayment PR, Abramson MJ.
Increased risk of allergy in children due to formaldehyde exposure in homes. Allergy 1999;54:330-7.
33. Maruo YY, Yamada T, Nakamura J, Izumi K, Uchiyama M. Formalde- hyde measurements in residential indoor air using a developed sen- sor element in the Kanto area of Japan. Indoor Air 2010;20:486-93.
34. Hun DE, Corsi RL, Morandi MT, Siegel JA. Formaldehyde in resi- dences: long-term indoor concentrations and influencing factors.
Indoor Air 2010;20:196-203.
35. Shin SH, Jo WK. Longitudinal variations in indoor VOC concentra- tions after moving into new apartments and indoor source charac- terization. Environ Sci Pollut Res Int 2013;20:3696-707.
36. Weisse K, Lehmann I, Heroux D, Kohajda T, Herberth G, Röder S, von Bergen M, Borte M, Denburg J. The LINA cohort: indoor chemical exposure, circulating eosinophil/basophil (Eo/B) pro- genitors and early life skin manifestations. Clin Exp Allergy 2012;
42:1337-46.
37. Farrow A, Taylor H, Northstone K, Golding J. Symptoms of mothers and infants related to total volatile organic compounds in house- hold products. Arch Environ Health 2003;58:633-41.
38. Li WM, Lee SC, Chan LY. Indoor air quality at nine shopping malls in Hong Kong. Sci Total Environ 2001;273:27-40.
39. Yoshida T, Ogawa M, Goto H, Ohshita A, Kurose N, Yokosawa F, Hi- rata M, Endo Y. Clinical findings of the patients with sick building syndrome and the results of environmental measurement. Sangyo Eiseigaku Zasshi 2011;53:25-32.
40. Chuard C. Pet-associated infections. Rev Med Suisse 2009;5:1985- 90.
41. Chapman JA. Stachybotrys chartarum (chartarum = atra = alter- nans) and other problems caused by allergenic fungi. Allergy Asth- ma Proc 2003;24:1-7.