Clin Nutr Res 2016;5:112-125
http://dx.doi.org/10.7762/cnr.2016.5.2.112 pISSN 2287-3732 ∙ eISSN 2287-3740
This is an Open Access article distributed under the terms of the Creative Commons Attribution Non-Commercial License (http://creativecommons.org/licenses/by-nc/3.0/) which permits unrestricted non-commercial use, distribution, and reproduction in any medium, provided the original work is properly cited.
© 2016 The Korean Society of Clinical Nutrition
*Corresponding author Yoon Jung Yang
Address Department of Food and Nutrition, College of Natural Sci- ences, Dongduk Women’s University, 23-1 Wolgok-dong, Sungbuk- gu, Seoul 02748, Korea
Tel +82-2-940-4465 Fax +82-2-940-4193 E-mail [email protected]
Received April 12, 2016 Revised April 25, 2016 Accepted April 27, 2016
Comparison of Health Status and Nutrient Intake between Depressed Women and Non-depressed Women:
Based on the 2013 Korea National Health and Nutrition Examination Survey
Myeong Suk Won
1, Sunghee Kim
1, Yoon Jung Yang
1,2*
1Department of Clinical Nutrition, Dongduk Women’s University, Seoul 02748, Korea
2Department of Food and Nutrition, Dongduk Women’s University, Seoul 02748, Korea
This study aimed to provide supporting data for the management of dietary habits in depression by comparing health and nutrition in adult Korean women according to depression status. A total of 2,236 women aged between 19 and 64 years who participated in the 2013 Korea National Health and Nutrition Examination Survey were divided into a depression group (n = 315) and a non-depression group (n = 1,921). Among 19–29-year-old women, the depression group showed higher proportions of individuals with impairment of everyday activities, menopause, and suicidal thoughts than the non-depression group. The depression group showed lower intake of cereal, chocolate, meat, and carbonated drinks, as well as a lower index of nutritional quality (INQ) for protein, iron, and niacin. Among 30–49-year-old women, the depression group showed higher proportions of individuals with impairment of everyday activities, chronic disease, stress, and suicidal thoughts. The depression group showed lower intake of rice with mixed grains and higher intake of instant and cup noodles than the non-depression group. Among 50–64-year-old women, the depression group showed higher proportions of individuals with impairment of everyday activities, menopause, stress, and suicidal thoughts. The depression group showed lower intake of vegetables, mushrooms, and seaweed, lower nutritional intake of fat, saturated fat, and n-3 fatty acids, as well as a lower INQ for niacin and a lower Recommended Food Score. For all age groups, individuals with depression showed poorer health and nutritional intake than healthy individuals, demonstrating a correlation of depression with health and nutritional intake.
KeyWords: Depressed women, Health status, Nutrient intake
Introduction
Depression occurs throughout modern society, differs be- tween individuals, and displays a complex pattern of physical, genetic, and socioeconomic factors [1-3]. Depression presents with emotional symptoms such as sadness, frustration, empti- ness, despair, guilt, and lethargy, as well as with motivational symptoms, such as loss of interest, loss of appetite, and apa- thy. The disease can also be associated with behavioral issues such as a decline in interpersonal relations and social life, inde- cisiveness, and procrastination, and with cognitive symptoms such as impaired memory, judgment, and thinking, attention difficulties, and impaired task performance; in extreme cases,
it can even lead to suicide [4].
In a 2013 analysis of depression by the Health Insurance Re- view Agency (HIRA), using assessment data for health insur- ance and medical aid from 2009 to 2013, the number of pa- tients receiving treatment increased by approximately 109,000 (19.6%) over 5 years, with an average annual increase of 4.6%, while the total treatment costs increased by 57.9 billion KRW (27.1%), equivalent to an average annual increase of 6.2%. In terms of sex, the annual number of female patients receiving treatment was approximately 2.2-fold higher than the number of male patients [5]. The prevalence of depression in Korean adults is 10.2%, but the rate is 6.6% for men and 13.7% for women, meaning that depression is approximately twice as common in women [6]. Reasons for the higher prevalence of depression in women include cyclic hormonal changes related to menstruation, childbirth, and menopause, in addition to the dual burden of marriage and child-rearing, abuse, low social achievement, genetic factors, and the characteristics of the female gender role [1]. Based on data from the US National Health and Nutrition Examination Survey from 2005–2008, the prevalence of depressive symptoms in adults was 22%, and 0.6% of these were reported to have severe depression [7].
Depression is a chronic, recurring disease that affects more women than men, and approximately 20% of women in the United States experience depression at some point in their lives [8]. By 2020, depression is predicted to be the second most prevalent disease worldwide, after cardiac disease [9].
The severity of depression differs with health, with bet- ter health associated with lower severity of depression [10].
Depressed women have more health problems and physical symptoms than women who are not depressed, and depres- sive tendencies are associated with a more negative percep- tion of one’s own health [11]. Moreover, a study found that a group of individuals with experience of disease within the last year had a higher severity of depression than the group with no disease in the last year [12].
Depression can be related to nutritional deficiencies, and di- etary factors have been reported as risk factors for depression and cognitive impairment [13,14]. Depression can be relieved through consumption of a natural, vegan diet with plenty of brown rice, mixed grains, whole grains, beans, raw vegetables, fruit, seeds, and nuts [15]. In addition, depressive symptoms were reported to improve when processed foods and caffeine- containing foods were restricted for three weeks in depressed patients [16]. In a study from Europe, high consumption of fish was associated with a lower risk of depression, but this
association was not present for Asia, North America, South America, or Oceania [17]. Meanwhile, among the psychological functions of carbohydrates, fatty acids, cholesterol, and folic acid, effects on depression have been reported, in particular [18-21], and good quality proteins, vitamins, and minerals have been reported to have a protective effect against depres- sion [22,23]. Depression could be also relieved through the consumption of sufficient vitamin B1, vitamin B6, vitamin B12, niacin, pantothenic acid, biotin, choline, calcium, phosphorus, magnesium, potassium, sodium, iodine, and copper, which are nutrients that participate in neural and mental activity [15].
As reflected by the above studies, there have been a large number of studies on dietary habits and dietary factors in depression. Nevertheless, there is still a significant lack of research regarding the correlations of depression with health and nutrition in adult Korean women. Therefore, the current study used data from the Korea National Health and Nutrition Examination Survey (KNHANES), which is able to reflect the characteristics of adult Korean women, to examine two hy- potheses: first, that depressed individuals would show poorer physical and mental health than non-depressed individuals;
second, that depressed individuals would show poorer nutri- tional intake than non-depressed individuals. By comparing health and nutritional intake according to the presence or ab- sence of depression for adult Korean women of different age groups, this study aimed to provide supporting data to assist in dietary management in depression.
Material and Methods
Data and subjects
This study used data from the first year of the KNHANES VI (2013), which was performed by the Korean Centers for Disease Control and Prevention (CDC) [24]. A total of 8,018 subjects participated in at least one survey out of the health survey, the medical examination, and the nutrition survey, and of these, 2,666 were adult women aged 19–64 years. Among these, 26 pregnant women, 43 breastfeeding women, six women who did not respond to the diet questionnaire, and 112 women currently undergoing dietary therapy for medical pur- poses were excluded, leaving a total of 2,479 subjects initially included in the study. We used KNHANES database available to the public and approved by the Institutional Review Board (IRB) of the KCDC.
Research methods
Criteria for the depression group
The criteria for dividing the subjects into the depression group and the non-depression group were as follows: from among the 50 people who responded “Yes” to the question of
“Do you currently have depression?” on the health question- naire and the 293 people who responded “Yes” to the question of “Have you felt such sadness or despair that it impaired your daily activities for at least two weeks in the last year?” the 315 subjects (12.7%) who responded “Yes” to both questions were included in the depression group. Excluding these subjects and the 243 subjects (9.8%) who did not respond to the above questions, the remaining 1,921 subjects (77.5%) were classi- fied as the non-depression group, meaning that there were a total of 2,236 subjects in the two groups combined. Subjects were divided into age groups of 19–29 years, 30–49 years, and 50–64 years, in accordance with the Korea Nutrition Society’s Dietary Reference Intakes for Koreans [25]. The depression group included 45 subjects (14.3%) aged 19–29 years, 119 sub- jects (37.8%) aged 30–49 years, and 151 subjects (47.9%) aged 50–64 years, while the non-depression group included 322 subjects (16.8%) aged 19–29 years, 958 subjects (49.9%) aged 30–49 years, and 641 subjects (33.4%) aged 50–64 years.
Sociodemographic characteristics General characteristics
In terms of general characteristics, height, weight, waist circumference, and body mass index (BMI) were obtained from the health examination survey, and sex, age, education level, annual frequency of alcohol consumption, current smoking status, and moderate physical activity were obtained from the health survey. For waist circumference cutoff values, 85 cm and 90 cm were used for women and men, respectively, in accordance with the Korean Society for the Study of Obesity (KOSSO) criteria for abdominal obesity [6,26].
Social characteristics
In terms of social characteristics, area of residence, eco- nomic activities, income level, and marital status were ob- tained from the health survey. Income level was classified by quartiles (by individuals) into “Low”, “Lower middle”, “Upper middle”, and “High”.
Health status
Obesity and body weight control
Obesity status was obtained from the health examination
survey, and body weight control in the last year was obtained from the health survey. Obesity status was classified into
“Underweight”, “Normal”, and “Obese”, where BMI < 18.5 kg/m2 is underweight, 18.5–24.9 kg/m2 is normal, and ≥ 25 kg/m2 is obese [6,26].
Current state of health
Daily activities, subjective health, menopausal status, and at least one diagnosis of a chronic disease (hypertension, hy- perlipidemia, stroke, myocardial infarction, angina, diabetes, cancer) by a doctor were obtained from the health survey.
Mental health
Average daily sleep duration, usual perceived stress, and sui- cidal thoughts in the last year were obtained from the health survey.
Nutritional intake Food intake
Within the nutrition survey, this study used the average intake frequency and the average intake per serving in the last year for 112 types of food from the food intake frequency survey. Daily intake frequency was calculated using the me- dian of intake frequency responses, and intake per serving was converted to a ratio relative to the recommended daily intake amounts. Finally, daily intake frequency and intake per serving were used to obtain the servings/day.
The 112 food items were reclassified into the following 29 categories: white rice, rice and mixed grains, other rice, noodles, instant noodles/cup noodles, rice cakes, bread, pizza/
hamburger/sandwich, cereal, snacks, chocolate, starchy root vegetables, sugars, beans, nuts, vegetables/mushrooms/sea- weed, kimchi, fruit, meat, processed meat, eggs, fish and shell- fish, processed fish and shellfish, milk and dairy, oils, coffee, carbonated drinks, tea, and alcohol.
Nutrient intake
Daily food intake data had been collected by the 24-hour dietary recall method. Average daily nutrient intake was ob- tained for the 21 nutrients.
Index of nutritional quality (INQ)
The food intake data used were collected by the 24-hour di- etary recall method, as part of the nutrition survey. The INQ is an index that has been corrected for energy intake and evalu- ates whether an individual is consuming the recommended
amount of individual nutrients. It is represented by the ratio of nutrient intake per 1,000 kcal to recommended nutrient intake per 1,000 kcal. Hence, for meals with an INQ greater than 1.0 for a particular nutrient, intake of this nutrient is high relative to energy intake, and so, the quality of that meal is considered high. Meanwhile, if a meal has an INQ of less than 1.0, this means that the nutrient intake is low relative to energy intake and so the quality of that meal is considered to be low [27]. As with the nutrient adequacy ratio (NAR), this was calculated for nine nutrients.
INQ = nutrient intake per 1,000 kcal / recommended nutri- ent intake per 1,000 kcal
Recommended Food Score (RFS)
The daily number of meals and the average intake frequency over the last year for 112 types of food were obtained from the food intake frequency survey, as part of the nutrition sur- vey. The RFS is a method for evaluating the quality of meals, developed by Kant et al. [28] Based on the weekly intake frequency of healthy foods such as mixed grains, fruit, veg- etables, lean meat, and low-fat dairy products, 1 point is given for foods consumed at least once per week, and 0 points are given for foods consumed less than once per week. In South Korea, Kim et al. [29] calculated the RFS using Korean foods to suit the domestic dietary environment, using categories of grains, beans, vegetables, seaweed, fruits, seafood, dairy, and nuts [30]. In the current study, the method of Kim et al. [29,30]
was used with a few changes.
In this study, a total of 43 items were analyzed: the daily number of meals eaten, plus 42 types of food. One point was given if all three meals were eaten each day, and for the remaining food categories, 1 point was given if the intake fre- quency was at least once per week, and 0 points were given if the intake frequency was less than once per week, meaning that the maximum possible score was 43 points. Food catego- ries were classified as grains (1 item), beans (6), vegetables (10), seaweed (4), fruits (11), seafood (6), dairy (3), and nuts (1).
Statistical processing
SAS program (version 9.3, SAS Institute Inc., Cary, NC, USA) was used for statistical analysis of all data, applying the proc survey procedure such as proc surveyreg. Data analysis for the KNHANES utilized stratification variables and cluster variables.
The t-test and Chi-square test were used to analyze differ- ences in general characteristics, social characteristics, obesity, body weight control, health, and mental health according to
depression status, as well as for the comparative analysis of nutrition intake assessment according to nutrient intake and food intake. The statistical significance level was p < 0.05.
Results
Sociodemographic characteristics General characteristics
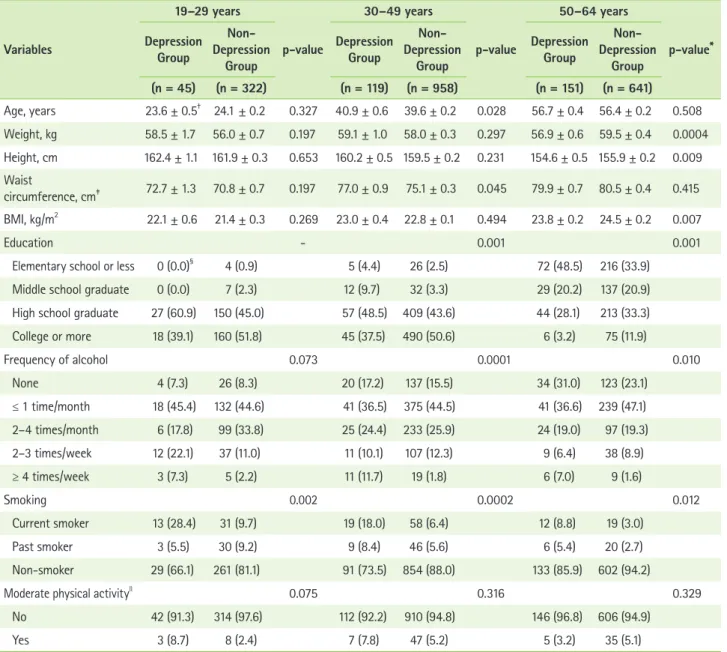
Table 1 displays the general characteristics for the depres- sion group and the non-depression group in this study. The average ages in the depression group and the non-depression group, respectively, were 23.6 ± 0.5 and 24.1 ± 0.2 years for the 19–29 age group, 40.9 ± 0.6 and 39.6 ± 0.2 years for the 30–49 age group, and 56.7 ± 0.4 and 56.4 ± 0.2 years for the 50–64 age group. Body weight, height, and BMI were lower for the depression group than the non-depression group in the 50–64 age group (p < 0.0004, p < 0.009, p < 0.007), and waist circumference was significantly higher for the depres- sion group in the 30–49 age group (p < 0.045). In terms of education, the proportion of middle school graduates or lower in the 30–49 and 50–64 age groups (p < 0.001, p < 0.001) was higher for the depression group, while the proportion of college graduates or higher was significantly higher in the non-depression group. In terms of alcohol consumption, the depression group featured a higher number of individuals in the 30–49 and 50–64 age groups (p < 0.0001, p < 0.010) who drank at least four times per week, while the proportion of non-drinkers in the non-depression group was significantly higher. In terms of smoking, the proportion of current smokers was higher in the depression group for the 19–29, 30–49, and 50–64 age groups (p = 0.002, p = 0.0002, p = 0.012), while the proportion of never smokers was significantly lower in the depression group.
Social characteristics
Table 2 displays the social characteristics for the depression group and the non-depression group in this study. The propor- tion of subjects living in rural areas was higher in the depres- sion group for the 19–29 and 50–64 age groups (p = 0.007, p
= 0.033). In terms of economic activity, the proportion of un- employed and economically inactive subjects was significantly higher in the depression group for the 19–29 age group (p = 0.003). The depression group showed a higher proportion of low income than the non-depression group in the 30–49 age group (p = 0.003), while the proportion of upper middle and high in- come was significantly lower in the depression group. In terms
of marital status, the depression group showed a significantly higher proportion of separated/bereaved/divorced subjects in the 30–49 and 50–64 age groups (p < 0.0001, p = 0.050).
Health
Obesity and body weight control
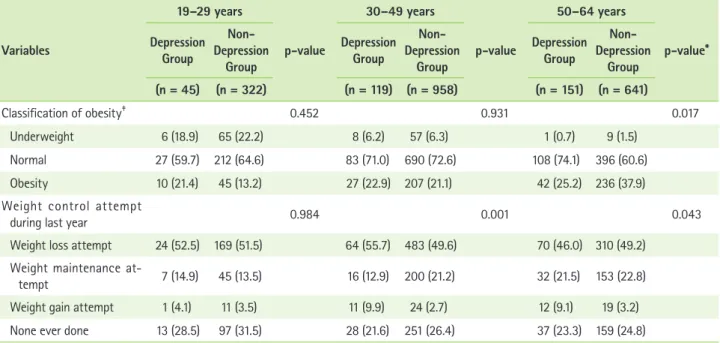
Table 3 displays the results for obesity and body weight control in the depression group and the non-depression group in this study. The depression group showed a lower proportion of underweight and obese subjects than the non-depression
group in the 50–64 age group (p = 0.017), and showed a higher proportion of subjects with normal BMI. The proportion of subjects who had attempted to lose weight or gain weight in the last year was higher in the depression group for the 30–49 age group (p = 0.001), while the proportion of subjects who had attempted to maintain their weight or who had never attempted body weight control was lower in the depression group. The depression group showed a lower proportion of subjects who had attempted to lose weight, maintain body weight, or had never attempted body weight control for the Table 1. General characteristics between depression group and non-depression group
Variables
19–29 years
p-value
30–49 years
p-value
50–64 years
p-value*
Depression Group
Depression Non- Group
Depression Group
Depression Non- Group
Depression Group
Depression Non- Group (n = 45) (n = 322) (n = 119) (n = 958) (n = 151) (n = 641) Age, years 23.6 ± 0.5† 24.1 ± 0.2 0.327 40.9 ± 0.6 39.6 ± 0.2 0.028 56.7 ± 0.4 56.4 ± 0.2 0.508 Weight, kg 58.5 ± 1.7 56.0 ± 0.7 0.197 59.1 ± 1.0 58.0 ± 0.3 0.297 56.9 ± 0.6 59.5 ± 0.4 0.0004 Height, cm 162.4 ± 1.1 161.9 ± 0.3 0.653 160.2 ± 0.5 159.5 ± 0.2 0.231 154.6 ± 0.5 155.9 ± 0.2 0.009 Waist
circumference, cm‡ 72.7 ± 1.3 70.8 ± 0.7 0.197 77.0 ± 0.9 75.1 ± 0.3 0.045 79.9 ± 0.7 80.5 ± 0.4 0.415 BMI, kg/m2 22.1 ± 0.6 21.4 ± 0.3 0.269 23.0 ± 0.4 22.8 ± 0.1 0.494 23.8 ± 0.2 24.5 ± 0.2 0.007
Education - 0.001 0.001
Elementary school or less 0 (0.0)§ 4 (0.9) 5 (4.4) 26 (2.5) 72 (48.5) 216 (33.9)
Middle school graduate 0 (0.0) 7 (2.3) 12 (9.7) 32 (3.3) 29 (20.2) 137 (20.9)
High school graduate 27 (60.9) 150 (45.0) 57 (48.5) 409 (43.6) 44 (28.1) 213 (33.3)
College or more 18 (39.1) 160 (51.8) 45 (37.5) 490 (50.6) 6 (3.2) 75 (11.9)
Frequency of alcohol 0.073 0.0001 0.010
None 4 (7.3) 26 (8.3) 20 (17.2) 137 (15.5) 34 (31.0) 123 (23.1)
≤ 1 time/month 18 (45.4) 132 (44.6) 41 (36.5) 375 (44.5) 41 (36.6) 239 (47.1)
2–4 times/month 6 (17.8) 99 (33.8) 25 (24.4) 233 (25.9) 24 (19.0) 97 (19.3)
2–3 times/week 12 (22.1) 37 (11.0) 11 (10.1) 107 (12.3) 9 (6.4) 38 (8.9)
≥ 4 times/week 3 (7.3) 5 (2.2) 11 (11.7) 19 (1.8) 6 (7.0) 9 (1.6)
Smoking 0.002 0.0002 0.012
Current smoker 13 (28.4) 31 (9.7) 19 (18.0) 58 (6.4) 12 (8.8) 19 (3.0)
Past smoker 3 (5.5) 30 (9.2) 9 (8.4) 46 (5.6) 6 (5.4) 20 (2.7)
Non-smoker 29 (66.1) 261 (81.1) 91 (73.5) 854 (88.0) 133 (85.9) 602 (94.2)
Moderate physical activityll 0.075 0.316 0.329
No 42 (91.3) 314 (97.6) 112 (92.2) 910 (94.8) 146 (96.8) 606 (94.9)
Yes 3 (8.7) 8 (2.4) 7 (7.8) 47 (5.2) 5 (3.2) 35 (5.1)
BMI: body mass index.
*p-values for continuous variables by t-test, for categorical variables by Chi-square test; †Mean ± SD (standard deviation); ‡Waist circumference criteria: ≥ 85 cm (women), ≥ 90 cm (men): Korean Society for the Study of Obesity; §n (%); llModerate physical activity: ≥ half-hour/1 time, ≥ 5 days/week.
Table 2. Socioeconomic characteristics between depression group and non-depression group
Variables
19–29 years
p-value
30–49 years
p-value
50–64 years
p-value*
Depression Group
Depression Non- Group
Depression Group
Depression Non- Group
Depression Group
Depression Non- Group (n = 45) (n = 322) (n = 119) (n = 958) (n = 151) (n = 641)
Residence 0.007 0.738 0.033
City 35 (76.5)† 289 (89.8) 100 (84.2) 801 (83.1) 110 (72.2) 520 (80.8)
Rural area 10 (23.5) 33 (10.2) 19 (15.8) 157 (16.9) 41 (27.8) 121 (19.2)
Economic activity state 0.003 0.899 0.743
Yes 18 (37.1) 205 (63.7) 65 (56.1) 554 (55.4) 79 (52.2) 340 (53.7)
No 27 (62.9) 117 (36.3) 54 (43.9) 404 (44.6) 72 (47.8) 301 (46.3)
Incomes (quartile) 0.596 0.003 0.079
Low 12 (26.2) 79 (24.8) 43 (37.6) 215 (23.2) 47 (31.2) 137 (22.2)
Mid-low 9 (22.1) 85 (25.6) 30 (24.9) 236 (25.3) 37 (23.4) 163 (25.8)
Mid-high 7 (17.4) 81 (24.5) 27 (22.2) 249 (26.3) 35 (25.6) 161 (24.9)
High 16 (34.3) 77 (25.1) 19 (15.3) 252 (25.3) 32 (19.8) 178 (27.2)
Marital status 0.609 < 0.0001 0.050
Currently married 10 (19.9) 55 (16.8) 90 (75.8) 825 (86.9) 109 (73.1) 532 (82.5) Separation, bereavement,
divorce 0 (0.0) 0 (0.0) 19 (17.6) 49 (4.6) 41 (26.0) 101 (16.5)
Never married 35 (80.1) 265 (83.2) 10 (6.6) 80 (8.5) 1 (0.9) 7 (1.0)
*p-values by Chi-square test; †n (%).
Table 3. Obesity status and weight control attempt between depression group and non-depression group
Variables
19–29 years
p-value
30–49 years
p-value
50–64 years
p-value*
Depression Group
Non- Depression
Group
Depression Group
Non- Depression
Group
Depression Group
Non- Depression
Group (n = 45) (n = 322) (n = 119) (n = 958) (n = 151) (n = 641)
Classification of obesity‡ 0.452 0.931 0.017
Underweight 6 (18.9) 65 (22.2) 8 (6.2) 57 (6.3) 1 (0.7) 9 (1.5)
Normal 27 (59.7) 212 (64.6) 83 (71.0) 690 (72.6) 108 (74.1) 396 (60.6)
Obesity 10 (21.4) 45 (13.2) 27 (22.9) 207 (21.1) 42 (25.2) 236 (37.9)
Weight control attempt
during last year 0.984 0.001 0.043
Weight loss attempt 24 (52.5) 169 (51.5) 64 (55.7) 483 (49.6) 70 (46.0) 310 (49.2) Weight maintenance at-
tempt 7 (14.9) 45 (13.5) 16 (12.9) 200 (21.2) 32 (21.5) 153 (22.8)
Weight gain attempt 1 (4.1) 11 (3.5) 11 (9.9) 24 (2.7) 12 (9.1) 19 (3.2)
None ever done 13 (28.5) 97 (31.5) 28 (21.6) 251 (26.4) 37 (23.3) 159 (24.8)
*p-values by Chi-square test; †n (%); ‡Obesity criteria: Underweight BMI < 18.5 kg/m2, Normal BMI ≥ 18.5 kg/m2~< 24.9 kg/m2, Obesity BMI ≥ 25 kg/m2: Korean Society for the Study of Obesity.
50–64 age group (p = 0.043), while the proportion of subjects who had attempted to gain weight was significantly higher for the depression group than the non-depression group.
Current health
Table 4 displays the current state of health for the depres- sion group and the non-depression group in this study. The proportion of subjects with impairment of daily activities was significantly higher in the depression group for the 19–29, 30–49, and 50–64 age groups (p = 0.0004, p < 0.0001, p <
0.0001), while the proportion of subjects with “bad” or “very bad” subjective health was significantly higher in the depres- sion group for the 30–49 and 50–64 age groups (p < 0.0001, p < 0.001). The proportion of subjects who had undergone menopause was significantly higher for the depression group in the 19–29 and 50–64 age groups (p = 0.030, p = 0.027), while the depression group also showed a significantly higher proportion of subjects in the 30–49 age group (p = 0.0003) who currently had at least one chronic disease.
Mental health
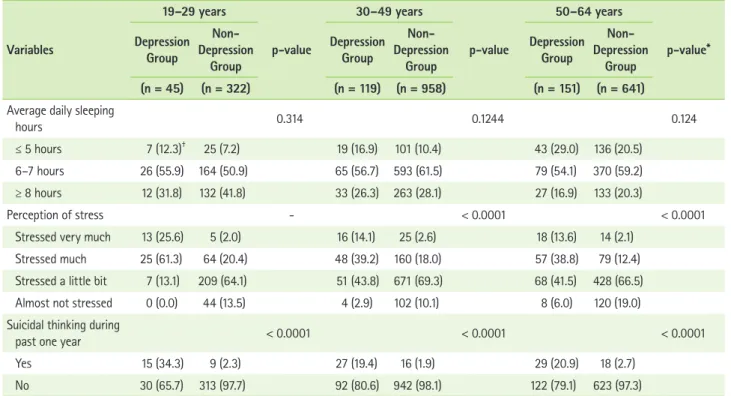
Table 5 displays the mental health results for the depression
group and the non-depression group in this study. In terms of perceived stress, the depression group showed a significantly higher proportion of subjects reporting “a lot of stress” or
“quite a lot of stress” for the 30–49 and 50–64 age groups (p < 0.0001, p < 0.0001). The proportion of subjects who re- ported suicidal thoughts within the last year was significantly higher in the depression group than the non-depression group for the 19–29, 30–49, and 50–64 age groups (p < 0.0001, p <
0.0001, p < 0.0001).
Nutritional intake Food intake
Table 6 shows the food intake amounts for the depression group and the non-depression group in this study. For the 19–
29 age group, the depression group showed significantly lower intake of cereal (p = 0.008), chocolate (p = 0.029), meat (p = 0.048), and carbonated drinks (p = 0.022). For the 30–49 age group, the depression group showed significantly lower intake (in servings/day) of rice with mixed grains (p = 0.002), and significantly higher intake of instant noodles and cup noodles (p = 0.004). For the 50–64 age group, the depression group showed significantly lower intake of vegetables, mushrooms,
Table 4. Physical health status between depression group and non-depression group
Variables
19–29 years
p-value
30–49 years
p-value
50–64 years
p-value*
Depression Group
Non- Depression
Group
Depression Group
Non- Depression
Group
Depression Group
Non- Depression
Group (n = 45) (n = 322) (n = 119) (n = 958) (n = 151) (n = 641)
Daily activity 0.0004 < 0.0001 < 0.0001
No problem 42 (91.4)† 319 (99.2) 104 (86.5) 934 (96.8) 117 (77.3) 584 (91.7)
Having problem 3 (8.6) 3 (0.8) 15 (13.5) 24 (3.2) 34 (22.7) 57 (8.3)
Subjective health status 0.220 < 0.0001 0.0003
Good, Very good 17 (44.3) 135 (43.0) 24 (19.0) 376 (37.7) 22 (13.8) 165 (25.8)
Normal 20 (39.7) 164 (49.1) 61 (50.3) 483 (51.4) 74 (50.8) 350 (54.7)
Poor, Very poor 8 (16.0) 23 (7.8) 34 (30.6) 99 (10.8) 55 (35.4) 125 (19.5)
Menopausal status† 0.030 0.315 0.027
Yes 2 (3.5) 3 (0.8) 11 (9.4) 59 (6.5) 136 (91.8) 555 (85.3)
No 43 (96.5) 319 (99.2) 108 (90.6) 899 (93.5) 15 (8.2) 86 (14.7)
Diagnosis of one or more
chronic diseases†‡ - 0.0003 0.340
Yes 0 (0.0) 2 (0.4) 18 (19.3) 73 (7.4) 64 (45.8) 268 (40.7)
No 45 (100.0) 320 (99.6) 101 (80.7) 885 (92.6) 87 (54.2) 373 (59.3)
*p-values by Chi-square test; †n (%); ‡Chronic disease: hypertension, hyperlipidemia, stroke, cardiac infarction, angina, diabetes mellitus, cancer.
and seaweed (p = 0.045).
Nutrient intake
Table 7 shows the nutrient intake for the depression group and the non-depression group in this study. Compared to the non-depression group, the depression group showed signifi- cantly lower intake of fat (p = 0.045), saturated fat (p = 0.013), and n-3 fatty acids (p = 0.033) for the 50–64 age group.
INQ and RFS
Table 8 displays the INQ and RFS for the depression group and the non-depression group in this study. In the 19–29 age group, the INQ for protein was significantly lower in the de- pression group than the non-depression group (p = 0.017), but since it was higher than 1.0, there was no problem with the quality of meals. Similarly, the INQ for iron was significantly lower in the depression group for the 19–29 age group (p = 0.038), but the value was higher than 1.0, and so there was no problem with the quality of meals. The INQ for niacin was significant lower in the depression group for the 19–29 and 50–64 age groups (p = 0.003, p = 0.045), but there were no problems with meals for either of these groups. The INQ for calcium was below 1.0 in both the depression and the non-
depression group for all age groups, and the INQ for vitamin C was below 1.0 in both the depression and the non-depression group for the 19–29 age group, indicating a low quality of meals for these two nutrients. In the 50–64 age group, the RFS of 13.75 ± 0.63 for the depression group was significantly lower than the score of 15.23 ± 0.39 for the non-depression group (p < 0.045).
Discussion
The current study aimed to investigate the association of depression with health and dietary habits in different age groups of adult Korean women, by comparing health and nutrition intake in a depression group and a non-depression group.
In the 50–64 age group, the proportion of underweight and obese subjects was lower in the depression group than in the non-depression group, while the proportion of individuals with normal BMI was significantly higher. A study of 50–89-year- old women in the United States reported that there was no correlation between obesity and the risk of depression [31].
However, in a study of targets for adult disease screening, obese women with a BMI of at least 27 kg/m2 were reported Table 5. Mental health status between depression group and non-depression group
Variables
19–29 years
p-value
30–49 years
p-value
50–64 years
p-value*
Depression Group
Non- Depression
Group
Depression Group
Non- Depression
Group
Depression Group
Non- Depression
Group (n = 45) (n = 322) (n = 119) (n = 958) (n = 151) (n = 641) Average daily sleeping
hours 0.314 0.1244 0.124
≤ 5 hours 7 (12.3)† 25 (7.2) 19 (16.9) 101 (10.4) 43 (29.0) 136 (20.5)
6–7 hours 26 (55.9) 164 (50.9) 65 (56.7) 593 (61.5) 79 (54.1) 370 (59.2)
≥ 8 hours 12 (31.8) 132 (41.8) 33 (26.3) 263 (28.1) 27 (16.9) 133 (20.3)
Perception of stress - < 0.0001 < 0.0001
Stressed very much 13 (25.6) 5 (2.0) 16 (14.1) 25 (2.6) 18 (13.6) 14 (2.1)
Stressed much 25 (61.3) 64 (20.4) 48 (39.2) 160 (18.0) 57 (38.8) 79 (12.4)
Stressed a little bit 7 (13.1) 209 (64.1) 51 (43.8) 671 (69.3) 68 (41.5) 428 (66.5)
Almost not stressed 0 (0.0) 44 (13.5) 4 (2.9) 102 (10.1) 8 (6.0) 120 (19.0)
Suicidal thinking during
past one year < 0.0001 < 0.0001 < 0.0001
Yes 15 (34.3) 9 (2.3) 27 (19.4) 16 (1.9) 29 (20.9) 18 (2.7)
No 30 (65.7) 313 (97.7) 92 (80.6) 942 (98.1) 122 (79.1) 623 (97.3)
*p-values by Chi-square test; †n (%).
to have strong depressive tendencies [32], and there have been several recent studies supporting a positive correlation between depression and obesity [33]. Therefore, it is thought
that the relationship between depression and obesity will re- quire additional study in the future.
The proportion of subjects with impairment of daily activi- Table 6. Food groups intake between depression group and non-depression group
Variables (Serving/day)
19–29 years
p-value
30–49 years
p-value
50–64 years
p-value*
Depression Group
Depression Non- Group
Depression Group
Depression Non- Group
Depression Group
Depression Non- Group (n = 45) (n = 322) (n = 119) (n = 958) (n = 151) (n = 641)
White rice 0.70 ± 0.18† 0.74 ± 0.04 0.844 0.81 ± 0.08 0.65 ± 0.03 0.079 0.51 ± 0.09 0.49 ± 0.04 0.886 Rice with mixed grains 0.87 ± 0.12 0.78 ± 0.04 0.484 0.90 ± 0.09 1.22 ± 0.04 0.002 1.52 ± 0.11 1.59 ± 0.05 0.526 Other rice 0.28 ± 0.05 0.23 ± 0.01 0.349 0.24 ± 0.03 0.19 ± 0.01 0.108 0.08 ± 0.01 0.09 ± 0.01 0.398 Noodles 0.20 ± 0.04 0.24 ± 0.02 0.285 0.21 ± 0.02 0.17 ± 0.01 0.195 0.13 ± 0.02 0.12 ± 0.01 0.933 Instant and cup noodles 0.26 ± 0.05 0.19 ± 0.01 0.167 0.19 ± 0.02 0.13 ± 0.01 0.004 0.04 ± 0.01 0.05 ± 0.00 0.133 Rice cakes 0.12 ± 0.03 0.15 ± 0.01 0.282 0.12 ± 0.01 0.12 ± 0.01 0.830 0.08 ± 0.01 0.09 ± 0.01 0.633 Bread products 0.16 ± 0.04 0.16 ± 0.02 0.994 0.14 ± 0.02 0.16 ± 0.01 0.561 0.08 ± 0.02 0.09 ± 0.01 0.737 Pizza, hamburger,
sandwich 0.15 ± 0.03 0.12 ± 0.01 0.405 0.06 ± 0.01 0.06 ± 0.00 0.372 0.02 ± 0.01 0.02 ± 0.00 0.719 Cereals 0.04 ± 0.02 0.11 ± 0.02 0.008 0.05 ± 0.02 0.04 ± 0.00 0.600 0.01 ± 0.01 0.02 ± 0.00 0.169 Snacks 0.45 ± 0.10 0.38 ± 0.03 0.536 0.19 ± 0.03 0.24 ± 0.01 0.161 0.06 ± 0.01 0.07 ± 0.01 0.398 Chocolate 0.15 ± 0.04 0.25 ± 0.03 0.029 0.07 ± 0.01 0.07 ± 0.01 0.695 0.03 ± 0.01 0.05 ± 0.01 0.083 Starchy root vegetables 0.27 ± 0.07 0.22 ± 0.02 0.429 0.32 ± 0.03 0.29 ± 0.01 0.302 0.37 ± 0.05 0.35 ± 0.02 0.703 Sugars and sweets 0.45 ± 0.17 0.31 ± 0.04 0.447 0.56 ± 0.06 0.63 ± 0.02 0.317 0.51 ± 0.07 0.52 ± 0.03 0.884 Beans and their products 0.68 ± 0.13 0.70 ± 0.05 0.869 0.93 ± 0.07 0.89 ± 0.03 0.534 1.02 ± 0.07 0.99 ± 0.04 0.801 Nuts and seeds 0.09 ± 0.03 0.13 ± 0.02 0.325 0.19 ± 0.03 0.16 ± 0.02 0.287 0.22 ± 0.04 0.20 ± 0.02 0.798 Vegetables, mushrooms,
seaweeds 2.21 ± 0.35 2.14 ± 0.10 0.848 3.08 ± 0.20 2.89 ± 0.07 0.373 2.65 ± 0.17 3.04 ± 0.10 0.045 Kimchi group 1.93 ± 0.34 1.92 ± 0.12 0.964 2.40 ± 0.19 2.77 ± 0.08 0.059 3.03 ± 0.23 2.98 ± 0.11 0.816 Fruits 2.51 ± 0.45 2.00 ± 0.15 0.287 2.05 ± 0.18 1.67 ± 0.07 0.060 1.86 ± 0.24 1.99 ± 0.13 0.632 Meats 0.53 ± 0.06 0.68 ± 0.04 0.048 0.61 ± 0.06 0.49 ± 0.02 0.082 0.29 ± 0.03 0.31 ± 0.02 0.645 Meat processed products 0.19 ± 0.04 0.25 ± 0.02 0.231 0.23 ± 0.05 0.15 ± 0.01 0.139 0.03 ± 0.01 0.03 ± 0.00 0.912 Eggs 0.74 ± 0.17 0.52 ± 0.04 0.213 0.55 ± 0.04 0.50 ± 0.02 0.288 0.33 ± 0.04 0.32 ± 0.02 0.791 Fishes and shellfish 0.58 ± 0.12 0.49 ± 0.04 0.454 0.77 ± 0.09 0.70 ± 0.03 0.467 0.79 ± 0.09 0.90 ± 0.05 0.319 Fish and shellfish
processed products 0.10 ± 0.03 0.09 ± 0.01 0.787 0.17 ± 0.04 0.10 ± 0.01 0.116 0.06 ± 0.01 0.08 ± 0.02 0.330 Milk and dairy products 1.04 ± 0.17 1.11 ± 0.06 0.690 0.80 ± 0.09 0.80 ± 0.03 0.962 0.87 ± 0.12 0.79 ± 0.04 0.558 Fat and oils 0.44 ± 0.17 0.30 ± 0.04 0.410 0.47 ± 0.06 0.54 ± 0.02 0.339 0.37 ± 0.05 0.42 ± 0.03 0.411 Coffee 1.02 ± 0.24 0.85 ± 0.07 0.472 0.96 ± 0.11 1.06 ± 0.04 0.426 0.65 ± 0.09 0.74 ± 0.03 0.389 Carbonated drinks 0.16 ± 0.04 0.27 ± 0.02 0.022 0.13 ± 0.04 0.08 ± 0.01 0.175 0.03 ± 0.01 0.03 ± 0.01 0.725 Teas 0.30 ± 0.12 0.23 ± 0.03 0.541 0.18 ± 0.04 0.18 ± 0.02 0.999 0.22 ± 0.04 0.21 ± 0.03 0.906 Ethanol 1.44 ± 0.52 0.71 ± 0.08 0.158 1.45 ± 0.51 0.67 ± 0.05 0.136 0.42 ± 0.26 0.25 ± 0.05 0.524
*p-values by t-test; †Mean ± S.D.
ties was significantly higher in the depression group for all age groups. One previous study of adult women with disability re- ported an association between depression and disability grade, multiple disabilities, and health status [34], while an analysis of the pathway between physical function and depression in pa- tients in a geriatric ward in Pittsburgh, in the US, reported an effect of physical function on depression. Higher rates of de- pression have been reported in patients with overall restriction of activity, as well as restricted activity due to cardiac disease, stroke, hypertension, fracture or joint injury, arthritis or rheu- matism, respiratory disease, visual disability, or disability of the
neck [35]. These results are broadly consistent with the results of our study.
For the 30–49 and 50–64 age groups, subjective health was worse in the women in the depression group than in the women in the non-depression group. A previous study in middle-aged women also reported that better health was associated with milder depression severity, and that severity of depression increased with poorer self-perception of physi- cal condition [36]. Another study on the relationship between depression and subjective health perception reported that milder depression sensitivity was associated with better self- Table 7. Mean daily nutrient intake between depression group and non-depression group
Variables
19–29 years
p-value
30–49 years
p-value
50–64 years
p-value*
Depression Group
Depression Non- Group
Depression Group
Depression Non- Group
Depression Group
Depression Non- Group
(n = 35) (n = 274) (n = 110) (n = 898) (n = 134) (n = 587)
Energy, kcal 2098.2 ± 211.2† 1864.4 ± 64.9 0.279 1757.2 ± 86.8 1809.9 ± 28.1 0.555 1765.7 ± 78.7 1768.8 ± 29.6 0.970 Protein, g 69.3 ± 7.8 68.0 ± 2.7 0.877 61.1 ± 4.9 64.4 ± 1.3 0.503 60.7 ± 4.1 61.9 ± 1.3 0.778 Fat, g 60.3 ± 8.8 52.1 ± 2.7 0.374 44.3 ± 4.3 43.2 ± 1.2 0.788 28.6 ± 2.1 33.4 ± 1.1 0.045 Saturated fatty
acid, g 18.9 ± 3.3 16.0 ± 0.9 0.389 13.1 ± 1.2 12.7 ± 0.4 0.733 7.5 ± 0.6 9.2 ± 0.3 0.013 Monounsaturat-
ed fatty acid, g 19.7 ± 3.2 16.6 ± 1.0 0.358 14.4 ± 1.5 13.9 ± 0.4 0.735 8.7 ± 0.7 10.1 ± 0.4 0.097 Polyunsaturated
fatty acid, g 12.8 ± 1.5 12.3 ± 0.7 0.771 10.4 ± 1.4 10.5 ± 0.3 0.929 8.2 ± 0.7 9.1 ± 0.3 0.259 n-3 fatty acid, g 1.79 ± 0.30 1.50 ± 0.09 0.372 1.63 ± 0.42 1.48 ± 0.07 0.719 1.29 ± 0.11 1.55 ± 0.08 0.033 n-6 fatty acid, g 11.3 ± 1.3 10.9 ± 0.6 0.791 8.8 ± 1.0 9.0 ± 0.3 0.775 7.0 ± 0.6 7.6 ± 0.3 0.363 Carbohydrate, g 291.6 ± 26.4 267.7 ± 8.6 0.368 262.2 ± 11.0 280.7 ± 4.1 0.113 307.6 ± 14.3 300.1 ± 5.3 0.615 Fiber, g 4.87 ± 0.59 5.75 ± 0.40 0.167 5.92 ± 0.44 6.63 ± 0.19 0.145 9.31 ± 0.74 8.78 ± 0.32 0.516 Calcium, mg 459.3 ± 56.3 435.1 ± 17.7 0.686 427.9 ± 30.9 467.1 ± 12.0 0.240 496.6 ± 33.4 481.7 ± 12.9 0.666 Phosphorus, mg 1042.2 ± 105.8 981.9 ± 31.7 0.591 953.3 ± 64.2 1014.5 ± 20.6 0.351 1006.4 ± 56.8 1041.4 ± 20.1 0.540 Iron, mg 14.3 ± 1.6 13.7 ± 0.5 0.691 15.4 ± 1.0 16.0 ± 0.3 0.576 18.1 ± 1.2 17.5 ± 0.4 0.659 Sodium, mg 3812.3 ± 433.3 3372.1 ± 180.1 0.329 3573.1 ± 357.6 3691.9 ± 92.2 0.748 3746.1 ± 287.8 3569.0 ± 131.6 0.560 Potassium, mg 2562.2 ± 250.4 2574.7 ± 74.7 0.962 2616.9 ± 150.5 2746.2 ± 49.8 0.409 3221.6 ± 190.0 3170.8 ± 77.3 0.804 Vitamin A, µgRE 864.4 ± 179.6 570.2 ± 38.9 0.111 687.9 ± 106.6 667.5 ± 23.9 0.856 700.2 ± 65.6 807.2 ± 55.0 0.163 Carotene, µg 3958.4 ± 986.6 2457.2 ± 218.8 0.138 2970.9 ± 334.5 3170.1 ± 130.9 0.595 3780.6 ± 401.8 4109.5 ± 296.0 0.473 Retinol, µg 151.8 ± 34.2 126.0 ± 9.3 0.471 171.5 ± 67.7 108.9 ± 7.4 0.364 59.5 ± 7.7 107.5 ± 24.0 0.082 Thiamin, mg 1.82 ± 0.22 1.78 ± 0.08 0.841 1.84 ± 0.12 1.91 ± 0.03 0.556 2.02 ± 0.16 1.99 ± 0.05 0.858 Riboflavin, mg 1.47 ± 0.17 1.33 ± 0.05 0.432 1.30 ± 0.12 1.30 ± 0.03 0.980 1.19 ± 0.07 1.26 ± 0.03 0.364 Niacin, mg 14.1 ± 1.4 14.7 ± 0.6 0.706 14.4 ± 1.2 14.7 ± 0.3 0.768 13.8 ± 0.9 14.7 ± 0.3 0.337 Vitamin C, mg 81.9 ± 14.7 81.2 ± 6.6 0.969 87.7 ± 11.5 96.4 ± 4.3 0.472 127.9 ± 16.1 129.8 ± 6.6 0.906
*p-values by general linear model (GLM) after adjusting for age; †Mean ± standard error.
perception of health [37].
For the 19–29 and 50–64 age groups, the depression group showed a significantly higher proportion of subjects who had experienced menopause. In a previous study, a group of individ- uals who had experienced menopause showed a higher severity of depression [38], while a study investigating intermediary variables between menopause and depression in 45–54-year- old Turkish women reported that sleeping difficulties and changes in memory, as symptoms of menopause, were sig- nificant predictive factors of depression [39]. Although the age of menopause varies among countries, the average age of menopause for women in developed countries is generally 52 years, while the average age in Korean women is 49.3 years, in Turkish women it is 45.8 years, and in Mexican women it is 48 years [40-42].
For the 30–49 age group in the present study, the proportion of subjects currently diagnosed with at least one chronic disease was significantly higher in the depression group than in the non- depression group. This is consistent with other results, such as the findings of a study of 40-year-old adults that women with an existing disease were more likely to experience depressed moods [43], and a study reporting a higher rate of depression in a group with hypertension, stroke, myocardial infarction, or angina compared to the group without any of these diseases [35]. The vascular depression hypothesis is based on the idea
that vascular diseases such as diabetes, hypertension, and car- diac disease cause cerebral small vessel disease in subcortical regions of the brain, and that this, in turn, causes depression through the impairment of neurobiological function [44]. Con- versely, there are also reports that the excessive secretion of adrenocortical hormones in depression causes accumulation of fat, abdominal obesity, diabetes, and hypertension [45].
Perceived everyday stress was significantly higher in the depression group for the 30–49 and 50–64 age groups. In one study of factors affecting depression in menopausal women, stress had the most explanatory power at 53%, compared to 3% for menopausal symptoms, 2% for marriage adaptation, and 1% for health promoting behaviors [38].
In terms of suicidal thoughts in the last year, the depression group showed a significantly higher proportion of subjects with suicidal thoughts compared to the non-depression group, for all age groups. Similarly, a study of female dental hygiene stu- dents showed that higher levels of depression were associated with more frequent thoughts about death, experience of suicidal impulses, and suicide attempts [46]. A study in rural areas in Iowa, in the US, also reported that suicidal thoughts were most common in middle-aged individuals of 45–64 years, and showed a strong association with depression [47].
In terms of food intake, for the 19–29 age group, the de- pression group showed a lower intake of cereal, chocolate, Table 8. INQ and RFS between depression group and non-depression group
Variables
19–29 years
p-value
30–49 years
p-value
50–64 years
p-value* Depression
Group
Depression Non- Group
Depression Group
Depression Non- Group
Depression Group
Depression Non- Group
(n = 35) (n = 274) (n = 110) (n = 898) (n = 134) (n = 587)
INQ
Protein 1.33 ± 0.07† 1.53 ± 0.04 0.017 1.42 ± 0.05 1.49 ± 0.02 0.191 1.36 ± 0.06 1.39 ± 0.02 0.563 Calcium 0.71 ± 0.06 0.79 ± 0.03 0.306 0.72 ± 0.03 0.77 ± 0.01 0.123 0.72 ± 0.04 0.71 ± 0.02 0.714 Phosphorus 1.48 ± 0.07 1.61 ± 0.03 0.065 1.46 ± 0.04 1.53 ± 0.01 0.070 1.44 ± 0.05 1.52 ± 0.02 0.093 Iron 1.01 ± 0.07 1.17 ± 0.04 0.038 1.18 ± 0.06 1.23 ± 0.02 0.395 2.24 ± 0.11 2.24 ± 0.04 0.986 Vitamin A 1.26 ± 0.22 1.02 ± 0.05 0.290 1.04 ± 0.08 1.11 ± 0.05 0.478 1.16 ± 0.11 1.37 ± 0.10 0.140 Vitamin B1 1.61 ± 0.10 1.84 ± 0.05 0.053 1.83 ± 0.08 1.87 ± 0.02 0.672 1.80 ± 0.07 1.86 ± 0.03 0.386 Vitamin B2 1.18 ± 0.09 1.26 ± 0.03 0.413 1.12 ± 0.05 1.15 ± 0.02 0.600 0.99 ± 0.04 1.06 ± 0.02 0.056 Niacin 1.00 ± 0.06 1.20 ± 0.03 0.003 1.10 ± 0.06 1.11 ± 0.01 0.813 0.99 ± 0.04 1.07 ± 0.02 0.045 Vitamin C 0.86 ± 0.15 0.97 ± 0.07 0.534 1.17 ± 0.25 1.05 ± 0.05 0.629 1.37 ± 0.18 1.29 ± 0.06 0.641 RFS 12.34 ± 1.20 12.70 ± 0.38 0.782 15.35 ± 0.85 15.08 ± 0.28 0.749 13.75 ± 0.63 15.23 ± 0.39 0.045 INQ: index of nutritional quality, RFS: recommended food score.
*p-values by t-test; †Mean ± standard deviation.
meat, and carbonated drinks compared to the non-depression group. For the 30–49 age group, the depression group showed a lower intake of rice with mixed grains, and a higher intake of instant noodles and cup noodles. For the 50–64 age group, the depression group showed a significantly lower intake of vegetables, mushrooms, and seaweed.
In a previous study, high intake of fruits, vegetables, and fish was reported to protect against depressive symptoms in 19–29-year-old women, while processed meats, chocolate, sweet desserts, fried food, refined grains, and high-fat dairy products were reported to increase vulnerability to depres- sive symptoms [48]. The diet used for depression in a study from the United Kingdom consisted of reducing sugar and stimulants such as caffeinated drinks and nicotine, increasing fruit and vegetable intake to five servings/day, consuming oily fish such as mackerel, tuna, salmon, or herring at least twice a week, and consuming plenty of protein from fish, meat, eggs, beans, and pulses [49].
For 30–49-year-old women, a prospective cohort study in the United Kingdom showed that high scores for depression were associated with a high intake of sweet desserts, fried food, processed meat, refined grains, and high-fat dairy prod- ucts [50], while a higher prevalence of psychiatric symptoms was reported in subjects with deficiency of folic acid from fruit, vegetables, beans, and seaweed [51]. A study from Spain also reported that fast food could increase the risk of depres- sion [52]. However, a study of the 20–39-year-old subjects who participated in the US National Health and Nutrition Examination Survey in 1999–2000 and 2001–2002 did not discover a significant association between depression and consumption of fish or seafood [53].
For 50–64-year-old women, one study of middle-aged adults in the United Kingdom reported a negative correlation between depressive symptoms and meals consisting of natural foods, including large amounts of vegetables, fruit, and fish, while the authors also reported a positive correlation with processed foods, including large amounts of processed meat, fried food, refined grains, and sweet desserts [50]. Another study from China reported a relationship between depres- sion and intake of fish, and high intake of fish was reported to reduce the risk of depression in Europe, but was reported to show no correlation in Asia, North America, South America, or Oceania [54].
In terms of nutrient intake, the 50–64 age group showed a significantly lower intake of fat, saturated fat, and n-3 fatty acids in the depression group compared to the non-depression
group. A study of female college students in Spain reported that low intake of n-3 fatty acids was related to depression [55]. N-3 fatty acids (omega-3 fatty acids), eicosapentanoic acid, and docosahexanoic acid are specific polyunsaturated fatty acids that are found in high concentrations in the brain and the phospholipid membranes of nerve cells [56], and a lack of n-3 fatty acids can lead to changes in plasma membrane microviscosity that can alter the neurotransmitter systems and progress to mood disorders [57]. A study from France reported that Eskimos consume up to 16 g of fish oil per day, and that this high intake of n-3 fatty acids promotes production of the neurotransmitter dopamine over the long-term, causing the emotional centers of the brain to produce a pleasant mood and improving the efficacy of treatment for depression [58]. In a study from the United States, a high ratio of n-6 fatty acids to n-3 fatty acids in the diet was reported to contribute to an increased incidence of depression and worsening severity of depression [59]. However, in a case-control study from Japan, depression was not associated with any difference in con- sumption frequency of fish or polyunsaturated fatty acids [60].
For the 19–29 age group, the INQs for protein, iron, and niacin were lower in the depression group than in the non-de- pression group, while for the 50–64 age group, the INQ of nia- cin was significantly lower in the depression group. In a previ- ous study of adult women, the INQs for protein, phosphorus, calcium, vitamin A, vitamin B1, and vitamin B2 were lower in the depression group than in the non-depression group, while the INQs for calcium and vitamin B2 were below 0.75 in both groups, indicating a poor quality of meals for these nutrients [13,61].
The RFS is a method of assessing the quality of meals based on the weekly frequency of consumption of healthy foods, such as mixed grains, fruit, vegetables, lean meat, and low- fat dairy products. For the 50–64 age group, the depression group showed a significantly lower RFS than the non-depres- sion group, and a high RFS was associated with less depres- sion. A study of adults in Japan found that a healthy Japanese diet, characterized by high intake of vegetables, fruit, tofu, and mushrooms, was associated with a reduced prevalence of de- pressive symptoms [62].
This study had several limitations: first, since the KNHANES was a cross-sectional study, it is unable to elucidate causation for the factors that affect depression. Second, nutrient intake was calculated as daily intake based on the 24-hour dietary recall method, but this does not provide a perfect estimate of everyday intake. Nevertheless, by using data from the food