Endocrinol Metab 2015;30:522-530
http://dx.doi.org/10.3803/EnM.2015.30.4.522 pISSN 2093-596X · eISSN 2093-5978
Original Article
Metabolic Health Is More Important than Obesity in the Development of Nonalcoholic Fatty Liver Disease:
A 4-Year Retrospective Study
Min-Kyung Lee*, Eun-Jung Rhee*, Min Chul Kim, Byung Sub Moon, Jeong In Lee, Young Seok Song, Eun Na Han, Hyo Sun Lee, Yoonjeong Son, Se Eun Park, Cheol-Young Park, Ki-Won Oh, Sung-Woo Park, Won-Young Lee Division of Endocrinology and Metabolism, Department of Internal Medicine, Kangbuk Samsung Hospital, Sungkyunkwan University School of Medicine, Seoul, Korea
Background: The aim of this study is to compare the risk for future development of nonalcoholic fatty liver disease (NAFLD) according to different status of metabolic health and obesity.
Methods: A total of 3,045 subjects without NAFLD and diabetes at baseline were followed for 4 years. Subjects were catego- rized into four groups according to the following baseline metabolic health and obesity statuses: metabolically healthy, non-obese (MHNO); metabolically healthy, obese (MHO); metabolically unhealthy, non-obese (MUHNO); and metabolically unhealthy, obese (MUHO). Being metabolically healthy was defined as having fewer than two of the following five components: high blood pressure, high fasting blood glucose, high triglyceride, low high density lipoprotein cholesterol, and being in the highest decile of the homeostasis model assessment-insulin resistance index. Obesity was defined as a body mass index >25 kg/m2. The presence of NAFLD was assessed by ultrasonography.
Results: The proportions of subjects included in the MHNO, MHO, MUHNO, and MUHO groups were 71.4%, 9.8%, 13.0%, and 5.8%, respectively. The proportions of subjects who developed NAFLD were 10.5%, 31.4%, 23.2%, and 42% in the MHNO, MHO, MUHNO, and MUHO groups, respectively. The risk for developing NAFLD was highest in subjects who were metaboli- cally unhealthy both at baseline and after 4 years compared with subjects who were consistently metabolically healthy during the follow-up period (odds ratio, 2.862). Using the MHNO group as reference, the odds ratios for the MHO, MUHNO, and MUHO groups were 1.731, 1.877, and 2.501, respectively.
Conclusion: The risk for NAFLD was lower in MHO subjects than in MUNO subjects.
Keywords: Metabolic health; Non-alcoholic fatty liver disease; Obesity
Received: 31 March 2015, Revised: 13 April 2015, Accepted: 17 April 2015
Corresponding author: Won-Young Lee
Division of Endocrinology and Metabolism, Department of Internal Medicine, Kangbuk Samsung Hospital, Sungkyunkwan University School of Medicine, 29 Saemunan-ro, Jongno-gu, Seoul 03181, Korea
Tel: +82-2-2001-2579, Fax: +82-2-2001-1588, E-mail: [email protected]
*These authors contributed equally to this work.
Copyright © 2015 Korean Endocrine Society
This is an Open Access article distributed under the terms of the Creative Com- mons Attribution Non-Commercial License (http://creativecommons.org/
licenses/by-nc/3.0/) which permits unrestricted non-commercial use, distribu- tion, and reproduction in any medium, provided the original work is properly cited.
INTRODUCTION
Nonalcoholic fatty liver disease (NAFLD) is a condition in which fat erroneously accumulates in the liver [1]. NAFLD is considered one of the most prevalent causes of liver cirrhosis [2]. The presence of NAFLD reflects not simply the infiltration of fat in the liver but it also indicates a risk of inflammatory at- tack on hepatic tissue, which could lead to fibrosis [3,4]. Re- cent studies described the deleterious effects of NAFLD, which range from liver damage to increased risk of cardiovascular disease (CVD) [5,6].
The recently proposed concept of metabolically healthy obe- sity suggests that a subset of obese subjects display a metaboli- cally healthy phenotype [7-10]. These subjects seem to be pro- tected against obesity-induced deterioration of metabolism, such as dyslipidemia, diabetes, hypertension, and cardiovascu- lar risk [11]. This concept is distinct from the concept of meta- bolic syndrome in that the importance of metabolic health is emphasized apart from obesity, since measurable markers of obesity, such as waist circumference (WC) or body weight, are not included in the definition of metabolic health [12].
NAFLD is derived from insulin resistance, and the presence of NAFLD implies infiltration of ectopic fat to the liver, also known as lipid spillover to fat-unfavorable tissue [1]. As insu- lin resistance is the main mechanism for the development of metabolic syndrome, it has been suggested that NAFLD should be included as one of the components of metabolic syndrome [13]. However, whether NAFLD might be an independent de- terminant of metabolic health apart from obesity has not yet been clarified. Therefore, we aimed to compare the risk of NAFLD development among subjects grouped according to metabolic health and obesity status. We compared the risk of NAFLD according to changes in metabolic health over a 4-year follow-up period in apparently healthy Korean subjects without NAFLD at baseline.
METHODS
Study subjects
This retrospective study included subjects who were partici- pants in the Kangbuk Samsung Health Study, a medical health check-up program at the Health Promotion Center of Kangbuk Samsung Hospital, Sungkyunkwan University School of Medi- cine, Seoul, Korea; participants were included in a large data- base. The purpose of the medical health check-up program is to promote the health of employees through regular health check-
ups and to enhance early detection of existing diseases. Most of the examinees are employees and family members of various industrial companies from all around the country. The costs of the medical examinations are largely paid for by employers, and a considerable proportion of the examinees undergo exam- inations annually or biannually.
From 2005 to 2009, 10,371 participants received an annual health check-up. Among these, 7,326 subjects were excluded for the following reasons: NAFLD or diabetes at baseline, more than 20 g of alcohol consumption per day, positive serologic markers for hepatitis B or C virus, liver cirrhosis, or missing data. Final analyses were performed in 3,045 subjects (1,625 males and 1,420 females) with a mean age of 44.2 years (Table 1).
The participants provided written informed consent for the use of their health screening data for research. The design, pro- tocol, and consent procedure of this study were reviewed and approved by the Institutional Review Board of Kangbuk Sam- sung Hospital (KBS12089) and were conducted in accordance with the Helsinki Declaration of 1975.
Anthropometric and laboratory measurements
Height and weight were measured twice and then averaged.
Body mass index (BMI) was calculated by dividing weight (kg) by the square of the height (m). Blood pressure was measured using a standardized sphygmomanometer after 5 minutes of rest. WC was measured in the standing position, at the middle point between the anterior iliac crest and lower border of the rib, by a single examiner. Patient exercise was defined as per- forming regular exercise of moderate intensity more than three times every week.
All of the subjects were examined after an overnight fast.
The hexokinase method was used to test fasting blood glucose (FBG) concentrations (Hitachi Modular D2400, Roche, Tokyo, Japan). Fasting insulin concentrations were determined by elec- trochemiluminescence immunoassay (Hitachi Modular E170, Roche). Alanine aminotransferase and aspartate aminotransfer- ase were measured by ultraviolet without the P5P method (Ad- via 1650 Autoanalyzer, Bayer Diagnostics, Leverkusen, Ger- many). An enzymatic calorimetric test was used to measure levels of total cholesterol and triglycerides (TGs). The selective inhibition method was used to measure the level of high density lipoprotein cholesterol (HDL-C), and a homogeneous enzymat- ic calorimetric test was used to measure the level of low density lipoprotein cholesterol (LDL-C). Glycosylated hemoglobin was measured by immunoturbidimetric assay with a Cobra Integra 800 automatic analyzer (Roche Diagnostics, Basel, Switzer-
land) with reference values of 4.4% to 6.4%. The methodology was aligned with the standards of the Diabetes Control and Complications Trial and National Glycohemoglobin Standard- ization Program [14]. The intra-assay coefficient of variation was 2.3%, and the interassay coefficient of variation was 2.4%, both within the acceptable limits of the National Glycohemo- globin Standardization Program guidelines [15].
Insulin resistance was measured using the homeostatic model of the assessment of insulin resistance (HOMA-IR) and was ob- tained by applying the following formula: HOMA-IR=fasting insulin (IU/mL)×fasting blood glucose (mmol/L)/22.5 [16].
Subjects with underlying diabetes at baseline were excluded from the study. The presence of impaired fasting glucose and diabetes mellitus was determined according to self-reported questionnaires by the participants and the diagnostic criteria of the American Diabetes Association [17].
Definition of metabolic health and obesity status
Obesity status was defined based on BMI category (non-obese
<25 kg/m2, obese ≥25 kg/m2). In 2000, the World Health Or- ganization Western Pacific Region suggested revised Asia-Pa-
cific criteria of obesity in Asian populations, using reduced values for BMI (obesity defined as BMI ≥25 kg/m2 in both sexes) [18].
Being metabolically healthy was defined as having fewer than two of the following four components of metabolic syn- drome (WC criteria was replaced by HOMA-IR per the modi- fied criteria proposed by Wildman et al.) [19,20]:
(1) Systolic blood pressure ≥130 mm Hg and/or diastolic blood pressure ≥85 mm Hg or on antihypertensive treatment (2) TG ≥150 mg/dL
(3) FBG ≥100 mg/dL or being treated for diabetes
(4) HDL-C <40 mg/dL in males and <50 mg/dL in females (5) HOMA-IR ≥90th percentile
According to the above criteria, participants were divided into four groups:
(1) Metabolically healthy, non-obese (MHNO): BMI <25 kg/
m2 and <2 metabolic risk factors
(2) Metabolically healthy, obese (MHO): BMI ≥25 kg/m2 and
<2 metabolic risk factors
(3) Metabolically unhealthy, non-obese (MUHNO): BMI <25 Table 1. Baseline Characteristics of the Participants according to the Development of Nonalcoholic Fatty Liver Disease after 4 Years (n=3,045)
Characteristic All No NAFLD in 2009 (n=2,555) NAFLD in 2009 (n=490) P value
Age, yr 44.2±6.9 44.1±6.9 44.8±6.5 0.034
Male sex 1,625 (53.4) 1,289 (50.5) 336 (68.7) <0.01
BMI, kg/m2 22.5±2.5 22.2±2.4 24.1±2.5 <0.01
Waist circumference, cm 76.6±8.3 75.7±8.1 81.7±7.4 <0.01
SBP, mm Hg 110.1±14.3 109.6±14.3 112.6±14.2 <0.01
DBP, mm Hg 73.6±10.1 73.1±9.9 76.0±10.6 <0.01
Fasting glucose, mg/dL 93.7±8.0 93.4±7.9 95.6±8.3 <0.01
AST, IU/L 22.0±6.3 21.8±6.4 22.7±5.9 <0.01
ALT, IU/L 20.2±9.7 19.6±9.2 23.5±11.0 <0.01
Total cholesterol, mg/dL 189.1±31.3 187.8±31.0 195.7±32.0 <0.01
Triglyceride, mg/dL 103.4±54.4 97.6±48.9 133.7±69.8 <0.01
HDL-C, mg/dL 55.4±12.3 56.2±12.4 50.8±10.1 <0.01
LDL-C, mg/dL 108.8±26.0 107.5±25.6 115.5±26.9 <0.01
HbA1c, % 5.39±0.3 5.38±0.3 5.43±0.3 <0.01
Fasting insulin, μIU/mL 7.9±2.8 7.8±2.7 8.7±3.2 <0.01
HOMA-IR 1.85±0.7 1.81±0.7 2.06±0.8 <0.01
Values are expressed as mean±SD or number (%).
NAFLD, nonalcoholic fatty liver disease; BMI, body mass index; SBP, systolic blood pressure; DBP, diastolic blood pressure; AST, aspartate amino- transferase; ALT, alanine aminotransferase; HDL-C, high density lipoprotein cholesterol; LDL-C, low density lipoprotein cholesterol; HbA1c, glyco- sylated hemoglobin; HOMA-IR, homeostasis model assessment index of insulin resistance.
kg/m2 and ≥2 metabolic risk factors
(4) Metabolically unhealthy, obese (MUHO): BMI ≥25 kg/m2 and ≥2 metabolic risk factors
In addition, subjects were divided into four groups according to metabolic health at baseline and after 4 years of follow-up:
(1) Consistently metabolically healthy at baseline and after 4 years (MH→MH)
(2) Metabolically healthy at baseline and metabolically un- healthy after 4 years (MH→MUH)
(3) Metabolically unhealthy at baseline and metabolically healthy after 4 years (MUH→MH)
(4) Consistently metabolically unhealthy at baseline and after 4 years (MUH→MUH)
Assessment of presence or absence of NAFLD
The diagnosis of NAFLD was based on abdominal ultrasonog- raphy results with a 3.5-MHz transducer (Logic Q700 MR, GE, Milwaukee, WI, USA). Three experienced radiologists who were blinded to both the study aims and laboratory values performed the ultrasonography. Images were captured in a standard fashion with the patient in the supine position with their right arm raised above their head. All ultrasonographic images were stored on the image server and were also recorded with instant film for later inspection by the radiologists and physicians. Of the four known criteria for fatty liver disease (hepatorenal echo contrast, liver brightness, deep attenuation, and vascular blurring), a diagnosis of NAFLD in our study re- quired hepatorenal echo contrast and liver brightness [21].
Statistical analysis
All data are presented as mean±standard deviation and were analyzed using SPSS version 18.0 (SPSS Inc., Chicago, IL, USA). Comparison of the parameters between the subjects who developed NAFLD and those who did not develop NAFLD by 2009 was performed using the Student t test. Comparison of the parameters among the four groups divided by obesity status and metabolic health was performed using one-way analysis of vari- ance. The odds ratios (ORs) for development of NAFLD ac- cording to changes in metabolic health over 4 years were calcu- lated using logistic regression analysis. The ORs for developing NAFLD after 4 years of follow-up among the different groups divided by metabolic health and obesity status were calculated using logistic regression analysis after adjusting for confound- ing factors. Statistical significance was defined as P<0.05.
RESULTS
Baseline characteristics
The mean age of participants was 44.2 years, and 53.4% of the participants were males (Table 1). Among the participants, 490 subjects (16.1%) developed NAFLD after 4 years. The majority of subjects who developed NAFLD by 2009 were males. Com- pared to those who did not develop NAFLD, subjects who de- veloped NAFLD were older and had worse metabolic profiles.
Comparisons of the parameters according to the groups divided by metabolic health and obesity status
Participants were divided into groups based on baseline meta- bolic health and obesity status: 71.4% of the subjects were in the MHNO group, 9.8% were in the MHO group, 13.0% were in the MUHNO group, and 5.8% were in the MUHO group (Table 2). When comparing parameters among the groups, subjects in the MUHO group were the oldest and had the highest mean val- ues for BMI, WC, FBG, blood pressure, aspartate aminotrans- ferase, alanine aminotransferase, total cholesterol, TG, LDL-C, fasting insulin and HOMA-IR; additionally, the MUHO group had the lowest mean value for HDL-C among the four groups.
When the mean values of the parameters were compared be- tween individual groups with multiple comparison analyses, FBG, TG, glycosylated hemoglobin, fasting insulin, and HOMA-IR showed significantly higher values and HDL-C showed significantly lower values in metabolically unhealthy groups compared with metabolically healthy groups (Table 2).
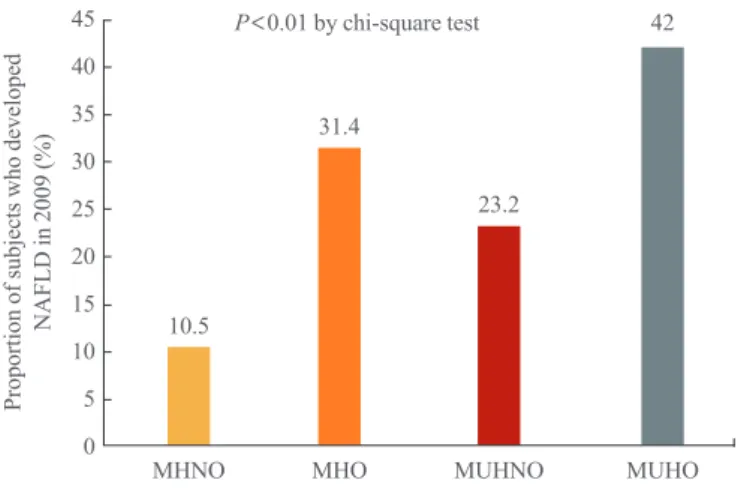
Proportion of subjects who developed NAFLD in 2009 (%)
P<0.01 by chi-square test 45
40 35 30 25 20 15 10 5
0 MHNO
31.4
23.2
42
MHO MUHNO MUHO
10.5
Fig. 1. Comparison of the proportion of subjects who developed nonalcoholic fatty liver disease (NAFLD) in 2009. MHNO, meta- bolically healthy, non-obese; MHO, metabolically healthy, obese;
MUHNO, metabolically unhealthy, non-obese; MUHO, metaboli- cally unhealthy, obese.
In contrast, BMI, WC, liver enzymes, total cholesterol, and LDL-C showed significantly higher mean values in obese groups compared with non-obese groups with the same meta- bolic health status. When mean values were compared between the MHO and MUHO groups, the MHO group showed a sig- nificantly lower mean WC value compared with the MUHO group, despite the non-significant difference in mean BMI be- tween the two groups.
Risk for development of NAFLD according to changes in metabolic health
The proportions of subjects who developed NAFLD were 10.5%, 31.4%, 23.2%, and 42% in the MHNO, MHO, MUH- NO, and MUHO groups, respectively (Table 2, Fig. 1). When
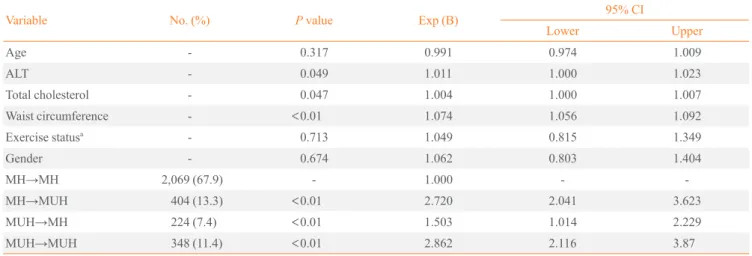
logistic regression analysis was performed with NAFLD devel- opment as the dependent variable, subjects who remained MUH over the 4-year follow-up period showed the highest OR for NAFLD development compared with subjects who re- mained MH over the 4 years (OR, 2.862; 95% confidence inter- val [CI], 2.116 to 3.870) (Table 3). The subjects who progressed from MH to MUH over the 4 years showed a higher OR for NAFLD development compared with subjects who regressed from MUH to MH over the 4 years (OR, 2.720 vs. 1.503).
Risk for development of NAFLD in subjects grouped according to metabolic health and obesity status
When logistic regression analysis was performed with develop- ment of NAFLD after 4 years as the dependent variable, the Table 2. Comparison of Parameters among Groups Divided by Baseline Metabolic Health and Obesity Status (n=3,045)
Characteristic MHNO
(n=2,174) MHO
(n=299) MUHNO
(n=396) MUHO
(n=176) Differences among the
groups by post hoc analyses P value by one- way ANOVA test
Age, yr 43.7±6.7 45.2±6.9 45.4±7.3 45.4±7.3 I≠II, I≠III, I≠IV <0.01
Male sex 995 (45.8) 201 (67.2) 283 (71.5) 146 (83.0) - <0.01
BMI, kg/m2 21.6±1.9 26.4±1.2 22.7±1.6 26.6±1.5 I≠II, I≠III, I≠IV, II≠III, III≠IV <0.01 Waist circumference, cm 74.0±7.2 85.9±5.7 79.0±6.3 88.0±5.3 I≠II, I≠III, I≠IV, II≠III, II≠IV,
III≠IV <0.01
SBP, mm Hg 107.3±12.8 112.7±13.5 118.7±16.3 120.6±15.8 I≠II, I≠III, I≠IV, II≠III, II≠IV <0.01 DBP, mm Hg 71.3±8.9 76.7±9.5 79.6±10.7 82.6±11.1 I≠II, I≠III, I≠IV, II≠III, II≠IV,
III≠IV <0.01
FBG, mg/dL 92.9±7.6 94.4±7.9 96.1±8.5 97.7±8.5 I≠II, I≠III, I≠IV, II≠III, II≠IV, III≠IV
<0.01
AST, IU/L 21.6±6.2 23.0±6.2 22.3±6.8 23.4±6.8 I≠II, I≠III, I≠IV <0.01
ALT, IU/L 19.0±8.9 23.2±10.3 22.4±10.4 26.0±12.0 I≠II, I≠III, I≠IV <0.01
Total cholesterol, mg/dL 187.3±30.8 196.0±30.9 191.9±32.2 194.1±32.5 I≠II, I≠III, I≠IV <0.01 Triglyceride, mg/dL 87.2±34.1 102.6±40.1 164.2±72.3 168.2±81.9 I≠II, I≠III, I≠IV, II≠III, II≠IV <0.01 HDL-C, mg/dL 58.1±12.0 54.8±10.6 45.7±8.3 44.3±6.9 I≠II, I≠III, I≠IV, II≠III, II≠IV <0.01 LDL-C, mg/dL 106.8±25.7 116.8±26.4 111.1±26.1 114.4±24.4 I≠II, I≠III, I≠IV, II≠III <0.01
HbA1c, % 5.39±0.3 5.40±0.3 5.40±0.3 5.42±0.3 - 0.466
Fasting insulin, μIU/mL 7.5±2.3 8.2±2.5 9.1±3.4 10.9±4.0 I≠II, I≠III, I≠IV, II≠III, II≠IV, III≠IV
<0.01 HOMA-IR 1.71±0.6 1.91±0.6 2.17±0.8 2.65±1.1 I≠II, I≠III, I≠IV, II≠III, II≠IV,
III≠IV
<0.01 Subjects who developed
NAFLD in 2009 229 (10.5) 94 (31.4) 92 (23.2) 74 (42) - <0.01
Values are expressed as mean±SD or number (%).
MHNO, metabolically healthy, non-obese; metabolically healthy, non-obese; MHO, metabolically healthy, obese; MUHNO, metabolically un- healthy, non-obese; MUHO, metabolically unhealthy, obese; ANOVA, analysis of variance; BMI, body mass index; SBP, systolic blood pressure;
DBP, diastolic blood pressure; FBG, fasting blood glucose; AST, aspartate aminotransferase; ALT, alanine aminotransferase; HDL-C, high density li- poprotein cholesterol; LDL-C, low density lipoprotein cholesterol; HbA1c, glycosylated hemoglobin; HOMA-IR, homeostasis model assessment in- dex of insulin resistance; NAFLD, nonalcoholic fatty liver disease.
MUHO group showed the highest OR (2.501; 95% CI, 1.699 to 3.681) for NAFLD development among the four groups (Ta- ble 4). The MUHNO group showed a higher OR for NAFLD compared with the MHO group ([OR, 1.877; 95% CI, 1.412 to 2.494] vs. [OR, 1.731; 95% CI, 1.239 to 2.419]) (Table 4).
DISCUSSION
This study compared the risks of developing NAFLD in sub-
jects grouped by baseline metabolic health and obesity status.
As expected, we found that metabolically unhealthy groups showed significantly worse metabolic profiles than metaboli- cally healthy groups. Compared to subjects in the MHO group, the subjects in the MUHO group showed significantly higher mean values for WC, which is related to obesity; however, these groups had statistically similar mean values of BMI, sug- gesting that abdominal obesity may play a role in being meta- bolically unhealthy. When the future risks of NAFLD develop- Table 4. Logistic Regression Analysis for the Risk of Nonalcoholic Fatty Liver Disease over 4 Years of Follow-up according to Groups Divided by Baseline Metabolic Health and Obesity Status
Variable P value Exp (B) 95% CI
Lower Upper
Age 0.262 0.991 0.976 1.007
Gender 0.618 1.069 0.823 1.388
ALT 0.015 1.013 1.003 1.023
Total cholesterol 0.006 1.005 1.001 1.008
Waist circumference <0.01 1.068 1.048 1.089
Exercise statusa 0.837 1.025 0.809 1.299
MHNO - - - -
MHO 0.010 1.731 1.239 2.419
MUHNO <0.01 1.877 1.412 2.494
MUHO <0.01 2.501 1.699 3.681
CI, confidence interval; ALT, alanine aminotransferase; MHNO, metabolically healthy, non-obese; MHO, metabolically healthy, obese; MUHNO, metabolically unhealthy, non-obese; MUHO, metabolically unhealthy, obese.
aExercise was defined as performing regular exercise of moderate intensity more than 3 times every week.
Table 3. Logistic Regression Analysis for the Risk of Nonalcoholic Fatty Liver Disease according to Changes in Metabolic Health between Baseline and after 4 Years
Variable No. (%) P value Exp (B) 95% CI
Lower Upper
Age - 0.317 0.991 0.974 1.009
ALT - 0.049 1.011 1.000 1.023
Total cholesterol - 0.047 1.004 1.000 1.007
Waist circumference - <0.01 1.074 1.056 1.092
Exercise statusa - 0.713 1.049 0.815 1.349
Gender - 0.674 1.062 0.803 1.404
MH→MH 2,069 (67.9) - 1.000 - -
MH→MUH 404 (13.3) <0.01 2.720 2.041 3.623
MUH→MH 224 (7.4) <0.01 1.503 1.014 2.229
MUH→MUH 348 (11.4) <0.01 2.862 2.116 3.87
CI, confidence interval; ALT, alanine aminotransferase; MH, metabolically healthy; MUH, metabolically unhealthy.
aExercise was defined as performing regular exercise of moderate intensity more than 3 times every week.
ment were compared among the groups divided by metabolic health at baseline and after 4 years, subjects who remained MUH showed a significantly higher risk for NAFLD develop- ment compared with other groups, and subjects who progressed to MUH from MH showed a higher risk for NAFLD develop- ment compared with subjects who regressed to MH from MUH after 4 years. Lastly, MUHO subjects showed the highest risk for NAFLD development among the four groups, and the MUHNO group showed a significantly higher risk of NAFLD development compared with the MHO group, suggesting being metabolically unhealthy might be a greater contributor to the development of NAFLD than simply being obese in this popu- lation.
NAFLD is considered not only as the accumulation of fat in the liver, but also as a marker of ectopic fat accumulation and reflection of lipid “spill-over” to non-lipid storing organs [1].
Persistent NAFLD could progress to non-alcoholic steatohepa- titis, a precursor to cryptogenic liver cirrhosis [2]. Many stud- ies have warned about the clinical importance of NAFLD as a risk factor not only for liver disease but also for CVD [5,6].
The mechanism underlying the association of increased risk of CVD with NAFLD is explained by shared common pathogenic mechanisms between the diseases: insulin resistance, visceral fat accumulation, inflammation and increased circulating free fatty acids.
Increasing evidence supporting the possibility of metaboli- cally healthy obesity suggests that a subset of obese subjects is protected from the metabolic derangements of obesity [7]. In contrast, some subjects categorized as metabolically unhealthy non-obese subjects display metabolic abnormalities in the ab- sence of obesity. Several studies have suggested an increased risk of CVD and diabetes mellitus in these subsets of subjects compared with MHNO subjects [11]. Unfortunately, there is no unified definition of metabolic health, and there are also signif- icant differences among researchers regarding which compo- nents should be included in this definition [12]. However, the most frequently used metabolic components used to define metabolic syndrome include the presence of hyperglycemia, hypertension, hypertriglyceridemia, and low HDL-C levels;
furthermore, high-sensitivity C-reactive protein or HOMA-IR may be added components, with obesity being defined sepa- rately with WC or BMI. In this study, we used the four meta- bolic syndrome criteria plus HOMA-IR, and BMI was used to define obesity.
There have been few studies regarding the risk of NAFLD development among subgroups divided by metabolic health
and obesity status. In a substudy of the FIN-D2D survey, a cross-sectional analysis was performed to examine the preva- lence of different metabolic phenotypes of obesity with the ap- plication of metabolic syndrome definition [22]. In this study, increasing BMI had a significantly greater effect on estimates of liver fat among the individuals with metabolic syndrome compared with subjects without metabolic syndrome. Howev- er, this study assessed NAFLD only by NAFLD score, not by any pathologic or radiologic examinations, and it was a cross- sectional study. A recent study from the participants in the In- sulin Resistance Atherosclerosis Study (IRAS) Family Study, a study from multi-generational families of Hispanic back- ground, showed that the odds of developing NAFLD were re- duced in MHO subjects compared with MUHO subjects [23].
However, this was also a cross-sectional study. In our study, for the first time in the literature, we showed that metabolically unhealthy subjects showed a higher risk of NAFLD develop- ment compared with metabolically healthy subjects, suggesting the importance of metabolic health, regardless of obesity status, in the development of NAFLD over a 4-year follow-up period.
In addition, the MHO group showed a significantly smaller mean WC compared with the MUHO group, indicating the del- eterious impact of abdominal obesity in metabolic health across various degrees of obesity defined by BMI.
In our study, subjects who remained metabolically unhealthy throughout the follow-up period showed significantly increased NAFLD risk compared with those who remained metabolically healthy. This finding strongly suggests the importance of early and intensive lifestyle intervention in this metabolically un- healthy group, since a prolonged period of a metabolically un- healthy status could result in metabolic derangements, such as NAFLD. Another interesting result was that subjects who were metabolically healthy at baseline and who then became meta- bolically unhealthy after 4 years showed a significantly higher NAFLD risk compared with subjects who were metabolically unhealthy at baseline and metabolically healthy after 4 years.
This finding is also in agreement with the lesson learned from the previous finding, in that early intervention in these subjects might reverse the metabolic derangements that may have been caused by metabolic unhealthiness.
Our study had several limitations. Because this was an ob- servational study and no intervention or invasive procedure could be performed in participants, we used ultrasonographic methods to define NAFLD and could not perform liver biopsy, yet liver biopsy is the gold standard for accurate diagnosis and staging of NAFLD. However, it is inappropriate to perform liv-
er biopsies in a large-scale epidemiologic study as it is too in- vasive [24]. The second limitation of the study was that precise information regarding lifestyle and exercise in this population could not be included in the analyses. Therefore, no adjust- ments were made regarding interventions that may have been performed after the participants learned the results of their health examination.
The strength of this study is that it is the first longitudinal study to evaluate NAFLD risk according to different metabolic health and obesity statuses over a 4-year follow-up period. In the group with no NAFLD at baseline, the risk for developing NAFLD was significantly increased in subjects who were met- abolically unhealthy at baseline and after 4 years, compared with other subgroups. In addition, MHO subjects at baseline showed a significantly lower risk for NAFLD compared with MUHNO subjects, suggesting the greater impact of metabolic health in the development of NAFLD, as compared to obesity.
In addition, subjects who progressed from metabolically healthy at baseline to metabolically unhealthy after 4 years showed significantly higher NAFLD risk compared with those who became metabolically healthy after 4 years; this finding emphasizes the importance of early intervention, besides sim- ple weight loss, in metabolically unhealthy subjects. Interven- tion should focus on reversing the unhealthy metabolic status of these subjects.
CONFLICTS OF INTEREST
No potential conflict of interest relevant to this article was re- ported.
REFERENCES
1. Day CP, James OF. Hepatic steatosis: innocent bystander or guilty party? Hepatology 1998;27:1463-6.
2. Clark JM, Brancati FL, Diehl AM. Nonalcoholic fatty liver disease. Gastroenterology 2002;122:1649-57.
3. Seo YY, Cho YK, Bae JC, Seo MH, Park SE, Rhee EJ, et al. Tumor necrosis factor-α as a predictor for the develop- ment of nonalcoholic fatty liver disease: a 4-year follow-up study. Endocrinol Metab (Seoul) 2013;28:41-5.
4. Jeon WS, Park SE, Rhee EJ, Park CY, Oh KW, Park SW, et al. Association of serum adipocyte-specific fatty acid bind- ing protein with fatty liver index as a predictive indicator of nonalcoholic fatty liver disease. Endocrinol Metab (Seoul) 2013;28:283-7.
5. Pacana T, Fuchs M. The cardiovascular link to nonalcoholic fatty liver disease: a critical analysis. Clin Liver Dis 2012;
16:599-613.
6. Targher G, Marra F, Marchesini G. Increased risk of cardio- vascular disease in non-alcoholic fatty liver disease: causal effect or epiphenomenon? Diabetologia 2008;51:1947-53.
7. Bluher M. Are there still healthy obese patients? Curr Opin Endocrinol Diabetes Obes 2012;19:341-6.
8. Calori G, Lattuada G, Piemonti L, Garancini MP, Ragogna F, Villa M, et al. Prevalence, metabolic features, and prog- nosis of metabolically healthy obese Italian individuals: the Cremona Study. Diabetes Care 2011;34:210-5.
9. Hamer M, Stamatakis E. Metabolically healthy obesity and risk of all-cause and cardiovascular disease mortality. J Clin Endocrinol Metab 2012;97:2482-8.
10. Stefan N, Haring HU, Hu FB, Schulze MB. Metabolically healthy obesity: epidemiology, mechanisms, and clinical implications. Lancet Diabetes Endocrinol 2013;1:152-62.
11. Appleton SL, Seaborn CJ, Visvanathan R, Hill CL, Gill TK, Taylor AW, et al. Diabetes and cardiovascular disease outcomes in the metabolically healthy obese phenotype: a cohort study. Diabetes Care 2013;36:2388-94.
12. Velho S, Paccaud F, Waeber G, Vollenweider P, Marques- Vidal P. Metabolically healthy obesity: different prevalenc- es using different criteria. Eur J Clin Nutr 2010;64:1043-51.
13. Tarantino G, Finelli C. What about non-alcoholic fatty liver disease as a new criterion to define metabolic syndrome?
World J Gastroenterol 2013;19:3375-84.
14. National Glycohemoglobin Standardization Program. List of NGSP certified methods [Internet]. National Glycohe- moglobin Standardization Program; c2010 [cited 2015 Oct 16]. Available from: http://www.ngsp.org/docs/methods.
pdf.
15. Schwartz KL, Monsur JC, Bartoces MG, West PA, Neale AV. Correlation of same-visit HbA1c test with laboratory- based measurements: a MetroNet study. BMC Fam Pract 2005;6:28.
16. Matthews DR, Hosker JP, Rudenski AS, Naylor BA, Treach- er DF, Turner RC. Homeostasis model assessment: insulin resistance and beta-cell function from fasting plasma glu- cose and insulin concentrations in man. Diabetologia 1985;
28:412-9.
17. Standards of medical care in diabetes: 2015: summary of revisions. Diabetes Care 2015;38 Suppl:S4.
18. Bassett J. International Diabetes Institute World Health Or- ganization Regional Office for the Western Pacific Interna-
tional Association for the Study of Obesity; International Obesity Task Force. The Asia-Pacific perspective: redefin- ing obesity and its treatment. Australia: Health Communi- cations Australia; 2000.
19. Wildman RP, Muntner P, Reynolds K, McGinn AP, Ra- jpathak S, Wylie-Rosett J, et al. The obese without cardio- metabolic risk factor clustering and the normal weight with cardiometabolic risk factor clustering: prevalence and corre- lates of 2 phenotypes among the US population (NHANES 1999-2004). Arch Intern Med 2008;168:1617-24.
20. Alberti KG, Eckel RH, Grundy SM, Zimmet PZ, Cleeman JI, Donato KA, et al. Harmonizing the metabolic syndrome:
a joint interim statement of the International Diabetes Fed- eration Task Force on Epidemiology and Prevention; Na- tional Heart, Lung, and Blood Institute; American Heart Association; World Heart Federation; International Athero- sclerosis Society; and International Association for the
Study of Obesity. Circulation 2009;120:1640-5.
21. Saverymuttu SH, Joseph AE, Maxwell JD. Ultrasound scanning in the detection of hepatic fibrosis and steatosis.
Br Med J (Clin Res Ed) 1986;292:13-5.
22. Pajunen P, Kotronen A, Korpi-Hyovalti E, Keinanen-Kiu- kaanniemi S, Oksa H, Niskanen L, et al. Metabolically healthy and unhealthy obesity phenotypes in the general population: the FIN-D2D Survey. BMC Public Health 2011;
11:754.
23. Samaropoulos XF, Hairston KG, Anderson A, Haffner SM, Lorenzo C, Montez M, et al. A metabolically healthy obese phenotype in hispanic participants in the IRAS family study.
Obesity (Silver Spring) 2013;21:2303-9.
24. Joy D, Thava VR, Scott BB. Diagnosis of fatty liver disease:
is biopsy necessary? Eur J Gastroenterol Hepatol 2003;15:
539-43.