Background and PurposezzWe investigated the potential role of serum procalcitonin in dif- ferentiating tuberculosis meningitis from bacterial and viral meningitis, and in predicting the prognosis of tuberculosis meningitis.
MethodszzThis was a retrospective study of 26 patients with tuberculosis meningitis. In addi- tion, 70 patients with bacterial meningitis and 49 patients with viral meningitis were included as the disease control groups for comparison. The serum procalcitonin level was measured in all patients at admission. Differences in demographic and laboratory data, including the pro- calcitonin level, were analyzed among the three groups. In addition, we analyzed the predictive factors for a prognosis of tuberculosis meningitis using the Glasgow Coma Scale (GCS) at dis- charge, and the correlation between the level of procalcitonin and the GCS score at discharge.
ResultszzMultiple logistic regression analysis showed that a low level of procalcitonin (≤1.27 ng/mL) independently distinguished tuberculosis meningitis from bacterial meningitis. The sensitivity and specificity for distinguishing tuberculosis meningitis from bacterial meningitis were 96.2% and 62.9%, respectively. However, the level of procalcitonin in patients with tuber- culosis meningitis did not differ significantly from that in patients with viral meningitis. In patients with tuberculosis meningitis, a high level of procalcitonin (>0.4 ng/mL) was a predictor of a poor prognosis, and the level of procalcitonin was negatively correlated with the GCS score at discharge (r=-0.437, p=0.026).
ConclusionszzWe found that serum procalcitonin is a useful marker for differentiating tuber- culosis meningitis from bacterial meningitis and is also valuable for predicting the prognosis of tuberculosis meningitis.
Key Wordszz tuberculosis, bacteria, procalcitonin, prognosis.
Procalcitonin as a Diagnostic and Prognostic Factor for Tuberculosis Meningitis
INTRODUCTION
Tuberculosis is caused by the bacteria Mycobacterium tuberculosis and is a global concern worldwide, especially in developing countries.1 Despite the rapid economic development of the Republic of Korea, the prevalence of tuberculosis is high, with an incidence of 108 cases per 100,000 people.1,2 Tuberculosis meningitis is known to be the most severe form of tuberculosis and is detected in less than 1% of all tuberculosis cases.3 It primarily affects the meninges of the brain and spinal cord along with the adjacent brain parenchyma.1 Tuber- culosis meningitis is a devastating disease because half of the affected patients either die or suffer from permanent sequelae.3 Early diagnosis and treatment is important for better prognoses. However, the diagnosis is often problematic despite significant advances in di- agnostic techniques, resulting in tuberculosis meningitis often only being diagnosed after a substantial delay.4 There are several reasons for a delayed diagnosis of tuberculosis menin- gitis. First, the initial presentation of tuberculosis meningitis may be similar to other types Jinseung Kima*
Si Eun Kimb* Bong Soo Parkc Kyong Jin Shinb Sam Yeol Hab JinSe Parkb Sung Eun Kimb Kang Min Parkb
a Department of Family Medicine, Busan Paik Hospital, Inje University College of Medicine, Busan, Korea Departments of bNeurology and
c Internal Medicine, Haeundae Paik Hospital, Inje University College of Medicine, Busan, Korea
pISSN 1738-6586 / eISSN 2005-5013 / J Clin Neurol 2016;12(3):332-339 / http://dx.doi.org/10.3988/jcn.2016.12.3.332
Received October 16, 2015 Revised December 28, 2015 Accepted December 30, 2015 Correspondence Kang Min Park, MD Department of Neurology, Haeundae Paik Hospital,
Inje University College of Medicine, 875 Haeundae-ro, Haeundae-gu, Busan 48108, Korea
Tel +82-51-797-1195 Fax +82-51-797-1196 E-mail smilepkm@hanmail.net
* These authors contributed equally to this work.
cc This is an Open Access article distributed under the terms of the Creative Commons Attribution Non-Com- mercial License (http://creativecommons.org/licenses/by-nc/3.0) which permits unrestricted non-commercial use, distribution, and reproduction in any medium, provided the original work is properly cited.
JCN
Open Access ORIGINAL ARTICLEKim J et al.
JCN
JCN
Open Accessof meningitis, and it is especially difficult to differentiate from partially treated bacterial meningitis. Second, smear tests for acid-fast bacillus are positive in only 5–30% of pa- tients with tuberculosis meningitis. In addition, cultures of Mycobacterium tuberculosis from the cerebrospinal fluid (CSF) are positive in approximately 50% of cases, and a re- sult takes several weeks to obtain. The detection of Myco- bacterium tuberculosis DNA in the CSF using the poly- merase chain reaction (PCR) is a widely used diagnostic method, but its sensitivity is only 56%.1 Thus, simple and rapid predictors for diagnosing tuberculosis meningitis are needed.
Procalcitonin is a peptide consisting of 116 amino acids and is a calcitonin precursor.5 It is usually synthesized in the thyroid gland.6 However, there is evidence that cells of the monocyte-macrophage system are capable of synthesizing procalcitonin, as well as other nonthyroidal tissues, mostly parenchymal cells, when stimulated by bacterial products.5 During a bacterial infection, the production of procalcitonin is induced by tumor necrosis factor alpha (TNF-α) and in- terleukin 2 (IL-2).7 This makes serum procalcitonin a sensi- tive marker of severe bacterial infection, and many studies have found serum procalcitonin to be the best marker for differentiating bacterial meningitis from viral meningitis.8,9 In addition, there is evidence that measuring the level of pro- calcitonin in the blood is useful for differentiating bacterial pneumonia from tuberculosis and pyogenic spondylodiscitis from tuberculosis spondylodiscitis.2,7,10-12 Moreover, the levels of procalcitonin in the blood and pleural fluid differ signifi- cantly between patients with tuberculosis and nontubercu- losis pleurisy.13 However, no study has investigated whether serum procalcitonin is a useful marker for discriminating between tuberculosis meningitis and bacterial meningitis.
Additionally, no published studies have addressed the value of serum procalcitonin as a predictive factor for the progno- sis of tuberculosis meningitis.
The aim of this study was to elucidate the potential role of serum procalcitonin in differentiating tuberculosis meningi- tis from bacterial and viral meningitis, and in predicting the prognosis of tuberculosis meningitis.
METHODS
Participants
This study was approved by the Institutional Review Board at our institution. It had a retrospective study, and involved patients with a clinical suspicion of tuberculosis meningitis admitted to the neurology departments of two tertiary hos- pitals in Busan, Korea from January 2009 to July 2015. All of the patients had typical clinical histories and laboratory
findings of tuberculosis meningitis. In addition, all patients who were admitted to centers with a clinical suspicion of bac- terial and viral meningitis during the same period were in- cluded as the disease control group for comparisons.
We enrolled patients with tuberculosis meningitis according to the current consensus of the diagnosis and a scoring sys- tem, and classified them into definite and probable tuberculo- sis meningitis.14 The scoring system comprised four parts—
clinical criteria, CSF criteria, cerebral imaging criteria, and evidence of tuberculosis elsewhere—and points were given for variables that were present. Patients were judged to have definite tuberculosis meningitis if Mycobacterium tubercu- losis was identified in their CSF. Patients had probable tu- berculosis meningitis if they scored at least 10 with cerebral imaging results and 12 points without cerebral imaging re- sults.14 In addition, we defined bacterial meningitis based on a combination of the clinical history and laboratory find- ings. These included 1) clinical features, such as the acute onset of headache, fever, and signs of meningeal irritation; 2) positive CSF findings, including pleocytosis (≥5/mm3, mainly neutrophilic), elevated protein concentration (≥45 mg/dL), a reduced ratio of CSF glucose to serum glucose (≤0.60); 3) a negative CSF stain, culture, or PCR for viruses, mycobacte- ria, and fungi; and 4) a positive CSF culture, smear, or PCR for bacterial pathogens or a good specific response to anti- bacterial therapy.15 Moreover, we included patients with vi- ral meningitis. These patients had 1) clinical features, such as the acute onset of headache, fever, and signs of meningeal irritation; 2) no signs of cortical involvement such as altered consciousness, aphasia, or seizures; 3) positive CSF findings including pleocytosis (≥5/mm3, mainly lymphocytic); 4) a negative CSF stain, culture, or PCR for bacteria, mycobacte- ria, and fungi; and 5) a positive PCR for viral pathogens or full recovery without any specific treatments including anti- bacterial or antituberculosis therapy.15 We excluded patients whose blood procalcitonin levels had not been measured.
A total of 26 patients with tuberculosis meningitis met the inclusion criteria for this study (Fig. 1). In addition, we in- cluded 70 patients with bacterial meningitis and 49 patients with viral meningitis as disease control groups. Only 12 of the 26 patients with tuberculosis meningitis had a positive CSF culture, smear, or PCR for Mycobacterium tuberculosis, and they were classified as definite tuberculosis meningitis.
The remaining 14 patients were classified as probable tuber- culosis meningitis.14 Of the 70 patients with bacterial menin- gitis, 41 had a positive CSF culture, smear, or PCR for bac- terial pathogens, comprising 22 with Streptococcus species, 7 with Staphylococcus species, 4 with Klebsiella species, 4 with Listeria species, and 4 with other species. Of the 49 patients with viral meningitis, 23 with viral pathogens were identi-
Procalcitonin in Tuberculosis Meningitis
JCN
fied using PCR of the CSF, comprising 15 with enterovirus, 5 with herpes simplex virus, 2 with herpes zoster virus, and 1 with Epstein-Barr virus.
Measurements
Differences in the demographic and laboratory data among patients with tuberculosis, bacterial, and viral meningitis were analyzed using the demographic profile including age, sex, and diabetes mellitus; blood profile including the white blood cell (WBC) count, platelet count, C-reactive protein (CRP), and procalcitonin; CSF profile including the WBC count, lymphocyte percentage of the total CSF WBC count (lym- phocyte percentage), protein, adenosine deaminase (ADA), and the glucose ratio (CSF/blood); and clinical profile includ- ing systolic and diastolic blood pressures, heart rate, and score on the Glasgow Coma Scale (GCS) at the times of admission and discharge. We analyzed the blood pressure, heart rate, and blood and CSF profiles that were obtained on the day of admission. In addition, we analyzed the predictive factors for the prognosis of tuberculosis meningitis, which was based on the GCS score at discharge, which was used to divide the patients with tuberculosis meningitis into two groups:
good prognosis (GCS score >8) and poor prognosis (GCS score ≤8). Moreover, we analyzed the correlations between the GCS score at discharge and demographic profile includ- ing age; blood profile including the WBC count, platelet count, CRP, and procalcitonin; CSF profile including the WBC count, lymphocyte percentage, protein, ADA, and glucose ratio (CSF/blood); and clinical profile including systolic and diastolic blood pressures, heart rate, and GCS score at ad- mission.
Procalcitonin concentrations were measured using an elec- trical chemiluminescence assay (cobas e 411, Roche Diagnos- tics, Indianapolis, IN, USA), for which the measurement range was 0.05–200 ng/mL.
Statistical analysis
Comparisons were analyzed using the chi-square test for categorical variables and Student’s t-test, Mann-Whitney U-test, analysis of variance, or Kruskal-Wallis test for nu- merical variables. Categorical variables are presented as fre- quency and percentage values. Numerical variables conform- ing to a normal distribution are presented as mean±standard deviation values, while other numerical variables are pre- sented as median and interquartile-range values. In addition, separate bivariate logistic regression models for each tool were used to determine the odds ratios for differentiating tu- berculosis meningitis from bacterial meningitis and tuber- culosis meningitis with a poor prognosis from that with a good prognosis. To perform multivariate analyses and eval- uate the sensitivity and specificity for distinguishing tuber- culosis meningitis from bacterial meningitis, we analyzed the clear cutoff values using the receiver operating character- istic (ROC) curve. The data obtained using ROC curves are presented as 95% confidence interval (CI) and standard error (SE) values. Continuous variables were converted into cate- gorical variables by dichotomizing them in accordance with the clear cutoff values in the logistic regression analysis. The correlation analysis was performed using Spearman’s rank correlation test. Probability values of p<0.05 were considered to be indicative of statistical significance. We set p<0.017 (0.05/3) as significant when comparing the demographic and laboratory differences among the patients with tuberculosis, bacterial, and viral meningitis with multiple corrections in post-hoc analysis. All statistical tests were performed using MedCalc® (version 13, MedCalc Software, Ostend, Belgium).
RESULTS
Differences in measurements among the total participants
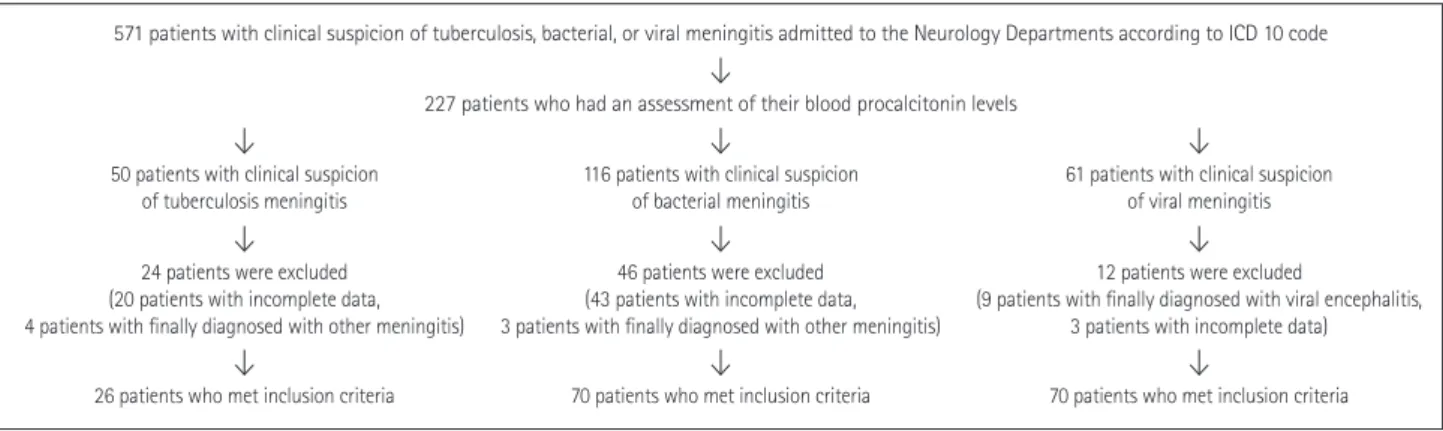
Table 1 compares the demographic and laboratory profiles among the patients with tuberculosis, bacterial, and viral Fig. 1. Selection process for patients with tuberculosis, bacterial, and viral meningitis. ICD: The International Classification of Disease.
227 patients who had an assessment of their blood procalcitonin levels
116 patients with clinical suspicion
of bacterial meningitis 61 patients with clinical suspicion of viral meningitis 50 patients with clinical suspicion
of tuberculosis meningitis
70 patients who met inclusion criteria 70 patients who met inclusion criteria 26 patients who met inclusion criteria
46 patients were excluded (43 patients with incomplete data, 3 patients with finally diagnosed with other meningitis)
12 patients were excluded
(9 patients with finally diagnosed with viral encephalitis, 3 patients with incomplete data) 24 patients were excluded
(20 patients with incomplete data, 4 patients with finally diagnosed with other meningitis)
571 patients with clinical suspicion of tuberculosis, bacterial, or viral meningitis admitted to the Neurology Departments according to ICD 10 code
Kim J et al.
JCN
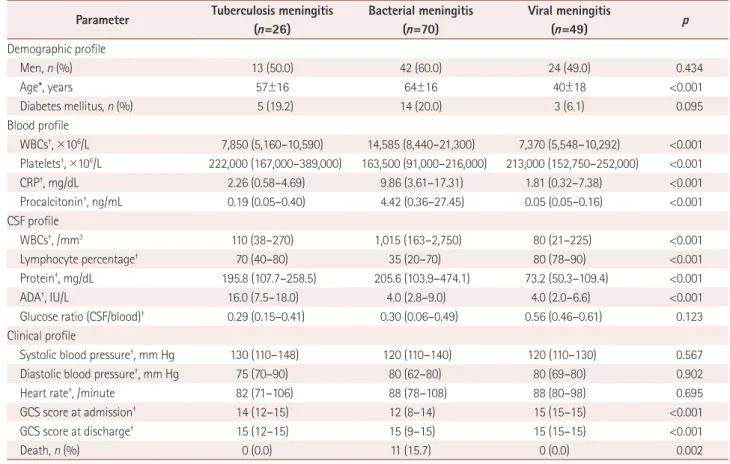
meningitis. The demographic profile including age; the blood profile including the WBC count, platelet count, CRP, and procalcitonin; the CSF profile including the WBC count, lym- phocyte percentage, protein, and ADA; and the clinical pro- file including GCS scores at admission and discharge differed significantly among the patients with tuberculosis, bacterial, and viral meningitis.
In the post-hoc analysis, the patients with tuberculosis men- ingitis had a higher platelet count in blood and GCS score at admission, and a lower WBC count, CRP, and procalcito- nin in the blood, and a lower WBC count, lymphocyte per- centage, and ADA in the CSF than those with bacterial men- ingitis. In addition, the patients with tuberculosis meningitis were older and had higher levels of protein and ADA in the CSF, and lower lymphocyte percentages in the CSF and low- er GCS scores at admission and discharge than those with viral meningitis. However, the level of procalcitonin did not differ significantly between patients with tuberculosis men- ingitis and those with viral meningitis.
Differences in measurements between patients with tuberculosis meningitis and bacterial meningitis The area under the ROC curve (AUC) was 0.784 (95% CI=
0.688–0.862, SE=0.152) for the CRP in the blood, 0.835 (95%
CI=0.746–0.903, SE=0.040) for the procalcitonin level in the blood, 0.782 (95% CI=0.686–0.860, SE=0.047) for the WBC count in the CSF, 0.676 (95% CI=0.567–0.772, SE=0.064) for the lymphocyte percentage in the CSF, and 0.767 (95%
CI=0.659–0.854, SE=0.061) for the ADA in the CSF. Multiple logistic regression analysis showed that a low level of procal- citonin (≤1.27 ng/mL) in the blood and a low WBC count Table 1. Comparison of demographic and laboratory profiles of patients with tuberculosis, bacterial, and viral meningitis
Parameter Tuberculosis meningitis (n=26)
Bacterial meningitis (n=70)
Viral meningitis
(n=49) p
Demographic profile
Men, n (%) 13 (50.0) 42 (60.0) 24 (49.0) 0.434
Age*, years 57±16 64±16 40±18 <0.001
Diabetes mellitus, n (%) 5 (19.2) 14 (20.0) 3 (6.1) 0.095
Blood profile
WBCs†, ×106/L 7,850 (5,160–10,590) 14,585 (8,440–21,300) 7,370 (5,548–10,292) <0.001 Platelets†, ×106/L 222,000 (167,000–389,000) 163,500 (91,000–216,000) 213,000 (152,750–252,000) <0.001
CRP†, mg/dL 2.26 (0.58–4.69) 9.86 (3.61–17.31) 1.81 (0.32–7.38) <0.001
Procalcitonin†, ng/mL 0.19 (0.05–0.40) 4.42 (0.36–27.45) 0.05 (0.05–0.16) <0.001
CSF profile
WBCs†, /mm3 110 (38–270) 1,015 (163–2,750) 80 (21–225) <0.001
Lymphocyte percentage† 70 (40–80) 35 (20–70) 80 (78–90) <0.001
Protein†, mg/dL 195.8 (107.7–258.5) 205.6 (103.9–474.1) 73.2 (50.3–109.4) <0.001
ADA†, IU/L 16.0 (7.5–18.0) 4.0 (2.8–9.0) 4.0 (2.0–6.6) <0.001
Glucose ratio (CSF/blood)† 0.29 (0.15–0.41) 0.30 (0.06–0.49) 0.56 (0.46–0.61) 0.123
Clinical profile
Systolic blood pressure†, mm Hg 130 (110–148) 120 (110–140) 120 (110–130) 0.567
Diastolic blood pressure†, mm Hg 75 (70–90) 80 (62–80) 80 (69–80) 0.902
Heart rate†, /minute 82 (71–106) 88 (78–108) 88 (80–98) 0.695
GCS score at admission† 14 (12–15) 12 (8–14) 15 (15–15) <0.001
GCS score at discharge† 15 (12–15) 15 (9–15) 15 (15–15) <0.001
Death, n (%) 0 (0.0) 11 (15.7) 0 (0.0) 0.002
*Mean±standard deviation, †Median (interquartile range).
ADA: adenosine deaminase, CRP: C-reactive protein, CSF: cerebrospinal fluid, GCS: Glasgow Coma Scale, WBC: white blood cell.
Table 2. Results of the multivariate analysis of variables for distin- guishing tuberculosis meningitis from bacterial meningitis
Independent variable Adjusted odds ratio
95% confidence
interval p
Blood profile
CRP (≤5.5 mg/dL) 7.2 0.91–56.45 0.062
Procalcitonin
(≤1.27 ng/mL) 22.5 1.41–357.37 0.015
CSF profile
WBCs (<630/mm3) 16.1 1.70–152.31 0.001 Lymphocyte percentage
(>50%) 2.38 0.30–18.82 0.411
ADA (>10.8 IU/L) 5.54 0.92–33.24 0.061 ADA: adenosine deaminase, CRP: C-reactive protein, CSF: cerebrospi- nal fluid, WBC: white blood cell.
Procalcitonin in Tuberculosis Meningitis
JCN
(<630/mm3) in the CSF were independently significant vari- ables for predicting tuberculosis meningitis (Table 2). The risk of having tuberculosis meningitis with a low serum level of procalcitonin (≤1.27 ng/mL) was at least 22 times higher than the risk of having bacterial meningitis. These variables have very high sensitivity and negative predictive values, but low specificity and positive predictive values. Compared to the WBC count in the CSF, the level of procalcitonin in the blood had a higher sensitivity [96.2% (95% CI=80.4–99.9%) vs. 92.3% (95% CI=74.9–99.1%)], specificity [62.9% (95%
CI=50.5–74.1%) vs. 57.1% (95% CI=44.8–68.9%)], positive predictive value [49.0% (95% CI=34.8–63.4%) vs. 44.4%
(95% CI=30.9–58.6%)], negative predictive value [97.8%
(95% CI=88.2–99.9%) vs. 95.2% (95% CI=83.8–99.4%)], positive likelihood ratio [2.6 (95% CI=1.9–3.5) vs. 2.2 (95%
CI=1.6–2.9)], and negative likelihood ratio [0.1 (95% CI=
0.0–0.4) vs. 0.1 (95% CI=0.0–0.5)].
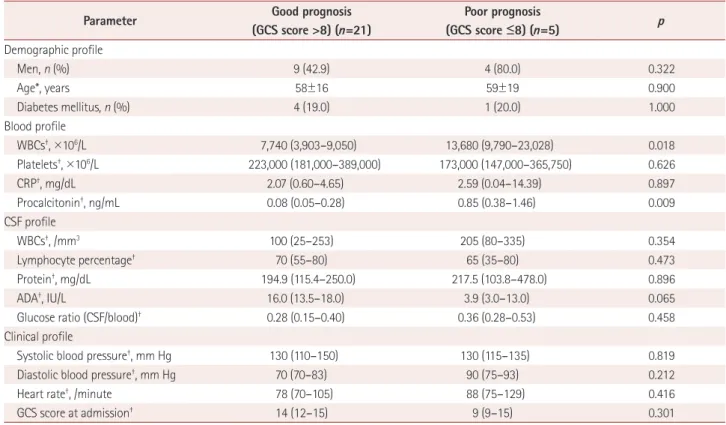
Differences in measurements between tuberculosis meningitis patients with good and poor prognoses Of the 26 patients with tuberculosis meningitis, 21 had a good prognosis (GCS score >8 at discharge) and 5 had a poor prognosis. The WBC count and procalcitonin in the blood were higher in patients with a poor prognosis than those with a good prognosis (Table 3). The AUC was 0.848 (95%
CI=0.653–0.957, SE=0.124) for the WBC count in the blood and 0.876 (95% CI=0.688–0.972, SE=0.097) for the procal- citonin level in the blood. Multiple logistic regression anal- ysis showed that only a high level of procalcitonin (>0.4 ng/
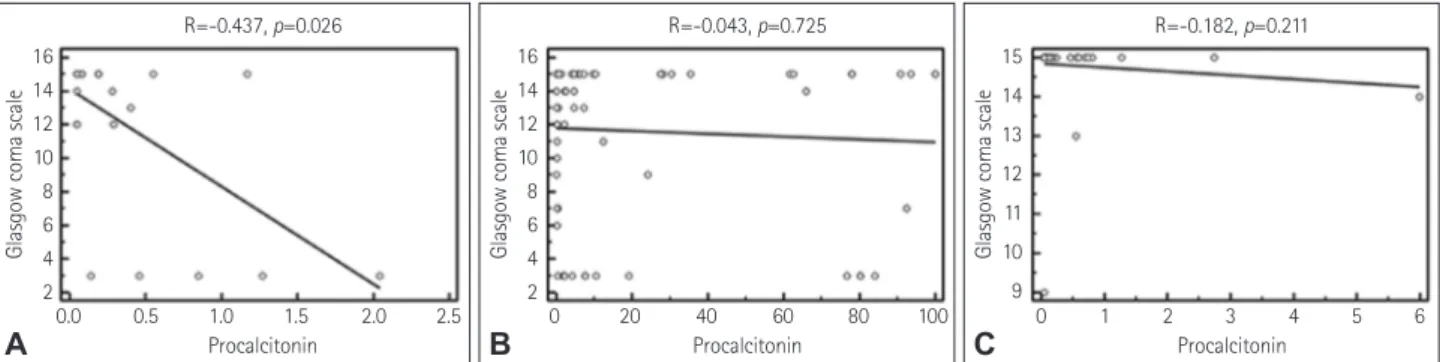
mL) in the blood was an independent and significant pre- dictor of a poor prognosis in patients with tuberculosis men- ingitis (Table 4). The risk of having a poor prognosis in pa- tients with tuberculosis meningitis with a high serum level of procalcitonin (>0.4 ng/mL) was at least 20 times higher than for those with a good prognosis. The level of procalcito- nin (r=-0.437, p=0.026), diastolic blood pressure (r=-0.493, p=0.010), and heart rate (r=-0.471, p=0.015) in patients with tuberculosis meningitis were negatively correlated with the GCS score at discharge (Fig. 2A). In addition, there was a positive correlation between the GCS scores at admission and discharge (r=0.439, p=0.025). However, age (r=-0.154,
Table 3. Comparison of demographic and laboratory profiles between tuberculosis meningitis patients with good and poor prognoses
Parameter Good prognosis
(GCS score >8) (n=21)
Poor prognosis
(GCS score ≤8) (n=5) p
Demographic profile
Men, n (%) 9 (42.9) 4 (80.0) 0.322
Age*, years 58±16 59±19 0.900
Diabetes mellitus, n (%) 4 (19.0) 1 (20.0) 1.000
Blood profile
WBCs†, ×106/L 7,740 (3,903–9,050) 13,680 (9,790–23,028) 0.018
Platelets†, ×106/L 223,000 (181,000–389,000) 173,000 (147,000–365,750) 0.626
CRP†, mg/dL 2.07 (0.60–4.65) 2.59 (0.04–14.39) 0.897
Procalcitonin†, ng/mL 0.08 (0.05–0.28) 0.85 (0.38–1.46) 0.009
CSF profile
WBCs†, /mm3 100 (25–253) 205 (80–335) 0.354
Lymphocyte percentage† 70 (55–80) 65 (35–80) 0.473
Protein†, mg/dL 194.9 (115.4–250.0) 217.5 (103.8–478.0) 0.896
ADA†, IU/L 16.0 (13.5–18.0) 3.9 (3.0–13.0) 0.065
Glucose ratio (CSF/blood)† 0.28 (0.15–0.40) 0.36 (0.28–0.53) 0.458
Clinical profile
Systolic blood pressure†, mm Hg 130 (110–150) 130 (115–135) 0.819
Diastolic blood pressure†, mm Hg 70 (70–83) 90 (75–93) 0.212
Heart rate†, /minute 78 (70–105) 88 (75–129) 0.416
GCS score at admission† 14 (12–15) 9 (9–15) 0.301
*Mean±standard deviation, †Median (interquartile range).
ADA: adenosine deaminase, CRP: C-reactive protein, CSF: cerebrospinal fluid, GCS: Glasgow Coma Scale, WBC: white blood cell.
Table 4. Results of the multivariate analysis of variables that are predictive of a poor prognosis in tuberculosis meningitis patients
Independent variable Adjusted odds ratio
95% confidence interval p Blood profile
WBCs (>10,430×106/L) 11.8 0.63–220.61 0.099 Procalcitonin (>0.4 ng/mL) 20.4 1.11–374.06 0.043 WBC: white blood cell.
Kim J et al.
JCN
p=0.453), systolic blood pressure (r=-0.267, p=0.187), blood profile including WBC count (r=-0.376, p=0.058), platelet count (r=0.0397, p=0.847), and CRP (r=-0.0515, p=0.803), CSF profile including WBC count (r=0.167, p=0.425), lym- phocyte percentage (r=0.029, p=0.897), ADA (r=0.189, p=
0.375), and protein (r=0.309, p=0.142), and glucose ratio (CSF/
blood) (r=0.154, p=0.474) were not correlated with the GCS score at discharge. In addition, the levels of procalcitonin in patients with bacterial and viral meningitis were not corre- lated with the GCS score at discharge (r=-0.043, p=0.725 and r=-0.182, p=0.211, respectively) (Fig. 2B and C).
DISCUSSION
This study was the first to investigate the usefulness of the se- rum procalcitonin level as a diagnostic and prognostic factor for tuberculosis meningitis. We found that the level of pro- calcitonin in the blood at admission was lower in patients with tuberculosis meningitis than in those with bacterial meningitis. Moreover, we identified that a high level of pro- calcitonin in the blood at admission was an independent sig- nificant predictor of a low GCS score at discharge in patients with tuberculosis meningitis. In addition, the level of procal- citonin in the blood at admission in patients with tuberculo- sis meningitis was negatively correlated with the GCS score at discharge. These results suggest that serum procalcitonin is a useful marker for the diagnosis and prognosis prediction of tuberculosis meningitis at the initial diagnosis stage.
We found that the blood profile including the WBC count and CRP and the CSF profile including the WBC count, lymphocyte percentage, and ADA differed significantly be- tween patients with tuberculosis and patients with bacterial meningitis. This finding is in agreement with those of pre- vious studies.16 In addition to these findings, we have dem- onstrated that the level of procalcitonin in the blood differs between patients with tuberculosis meningitis and patients with bacterial meningitis. The high sensitivity and negative
predictive value for differentiating the diagnoses of tuber- culosis meningitis and bacterial meningitis suggest a sup- plementary role for serum procalcitonin in the diagnostic exclusion of tuberculosis meningitis from bacterial menin- gitis in countries where tuberculosis is endemic, such as the Republic of Korea. This result is consistent with previous studies that demonstrated the utility of serum procalcitonin for differentiating pulmonary tuberculosis from bacterial pneumonia.7,10-12 The reason why the level of procalcitonin in the blood remains relatively low in tuberculosis meningitis is unclear. The cascade of inflammatory cytokines released during a systemic infection may determine the rate and in- tensity of procalcitonin synthesis and release, thus account- ing for differences observed in the blood levels of procalcito- nin. This cascade is probably greater in bacterial meningitis than tuberculosis meningitis.12 The elevated levels of TNF-α and interferon-gamma (IFN-γ) produced during mycobac- terial infection play key roles in the cellular host response in the immunopathogenesis of tuberculosis meningitis.1 The production of procalcitonin is induced by TNF-α but inhib- ited by IFN-γ.7,17,18 Therefore, serum procalcitonin seems to increase only moderately in patients with tuberculosis men- ingitis, in contrast to bacterial meningitis, during which the production of procalcitonin is induced by TNF-α and IL-2.7,19 Interestingly, we found that serum procalcitonin was a bet- ter marker than CRP for differentiating tuberculosis menin- gitis from bacterial meningitis. CRP is also an inflammato- ry marker and an acute-phase protein released by the liver after the onset of inflammation or tissue damage.20 Howev- er, CRP is neither highly specific nor sensitive for bacterial infections because it can remain present at low concentrations in bacterial infections and can be significantly increased in viral infections.20 In addition, increases in procalcitonin oc- cur more rapidly than increases in CRP—a previous study detected procalcitonin in the plasma at 2 hours after inject- ing endotoxins, with its concentration increasing to reach a plateau after approximately 12 hours, whereas CRP was de-
Fig. 2. Results of the correlation analysis. A negative correlation between the serum procalcitonin level and Glasgow Coma Scale score at dis- charge is identified in patients with tuberculosis meningitis (A), whereas no significant correlation is identified between these parameters in pa- tients with bacterial (B), or viral (C) meningitis.
Glasgow coma scale
0.0 0.5 1.0 1.5 2.0 2.5 R=-0.437, p=0.026
Procalcitonin 16
14 12 10 8 6 4 2
A
Glasgow coma scale
0 20 40 60 80 100 R=-0.043, p=0.725
Procalcitonin 16
14 12 10 8 6 4 2
B
Glasgow coma scale
0 1 2 3 4 5 6 R=-0.182, p=0.211
Procalcitonin 15
14 13 12 11 10 9
C
Procalcitonin in Tuberculosis Meningitis
JCN
tected in the plasma after 12 hours and reached a plateau after 20–72 hours.21
Previous studies found that the serum procalcitonin level was higher in bacterial meningitis than in viral meningitis.8,9 However, no previous study has investigated differences in the serum procalcitonin levels between patients with tuber- culosis and viral meningitis. We found that the serum pro- calcitonin level in patients with tuberculosis meningitis did not differ significantly from that in patients with viral men- ingitis, although there was a strong tendency. These findings suggest that serum procalcitonin is not a useful marker for discriminating between tuberculosis meningitis and viral meningitis.
Several studies have investigated factors related to the prognosis of patients with tuberculosis meningitis.1,3,22-24 In most of these studies, the stage of disease emerged as the single most important factor associated with mortality.1,23 It has also been demonstrated that low levels of glucose and high levels of protein in the CSF are associated with poor outcomes.23 Recent studies found that the presence of altered consciousness, diabetes mellitus, immunosuppression, neu- rological deficit, hydrocephalus, and vasculitis predicted unfavorable outcomes in patients with tuberculosis menin- gitis.3,22 In addition to these findings, our study demonstrated that serum procalcitonin is a good predictor for the prog- nosis of tuberculosis meningitis. Although the serum level of procalcitonin was lower in tuberculosis meningitis than in bacterial meningitis, we found that a relatively high level of procalcitonin in the blood suggests a poor prognosis in tuberculosis meningitis patients. This was consistent with previous findings that the level of procalcitonin in the blood was a good predictor of the severity of pneumonia and sep- sis.10 Another previous study found that the level of procal- citonin in the blood differed significantly between survivors and nonsurvivors in patients with sepsis and cardiac sur- gery with cardiopulmonary bypass.25 Moreover, our results are in line with another study regarding pulmonary tuber- culosis, which showed that the risks of mortality and the presence of disseminated tuberculosis increased with the level of procalcitonin in the blood.6,26 Another study found that the level of procalcitonin in the blood was also related to the severity of bacterial meningitis.27 However, the exact mechanisms underlying the synthesis of procalcitonin and its role in infectious diseases remain unknown. The cascade of inflammatory cytokines released during infection may determine the intensities of procalcitonin synthesis and re- lease, and thus the increase in procalcitonin in infectious dis- ease may be ascribed to the inflammatory response and cyto- kines, which might be related to poor prognoses.6,12 Further research may be needed to fully elucidate these features.
This study was subject to several limitations. First, it had a retrospective design, and it involved a relatively small sample, which was due to the inclusion of only patients for whom blood levels of procalcitonin had been assessed at admission.
Second, although radiologic characteristics such as hydro- cephalus and tuberculoma may aid in the prognosis predic- tion of tuberculosis meningitis, we did not include these de- termining factors in the analysis performed for the study protocol.1,28 Third, due to the smallness of the sample we did not restrict the diagnostic criteria to a microbiological con- firmation, instead also enrolling those with probable tuber- culosis meningitis. Fourth, we did not confirm the long-term prognoses, only analyzing the prognoses at the time of dis- charge.
In conclusion, we found that serum procalcitonin is a use- ful marker for differentiating tuberculosis meningitis from bacterial meningitis, and that a higher level of procalcitonin is an independent and significant predictor of a poor prog- nosis in patients with tuberculosis meningitis. These results suggest that measuring the serum procalcitonin level is use- ful for the diagnosis and prognosis prediction of tuberculosis meningitis at the initial diagnosis stage.
Conflicts of Interest
The authors have no financial conflicts of interest.
Acknowledgements
The study was supported by Busan Ulsan Gyeongnam Neurodegenera- tive Disease Imaging Association.
REFERENCES
1. Garg RK. Tuberculous meningitis. Acta Neurol Scand 2010;122:75-90.
2. Yoon YK, Jo YM, Kwon HH, Yoon HJ, Lee EJ, Park SY, et al. Differ- ential diagnosis between tuberculous spondylodiscitis and pyogenic spontaneous spondylodiscitis: a multicenter descriptive and com- parative study. Spine J 2015;15:1764-1771.
3. Erdem H, Ozturk-Engin D, Tireli H, Kilicoglu G, Defres S, Gulsun S, et al. Hamsi scoring in the prediction of unfavorable outcomes from tu- berculous meningitis: results of Haydarpasa-II study. J Neurol 2015;
262:890-898.
4. Joosten AA, van der Valk PD, Geelen JA, Severin WP, Jansen Steur EN. Tuberculous meningitis: pitfalls in diagnosis. Acta Neurol Scand 2000;102:388-394.
5. Prat C, Domínguez J, Andreo F, Blanco S, Pallarés A, Cuchillo F, et al. Procalcitonin and neopterin correlation with aetiology and sever- ity of pneumonia. J Infect 2006;52:169-177.
6. Huang CT, Lee LN, Ho CC, Shu CC, Ruan SY, Tsai YJ, et al. High se- rum levels of procalcitonin and soluble TREM-1 correlated with poor prognosis in pulmonary tuberculosis. J Infect 2014;68:440-447.
7. Huang SL, Lee HC, Yu CW, Chen HC, Wang CC, Wu JY, et al. Value of procalcitonin in differentiating pulmonary tuberculosis from oth- er pulmonary infections: a meta-analysis. Int J Tuberc Lung Dis 2014;
18:440-447.
8. Viallon A, Zeni F, Lambert C, Pozzetto B, Tardy B, Venet C, et al.
High sensitivity and specificity of serum procalcitonin levels in adults with bacterial meningitis. Clin Infect Dis 1999;28:1313-1316.
9. Dubos F, Moulin F, Gajdos V, De Suremain N, Biscardi S, Lebon P, et
Kim J et al.
JCN
al. Serum procalcitonin and other biologic markers to distinguish between bacterial and aseptic meningitis. J Pediatr 2006;149:72-76.
10. Kang YA, Kwon SY, Yoon HI, Lee JH, Lee CT. Role of C-reactive pro- tein and procalcitonin in differentiation of tuberculosis from bacterial community acquired pneumonia. Korean J Intern Med 2009;24:337- 11. Niu WY, Wan YG, Li MY, Wu ZX, Zhang LG, Wang JX. The diagnos-342.
tic value of serum procalcitonin, IL-10 and C-reactive protein in com- munity acquired pneumonia and tuberculosis. Eur Rev Med Pharma- col Sci 2013;17:3329-3333.
12. Nyamande K, Lalloo UG. Serum procalcitonin distinguishes CAP due to bacteria, Mycobacterium tuberculosis and PJP. Int J Tuberc Lung Dis 2006;10:510-515.
13. Cakir E, Deniz O, Ozcan O, Tozkoparan E, Yaman H, Akgul EO, et al. Pleural fluid and serum procalcitonin as diagnostic tools in tuber- culous pleurisy. Clin Biochem 2005;38:234-238.
14. Marais S, Thwaites G, Schoeman JF, Török ME, Misra UK, Prasad K, et al. Tuberculous meningitis: a uniform case definition for use in clin- ical research. Lancet Infect Dis 2010;10:803-812.
15. Ropper AH, Samuels MA, Klein J. Adams and Victor’s Principles of Neu- rology. 10th ed. Columbus: McGraw-Hill Education, 2014;697-777.
16. Thwaites GE, Chau TT, Stepniewska K, Phu NH, Chuong LV, Sinh DX, et al. Diagnosis of adult tuberculous meningitis by use of clinical and laboratory features. Lancet 2002;360:1287-1292.
17. Assicot M, Gendrel D, Carsin H, Raymond J, Guilbaud J, Bohuon C.
High serum procalcitonin concentrations in patients with sepsis and infection. Lancet 1993;341:515-518.
18. Linscheid P, Seboek D, Schaer DJ, Zulewski H, Keller U, Müller B.
Expression and secretion of procalcitonin and calcitonin gene-relat- ed peptide by adherent monocytes and by macrophage-activated ad-
ipocytes. Crit Care Med 2004;32:1715-1721.
19. Maruna P, Nedelníková K, Gürlich R. Physiology and genetics of procalcitonin. Physiol Res 2000;49 Suppl 1:S57-S61.
20. van Rossum AM, Wulkan RW, Oudesluys-Murphy AM. Procalcito- nin as an early marker of infection in neonates and children. Lancet Infect Dis 2004;4:620-630.
21. Dandona P, Nix D, Wilson MF, Aljada A, Love J, Assicot M, et al.
Procalcitonin increase after endotoxin injection in normal subjects. J Clin Endocrinol Metab 1994;79:1605-1608.
22. Alarcón F, Moreira J, Rivera J, Salinas R, Dueñas G, Van den Ende J.
Tuberculous meningitis: do modern diagnostic tools offer better prog- nosis prediction? Indian J Tuberc 2013;60:5-14.
23. Hosoglu S, Geyik MF, Balik I, Aygen B, Erol S, Aygencel TG, et al.
Predictors of outcome in patients with tuberculous meningitis. Int J Tuberc Lung Dis 2002;6:64-70.
24. Hosoğlu S, Ayaz C, Geyik MF, Kökoğlu OF, Ceviz A. Tuberculous meningitis in adults: an eleven-year review. Int J Tuberc Lung Dis 1998;
2:553-557.
25. Ruokonen E, Ilkka L, Niskanen M, Takala J. Procalcitonin and neop- terin as indicators of infection in critically ill patients. Acta Anaesthe- siol Scand 2002;46:398-404.
26. Rasmussen TA, Søgaard OS, Camara C, Andersen PL, Wejse C. Serum procalcitonin in pulmonary tuberculosis. Int J Tuberc Lung Dis 2011;
15:251-256.
27. Hu R, Gong Y, Wang Y. Relationship of serum procalcitonin levels to severity and prognosis in pediatric bacterial meningitis. Clin Pediatr (Phila) 2015;54:1141-1144.
28. Chiang SS, Khan FA, Milstein MB, Tolman AW, Benedetti A, Starke JR, et al. Treatment outcomes of childhood tuberculous meningitis: a sys- tematic review and meta-analysis. Lancet Infect Dis 2014;14:947-957.