Tuberc Respir Dis 2013;74:56-62
CopyrightⒸ2013. The Korean Academy of Tuberculosis and Respiratory Diseases. All rights reserved.
Relation of Pulmonary Function Impairment and Coronary Artery Calcification by Multi-detector Computed Tomography in Group Exposed to Inorganic Dusts
Won-Jeong Lee, Ph.D., Jae Hoon Shin, M.P.H., So Young Park, M.D.
Occupational Lung Diseases Institute, Korea Workers' Compensation and Welfare Service (KCOMWEL), Ansan, Korea
Background: The purpose of this study was to evaluate the relationship of pulmonary function impairment (PFI) and coronary artery calcification (CAC) by multi-detector computed tomography (MDCT), and the effect of pneumoconiosis on CAC or PFI.
Methods: Seventy-six subjects exposed to inorganic dusts underwent coronary artery calcium scoring by MDCT, spirometry, laboratory tests, and a standardized questionnaire. CAC was quantified using a commercial software (Rapidia ver. 2.8), and all the subjects were divided into two categories according to total calcium scores (TCSs), either the non-calcified (<1) or the calcified (≥1) group. Obstructive pulmonary function impairment (OPFI) was defined as forced expiratory volume in one second/forced vital capacity (FEV
1/FVC, %)<70, and as FEV
1/FVC (%)≥70 and FVC<80 for restrictive pulmonary function impairment (RPFI) by spirometry. All subjects were classified as either the case (profusion≥1/0) or the control (profusion≤0/1) group by pneumoconiosis findings on simple digital radiograph.
Results: Of the 76 subjects, 35 subjects (46.1%) had a CAC. Age and hypertension were different significantly between the non-calcified and the calcified group (p<0.05). Subjects with pneumoconiosis were more frequent in the calcified group than those in the non-calcified group (p=0.099). FEV
1/FVC (%) was significantly correlated with TCSs (r=−0.316, p=0.005). Subjects with OPFI tended to increase significantly with increasing of TCS (4.82, p=0.028), but not significantly in RPFI (2.18, p=0.140). Subjects with OPFI were significantly increased in the case group compared to those in the control group.
Conclusion: CAC is significantly correlated with OPFI, and CAC and OPFI may be affected by pneumoconiosis findings.
Key Words: Coronary Vessels; Vascular Calcification; Spirometry; Pneumoconiosis; Pulmonary Function Tests
Address for correspondence: Won-Jeong Lee, Ph.D.
Occupational Lung Diseases Institute, Korea Workers' Compensation and Welfare Service (KCOMWEL), 87, Guryong-ro, Sangnok-gu, Ansan 426-858, Korea Phone: 82-31-500-1806, Fax: 82-31-500-1811 E-mail: atomlwj@daum.net
Received: Aug. 23, 2012 Revised: Sep. 21, 2012 Accepted: Jan. 14, 2013
CCIt is identical to the Creative Commons Attribution Non-Commercial License (http://creativecommons.org/licenses/by-nc/3.0/).
Introduction
The presence and extent of coronary artery calcifica- tion (CAC) has been shown to correlate with the degree of atherosclerosis
1. Since the quantification of CAC by
ultrafast computed tomography has been reported for the first time by Agatston et al.
2, several studies showed that calcium scoring of multi-detector computed tomog- raphy (MDCT calcium scoring) is a very useful screen- ing method to detect atherosclerosis in the early stage
3and CAC is could be considered as an independent pre- dictor of atherosclerosis
4-6.
Occupational exposure to dusts, toxic particles, and
gas could induce pulmonary function impairment (PFI)
7and increase the risk of death by cardiovascular diseases
including atherosclerosis
8-10. In addition, the prevalence
of CAC was higher than that of other findings on low
dose chest CT images to screen lung diseases in the
group exposed to dusts in Korea
11.
Although PFI was significantly associated with ische- mic heart diseases
12,13, the relationship of PFI and CAC quantified by MDCT has not yet been fully clarified
14,15. Also, to the best of our knowledge, the relationship be- tween PFI and CAC measured by MDCT has not been studied in the group exposed to dusts.
Therefore, the purpose of this study was to evaluate the relationship of PFI and CAC quantified by MDCT, and the effect of pneumoconiosis on CAC or PFI.
Materials and Methods 1. Subjects
From April 5, 2010 to July 9, 2010, MDCT calcium scoring was performed on 115 subjects who exposed to inorganic dusts. Then, these subjects were matched with spirometry, laboratory, and questionnaire data col- lected during same period in the cohort of occupational dust exposure worker. All examinations were per- formed after being approved by the Institutional Review Board, and obtained the informed consent from all subjects. Of 115 subjects with MDCT calcium scoring, only 79 subjects were analyzed for this study except 39 subjects who had history of cardiovascular disease, such as myocardial infarction, stroke, and cerebral hemor- rhage, or who didn't match with cohort of occupational dust exposure worker, or who had large opacity on dig- ital chest imaging.
2. Risk assessment of cardiovascular diseases 1) Questionnaire and physical measurements: Re- searchers had interviews directly with the subjects using structured questionnaire to obtain general characteristics of the subjects and the risk factors of cardiovascular dis- eases that were already known (age, smoking history, duration of inorganic dust exposure, heart diseases, dia- betes, hypertension, stroke, etc.). Body mass index (kg/m
2) was calculated from height and weight that were measured without wearing shoes. Hypertension was de- fined when the systolic and diastolic blood pressure measured by trained nurses (rest for more than 10 mi- nutes prior to measurement and then measure in a sitting
position) was more than 140 mm Hg and 90 mm Hg, respectively, or when administering antihypertensive drugs. All the subjects were classified into either the control group or the case group (small opacity profu- sion≥1/0) by consensus reading of two chest radiol- ogists for pneumoconiosis based upon digital chest imaging (produced by Digital Diagnost, Philips, Nether- lands).
2) MDCT calcium scoring: MDCT calcium scoring was performed based on the protocol generally applied in clinical practice (ECG-gated, 55 mAs, 120 kVp, 3-mm thickness, 8×3 mm acquisition) without use of contrast medium using a 16-slice MDCT (Brilliance 16 slice;
Philips, Netherlands). Row images scanned were trans- ferred to a special workstation, and then CAC was quan- tified at each coronary artery using commercial software (Rapidia version 2.8; Infinitt Healthcare, Seoul, Korea).
CAC was defined as the area with more than 130 houns- field units of attenuation coefficient according to the Agatston's method
2. All subjects were classified into ei- ther the non-calcified group (total calcium score [TCS]
<1) or the calcified group (TCS≥1) from TCSs of coro- nary artery (TCSs)
6, TCSs were further categorized into three score ranks: <1, 1–400, >400, as risk strat- ifications for coronary artery disease.
3) Analysis of cardiovascular risk factor in serum:
Blood collection was conducted after fasting for 8 hours. Serum was seperated within 1 hour and stored at −80
oC until analysis. Serum concentrations of total cholesterol, low density lipoprotein (LDL)-cholesterol, high density lipoprotein (HDL)-cholesterol, creatinine, and C-reactive protein (CRP) were determined by auto- matic immunochemistry analyzer (Hitachi 7080; Hitachi, Tokyo, Japan).
4) Spirometry: Spirometry were performed according
to the American Thoracic Society (ATS) and Europe
Respiratory Society (ERS) guidelines
16using a spirom-
eter (Vmax-229; Viasys Healthcare, Yorba Linda, CA,
USA). Prior to spirometry, the spiromete was calibrated
to be ranged between 2.91 and 3.09 L in air volume
that was measured both gradually for 6 seconds and
quickly for 0.5–1 seconds using 3 L-syringe. Past and
current medical history and health condition of the sub- jects were confirmed and then closed circulatory meth- od was carried out in a sitting position on a chair with straightened upper body, slightly raised chin, and slight hold the neck back with nose clip on. Spirometry was carried out 8–10 minutes later, after inhalation 4 times sequentially (400μg) the bronchodialator containing salbutamol (ventolin). The suitable test was performed more than 3 times and then the best values were se- lected among the values that the forced vital capacity (FVC % predicted value) and forced expiratory volume in one second (FEV
1% predicted value) of each test were within 5% (150 mL) each other (best value meth- od). FVC and FEV
1were measured based on sex, height, and weight of subjects applying Moris equation and then expressed as the ratio of actual values regard- ing predicted values, then the ratio of FEV
1on the FVC (FEV
1/FVC % predicted value) was calculated. Obstruc- tive pulmonary function impairment (OPFI) was defined as FEV
1/FVC (%)<70, and as FEV
1/FVC (%)≥70 and FVC<80 for restrictive pulmonary function impairment (RPFI). The OPFI was classified into three categories ac- cording to severity as a results of spirometry: nor- mal=FEV
1/FVC≥70%; mild=OPFI & FEV
1≥80%; moder- ate=OPFI & 50%≤FEV
1<80%
7.
3. Statistical analysis
Statistical analysis was performed by chi-square test for categorical variables and Student's t-test for con- tinuous variables using SPSS version 19.0 (SPSS Inc., Chicago, IL, USA). Relation of RPFI or OPFI with grad- ing of TCSs was performed by linear by linear associa- tion of chi-square test. Relationship of TCSs and FEV
1/FVC (%) was calculated by Pearson correlation analysis. p-values less than 0.05 were considered stat- istically significant.
Results
1. Comparison of general characteristic and risk fac- tors between non-calcified and calcified groups Mean age and dust exposure duration of the subjects
were 61.7±8.4 years old (range, 45.0–81.9 years) and 18.8 years (range, 4.5–44.0 years), respectively. Mean body mass index of the subjects were 23.9±3.2 kg/m
2(range, 15.4–30.5 kg/m
2), and smokers including for- mer smokers were 90.8%.
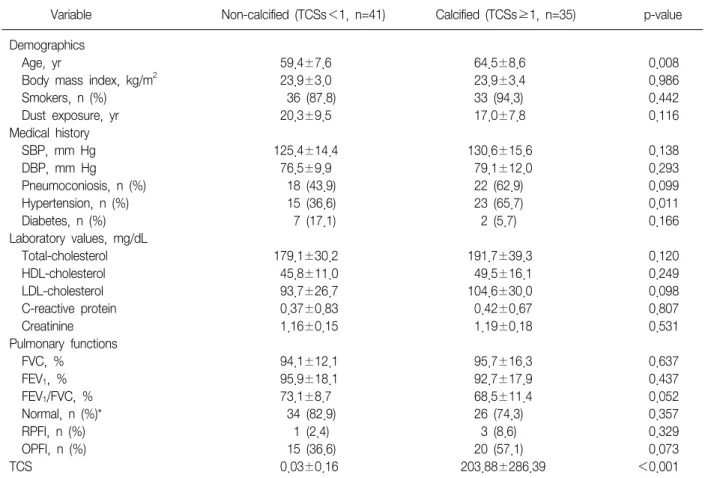
Total 35 (46.1%) of 76 subjects had a CAC (Table 1).
Age, hypertension, and TCSs were statistically significant differences between the non-calcified and the calcified groups (p<0.05), and pneumoconiosis, LDL-cholester- ol, FEV
1/FVC (%), and OPFI showed marginally sig- nificant differences between the two groups. Additional- ly, smokers, systolic and diastolic blood pressure, total cholesterol, HDL-cholesterol, CRP, creatinine, and RPFI were higher in the calcified group compared to the non-calcified group, but indicating that the differences were not statistically significant. Subjects with normal pulmonary functions in the non-calcified group were more than those in the calcified group (p=0.357).
2. Relationship of pulmonary functions and TCSs As shown in Figure 1, TCSs significantly decreased as the FEV
1/FVC (%) increased (r=−0.316, p=0.005).
However, TCSs or FEV
1/FVC (%) was not significantly correlated with CRP (data is not presented).
Figure 2 illustrates the frequency of subjects with RPFI or OPFI according to the 3 categories of TCSs. The frequency of subjects with OPFI tended to increase sig- nificantly with the increase of categories of TCSs (4.82, p=0.028), but not significant in RPFI (2.18, p=0.140).
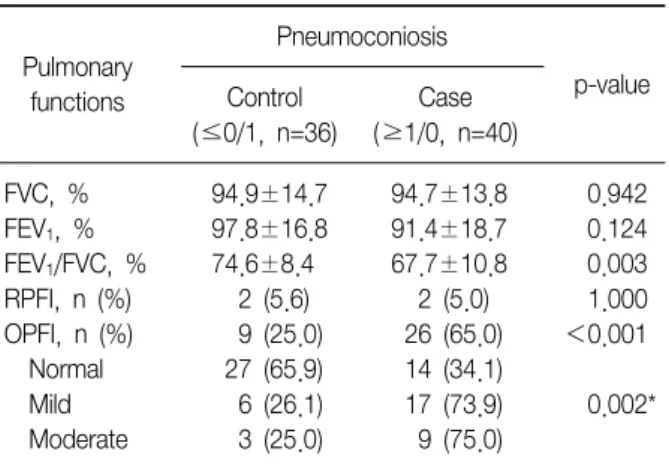
3. Pulmonary functions according to pneumoconiosis findings
Table 2 shows the pulmonary functions comparing between the control and the case groups for pneumo- coniosis. FEV
1/FVC (%) of the control group was sig- nificantly higher compared to the case group (p=0.003), and also FEV
1(%) was higher in the control group than in the case group (p=0.124). The frequency of subjects with OPFI was significantly higher in the case group than in the control group (65.0% vs. 25.0%, p<0.001).
The frequency of the case group was significantly in-
creased, as OPFI was severe (p=0.002).
Table 1. Comparison of general characteristics and risk factors between the non-calcified and calcified group at the coro- nary artery
Variable Non-calcified (TCSs<1, n=41) Calcified (TCSs≥1, n=35) p-value
Demographics
Age, yr 59.4±7.6 64.5±8.6 0.008
Body mass index, kg/m2 23.9±3.0 23.9±3.4 0.986
Smokers, n (%) 36 (87.8) 33 (94.3) 0.442
Dust exposure, yr 20.3±9.5 17.0±7.8 0.116
Medical history
SBP, mm Hg 125.4±14.4 130.6±15.6 0.138
DBP, mm Hg 76.5±9.9 79.1±12.0 0.293
Pneumoconiosis, n (%) 18 (43.9) 22 (62.9) 0.099
Hypertension, n (%) 15 (36.6) 23 (65.7) 0.011
Diabetes, n (%) 7 (17.1) 2 (5.7) 0.166
Laboratory values, mg/dL
Total-cholesterol 179.1±30.2 191.7±39.3 0.120
HDL-cholesterol 45.8±11.0 49.5±16.1 0.249
LDL-cholesterol 93.7±26.7 104.6±30.0 0.098
C-reactive protein 0.37±0.83 0.42±0.67 0.807
Creatinine 1.16±0.15 1.19±0.18 0.531
Pulmonary functions
FVC, % 94.1±12.1 95.7±16.3 0.637
FEV1, % 95.9±18.1 92.7±17.9 0.437
FEV1/FVC, % 73.1±8.7 68.5±11.4 0.052
Normal, n (%)* 34 (82.9) 26 (74.3) 0.357
RPFI, n (%) 1 (2.4) 3 (8.6) 0.329
OPFI, n (%) 15 (36.6) 20 (57.1) 0.073
TCS 0.03±0.16 203.88±286.39 <0.001
Smokers included former smokers. Obstructive pulmonary function impairment (OPFI) was defined as forced expiratory volume in one second/forced vital capacity (FEV1/FVC, %)<70, and as FEV1/FVC (%)≥70 and FVC<80 for restrictive pulmonary function impair- ment (RPFI) by spirometry. Statistical analysis was performed by the chi-square test for categorical variables and Student's t-test for continuous variables.
*FVC & FEV1≥80%.
TCSs: total calcium scores; SBP: systolic blood pressure; DBP: diastolic blood pressure; HDL: high-density lipoprotein; LDL: low-den- sity lipoprotein.
Discussion
The atherosclerosis is independently predicted by CAC of MDCT which is closely associated with PFI
15. To our knowledge, the current study is the first in evalu- ating the relationship of MDCT calcium scoring and PFI in group exposed to inorganic dusts. In this study CAC showed in 46.1% of subjects, this may be because they had many risk factors of atherosclerosis, such as old age and dust exposed group. Age and hypertension known as risk factors from previous studies were significantly higher in the calcified group compared to the non-calci-
fied group, and FEV
1/FVC (%) and OPFI were higher in the calcified group.
We found new findings that the subjects with pneu- moconiosis showed high frequency in the calcified group than in non-calcified group, but our study had not sufficient sample size to clarify whether the pneu- moconiosis is the risk of CAC. Therefore, the future needs the prospective study with large sample size and test power.
FEV
1(%) and FEV
1/FVC (%) are utilized as indicators
of PFI, which can be classified into RPFI (related to in-
terstitial lung diseases) and OPFI (related to chronic
Figure 1. Scatterplot shows that relationship of forced ex- piratory volume in one second/forced vital capacity (FEV
1/FVC, %) and total calcium score. FEV
1/FVC (%) was significantly correlated with total calcium score.
Pearson's correlation coefficient was −0.316 (p=0.005).
Figure 2. Percentage of subjects with obstructive pulmo- nary function impairment (OPFI) tended to increase sig- nificantly according to the increase of categories of total calcium score (4.82, p=0.028), but not significant in re- strictive pulmonary function impairment (RPFI; 2.18, p=0.140), by calculating the linear by linear association of chi-square test. RPFI was defined as forced expiratory volume in one second/forced vital capacity (FEV
1/FVC, %)
≥70 and FVC<80, and as FEV
1/FVC (%)<70 for OPFI by spirometry.
Table 2. Comparison of pulmonary functions between the control and case group for pneumoconiosis
Pulmonary functions
Pneumoconiosis
p-value Control
(≤0/1, n=36)
Case (≥1/0, n=40)
FVC, % 94.9±14.7 94.7±13.8 0.942
FEV1, % 97.8±16.8 91.4±18.7 0.124
FEV1/FVC, % 74.6±8.4 67.7±10.8 0.003
RPFI, n (%) 2 (5.6) 2 (5.0) 1.000 OPFI, n (%) 9 (25.0) 26 (65.0) <0.001 Normal 27 (65.9) 14 (34.1)
Mild 6 (26.1) 17 (73.9) 0.002*
Moderate 3 (25.0) 9 (75.0)
Obstructive pulmonary function impairment (OPFI) was defined as forced expiratory volume in one second/ forced vital capacity (FEV1/FVC, %)<70, and as FEV1/FVC (%)≥70 and FVC<80 for restrictive pulmonary function impairment (RPFI) by spiro- metry. Statistical analysis was performed by the chi-square test for categorical variables and Student's t-test for continuous vari- ables.
*Calculated by linear association of the chi-square test (value=
9.94). The OPFI was classified into three categories according to severity as a result of spirometry: normal=FEV1/FVC≥70%;
mild=OLFI & FEV1≥80%; moderate=OLFI & 50%≤FEV1<80%.