Online ISSN: 2288-7253 DOI: https://doi.org/10.14579/MEMBRANE_JOURNAL.2018.28.3.157
1)
1. Introduction
Water shortage is one of the most serious problems in the Contemporary Age, and ensuring clean water supply to the society is a crucial need. Typical separa- tion processes for obtaining clean water include reverse osmosis and forward osmosis. Reverse osmosis in-
volves application of high pressure to the feed solution to obtain pure water, forward osmosis method is based on the natural phenomenon induced by the osmotic gradient between the feed solution and the draw sol- ution[1]. Consequently, forward osmosis technology has higher energy efficiency than reverse osmosis tech- nology and is gaining attention as a next-generation
†
Corresponding author(e-mail: [email protected], http://orcid.org/0000-0002-0297-7216)
정삼투 공정의 유도용질로서의 식물 화학물질 기반의 탄닌산 유도체
김 태 형⋅주 창 하⋅강 효†
동아대학교 화학공학과
(2018년 6월 25일 접수, 2018년 6월 28일 수정, 2018년 6월 28일 채택)
Phytochemical-based Tannic Acid Derivatives as Draw Solutes for Forward Osmosis Process
Taehyung Kim, Changha Ju, and Hyo Kang
†Department of Chemical Engineering, Dong-A University, 37 Nakdong-Daero 550beon-gil, Saha-gu, Busan 49315, Korea (Received June 25, 2018, Revised June 28, 2018, Accepted June 28, 2018)
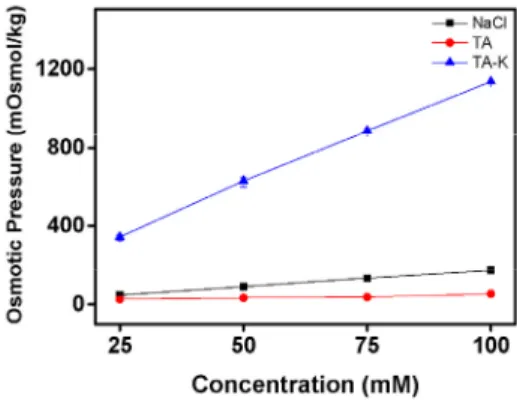
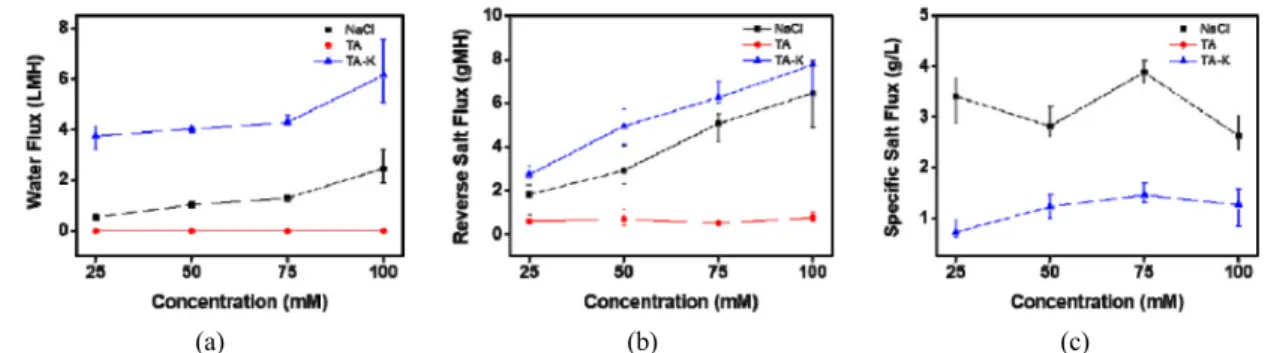
요 약: 우리는 정삼투 공정의 유도용질로서 잠재적인 활용 가능성을 확인하기 위해 식물화학물질인 tannic acid (TA)에 알칼리 염 처리한 alkali tannate 염 중 하나인 potassium tannate (TA-K)를 평가하였다. TA-K의 정삼투 특성과 회수 특성은 체계적으로 조사되었다. 정삼투 공정을 active layer facing feed solution (AL-FS) 방식으로 적용했을 때, TA-K 유도용액의 투수량은 TA 유도용액의 투수량 보다 훨씬 많은 반면, TA 유도용액의 투수량이 거의 확인되지 않았다. 100 mM 저농도에서 의 TA-K 유도용액의 삼투압(1,135 mOsmol/kg)은 NaCl 수용액의 삼투압(173 mOsmol/kg)의 약 6.5배로 확인되었다. 100 mM 농도의 TA-K의 투수량과 specific salt flux (6.14 LMH, 1.26 g/L)는 동일한 농도의 NaCl 유도용액의 투수량과 specific salt flux (2.46 LMH, 2.63 g/L)의 약 2.5배 및 0.5배로 각각 확인되었다. TA-K를 재사용하기 위해, 금속 이온 침전법을 이용 하여 TA-K유도용질을 침전시킨 후, membrane filtration을 이용하여 유도용질을 회수하였다. 이 연구는 식물화학물질을 정삼 투 공정의 유도용질로서의 적용 가능성을 보여준다.
Abstract: Potassium tannate (TA-K), which is prepared by base treatment of the bio-renewable tannic acid (TA), was evaluated for its potential application as a draw solute for water purification by forward osmosis. The forward osmosis and recovery properties of TA-K were systematically investigated. In the application of forward osmosis through the active layer facing feed solution (AL-FS) method, the water flux of TA-K draw solution was significantly higher than that of the TA draw solution, while that of the latter was not identified. At a low concentration of 100 mM, the osmotic pressure (1,135 mOsmol/kg) of the TA-K draw solution was approximately 6.5 times that (173 mOsmol/kg) of the NaCl draw solution.
Furthermore, the water flux and specific salt flux (6.14 LMH, 1.26 g/L) of the TA-K draw solution at 100 mM were ap- proximately 2.5 and 0.5 times those of the NaCl draw solution (2.46 LMH, 2.63 g/L) at the same concentration, respectively. For reuse, TA-K was precipitated by using a metal ion and recovered through membrane filtration. This study demonstrates the applicability of a phytochemical material as a draw solute for forward osmosis.
Keywords: draw solute, forward osmosis, tannic acid, recovery
mal treatment, stimulus-triggered separation, membrane filtration, and hybrid methods. In the direct use meth- od, the draw solution is directly applied to forward os- mosis to obtain drinking water without involving any recovery stage or used for agriculture. Sugars such as glucose and fructose, or inorganic salts (e.g. KCl, NaNO
3, (NH
4)
2HPO
4, etc.), which are used as draw solutes for forward osmosis, can be used directly in drinking water or for fertilizer[6-9]. The draw solutes employed in the thermal treatment method include NH
3-CO
2and SO
2[10,11]. As reported by Elimelech et al., NH
3-CO
2is dissolved in water to obtain NH
4HCO
3and induce osmosis; the draw solute is recovered by heating it above a certain temperature so that it decom- posed into CO
2and NH
3. While this process is ad- vantageous in that it induces high osmotic pressure and allows for easy recovery of the draw solute, the water quality is poor because of the small amount of residual draw solute in fresh water[12]. Stimulus-triggered sepa- ration can be classified based on physical or chemical stimulus, and physical stimulus-triggered separations are further classified into thermal and magnetic separations. In the thermal method, the draw solute is separated from water by reversible phase transition of the draw solution after a certain critical temperature (lower critical solution temperature (LCST) and upper critical solution temperature (UCST) and has the ad- vantage of a simple recovery process[13]. Active stud- ies have been conducted on the draw solutes in the thermal separation[14-18]. Wang et al. used poly(N-isopropylacrylamide) (PNIPAm), which is a typical polymer with LCST characteristics, in the for- ward osmosis process[19]. Surface-modified magnetic nanoparticles (MNPs) containing hydrophilic molecules
solute via reactions that occur when chemicals are add-
ed or removed, without external energy. Chemical
stimulus-triggered separation is based on pH, salt, and
gas response. Draw solutes using the pH-responsive
method utilize an organometallic salt, and the draw
solute is recovered by adjusting its water solubility
through pH modulation[24]. The salt-responsive method
involves solidification and recovery of the draw solute
(aluminum sulfate) by using a specific salt as the
precipitant. Aluminum sulfate is recovered after the
precipitation into aluminum hydroxide and calcium sul-
fate by the addition of calcium hydroxide as the pre-
cipitant[25]. The gas-responsive method uses a switch-
able polarity solvent (SPS) as a draw solute, which in-
duces osmosis via the formation of ammonium and hy-
drogen carbonate salts with relatively high polarity
from the reaction between amine and carbon dioxide
with relatively low polarity, and water. The draw sol-
ute is recovered by phase separation from water when
CO
2is removed from the draw solution[26]. The draw
solute can also be recovered through membrane filtra-
tion from the draw solution in which the phase tran-
sition occurred. Poly(sodium acrylate), poly(sodium
4-styrenesulfonate), and dendrimers draw solutes can
be recovered through ultrafiltration (UF)[27-29], while
divalent inorganic salts such as MgSO
4and MgCl
2can
be recovered through nanofiltration (NF) and further
recovered through reverse osmosis (RO)[30]. Complex
draw solutes such as carboxylic acid-metal complexes
(oxalic acid-metal complex and ethylenediaminetetra-
acetic acid-metal complex) can also be recovered by
NF[31,32]. Finally, the hybrid system combines in-
dependent methods to recover draw solutes. For exam-
ple, purified water can be obtained by treating with an
ionic liquid such as 2-methylimidazoles through for- ward osmosis-membrane distillation (FO-MD) as well as nanocomposite polymer hydrogel from magnetic heating[33,34].
Tannin, which is a polyphenol, is abundant in wood and is used in the medicine, dye, food, and rubber in- dustries[35,36]. Depending on their structural character- istics, tannins are classified as gallotannins, ellagi- tannins, complex tannins, and condensed tannins, among which gallotannins and ellagitannins are hydrolysable tannins[37]. Tannic acid, a gallotannin, forms ester bonds between 6 to 9 gallic acid units and glucose, and is known to exhibit antioxidant, antibacterial, and anti- cancer activities, similar to other polyphenols[38-42].
The glucose core and branched gallic acid units have been reported as major contributors to the antioxidant properties of tannins[43]. Previous studies have re- ported that the trihydroxy group in the branched gallic acid unit plays an important role in determining the antioxidant properties of tannic acid, and hydrogen bonding between the trihydroxy groups in the molecule leads to the excellent antioxidant properties[43-45].
In this study, we developed a potassium tannate (TA-K) product, a phytochemical polyphenol, to identi- fy the potential use of phytochemicals as draw solutes in forward osmosis, and investigated the forward os- mosis and recovery characteristics of TA-K.
2. Experimental
2.1. Reagents and instrumentations
Tannic acid was purchased from Sigma Aldrich Co., LLC. Potassium hydroxide flake was purchased from Dae-Jung Chemical & Metals Co., LTD. Iron (III) chloride hexahydrate (FeCl
3⋅6H
2O) and sodium chlor- ide (NaCl) were purchased from Junsei Chemical Co., LTD., respectively. All reagents were used without fur- ther purification. To identify the molecular structure of the draw solute, we used Fourier-transform infrared (FT-IR) spectroscopy (Thermo Fisher Scientific, NICOLET 380) in the wavelength range from 4,000 cm
-1to 400 cm
-1with a resolution of 4 cm
-1in the attenuated total
reflection (ATR) mode. The thermal properties of the samples were analyzed by measuring weight changes with varying temperatures using a thermogravimetric ana- lyzer (SETARAM Instrumentation, SETSYS Evolution).
To identify and quantitatively analyze carbon, hydro- gen, and oxygen atoms constituting the draw solute, we used an elemental analyzer (Elementar Analysen- systeme GmbH, Vario Micro Cube). We also used an inductively coupled plasma atomic emission spectropho- tometer (HORIBA JOBIN-YVON S.A.S., ACTIVA) to identify and quantitatively analyze the potassium atoms contained in the samples. The rheological properties of the samples were investigated by measuring the shear rate changes using a cone-and-plate rheometer with a diameter of 40 mm and a cone angle of 2° (TA Instrument, AR G2, stress control type). Conductivity was measured using a conductivity meter (METTLER TOLEDO, Seven2Go pro). The osmotic pressure was measured using an osmometer (KNAUER, SEMI- MICRO OSMOMETER K-7400) by the freezing point depression method. The water flux and reverse salt flux were determined by measuring the height differ- ence between the solution levels on the two sides of a home-made U-shaped tube and the conductivity differ- ence before and after the experiment, respectively.
2.2. Preparation of potassium tannate (TA-K)
The aqueous solution of potassium tannate, which is
the draw solute used in the forward osmosis process,
was prepared in 100 mL increments for each concen-
tration using the following procedure. For example, a
100 mM aqueous solution of potassium tannate was
prepared by adding 50 mL of potassium hydroxide (5
mol) aqueous solution was slowly added to 50 mL of
tannic acid (200 mmol) aqueous solution at room tem-
perature, followed by magnetic stirring. Potassium tan-
nate aqueous solutions of other concentrations were
prepared following the same procedure, with different
amounts of tannic acid and potassium hydroxide. For
example, 75 mM, 50 mM, and 25 mM aqueous sol-
utions of potassium tannate were prepared by adding
150, 100 mmol, and 50 mmol of tannic acid and 3.75,
2.5 mmol, and 1.25 mol of potassium hydroxide, respectively.
2.3. FO performance
The water flux and reverse salt flux were measured using a small-scale FO system connected to a home-made, cap-fixed L-shaped glass tube. The FO process was conducted after inserting the membrane (Hydration Technologies Inc. (HTI), thin film compo- site FO membrane) between two L-shape glass tubes with diameter of 2.3 cm and fixing with an aluminum clamp. The FO process was performed in the ac- tive-layer-facing feed solution (AL-FS) mode. Distilled water was added as feed solution to one side tube and NaCl, tannic acid, and potassium tannate solutions as draw solutions were added to the other side tube and the solutions were stirred at room temperature for 20 min using magnetic bar and solenoid (AS ONE, OCTOPUS CS-4).
The water flux (J
w) was determined by measuring the height difference between the solution levels on the two sides of the U-shaped tube and the reverse salt flux (J
s) was determined by analyzing the quantity of solute that diffused from the draw solution to the feed solution during the FO process; the total dissolved solid
(TDS) of the feed solution was also measured. The water flux (J
w, [Lm
-2h
-1, LMH]) and reverse salt flux (J
s, [gm
-2h
-1, gMH]) were calculated using Equation (1) and Equation (2), respectively.
×
(1)
×
×
(2)
where Δt [h] is the operating time of the FO proc- ess; ΔV [L] is the volume change of the draw solution over time Δt; A [m
2] is the effective membrane area, whose value is 4.15 × 10
-4m
2; and ΔC [g/L] is the change in the concentration of the feed solution after time Δt.
3. Result and Discussion
3.1. Characterization of potassium tannate (TA-K) Fig. 1 illustrates the molecular structure of TA-K.
Tannic acid (TA) solution was treated with potassium Fig. 1. Schematic structure of potassium tannate (TA-K).
Fig. 2. FT-IR spectra of tannic acid (TA) and potassium
tannate (TA-K).
hydroxide (base) to prepare TA-K solution. FT-IR analysis was performed to identify the molecular struc- tures of TA and TA-K (Fig. 2). The spectra of both TA and TA-K showed an O-H stretching vibrational peak in the range 3,550 cm
-1to 3,200 cm
-1; a C=O stretching peak due to ester bonding at 1,740 cm
-1to 1,670 cm
-1; aromatic C=C stretching at 1,600 cm
-1to 1,450 cm
-1; C-O stretching of the ester at 1,370 cm
-1to 1,290 cm
-1; and a C-O stretching peak of the ether at 1,210 cm
-1to 1,190 cm
-1. However, the intensity of the O-H peak of TA-K was lower than that of the O-H stretching vibrational peak of TA. The result sug- gests that the hydroxy group of TA was converted to hydroxide, and that TA-K was synthesized from TA.
Another difference between the spectra was that the width of the aromatic C=C stretching peak of TA-K in the range 1,700 cm
-1to 1,500 cm
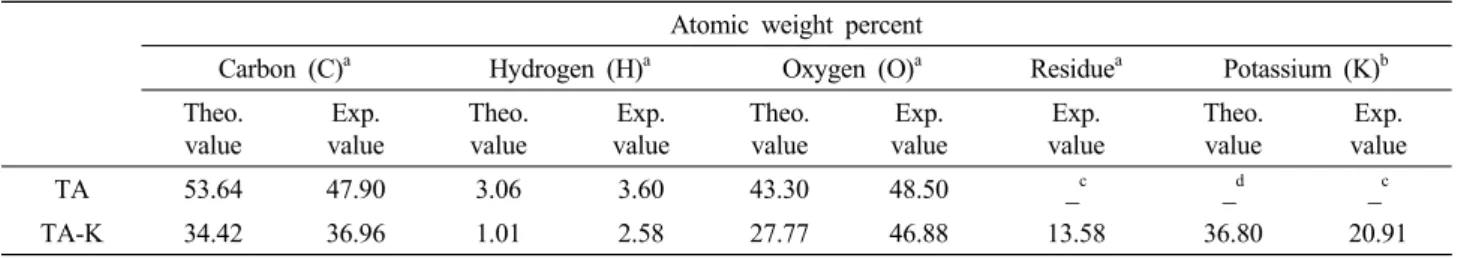
-1was larger than that in the TA spectrum, which is similar to the case of other tannate compounds, because TA-K is more strongly amorphous than TA[46]. Elemental analysis (EA) and inductively coupled plasma atomic emission spectrophotometry (ICP-AES) were performed to inves- tigate the types and mass ratios of elements constitut- ing TA and TA-K. Table 1 shows the theoretical and experimental values for the elements constituting each substance. Potassium was detected in the case TA-K but not TA, suggesting that the hydrogen moiety in the hydroxy group of the gallic acid units was converted to potassium. The hydrogen content measured by EA for TA-K (2.58 wt%) was higher than the theoretical value (1.01 wt%), and the potassium content measured
by ICP-AES (20.91 wt%) was lower than the theoret- ical value (36.80 wt%). In other words, the gallic acid units in TA were not completely converted to potas- sium gallate during the preparation of TA-K, and the conversion rate was approximately 57%.
3.2. Thermogravimetric analysis
Thermogravimetric analysis (TGA) was used to ver- ify the thermal behavior of TA-K in the range 20°C to 800°C at the heating rate of 10 °C/min under argon atmosphere. The differential TG (dTG) curve, which shows the weight change over time, was also inves- tigated (Fig. 3). According to the dTG curve, the ther- mal decomposition of TA-K proceeded in two steps. In the first step, decomposition started at approximately 130°C, and the decomposition rate was the maximum at approximately 250°C. A weight loss of approx- imately 18% occurred in the temperature range 130°C to 250°C. The thermal decomposition at approximately
Atomic weight percentCarbon (C)a Hydrogen (H)a Oxygen (O)a Residuea Potassium (K)b Theo.
value
Exp.
value
Theo.
value
Exp.
value
Theo.
value
Exp.
value
Exp.
value
Theo.
value
Exp.
value
TA 53.64 47.90 3.06 3.60 43.30 48.50 _c _d _c
TA-K 34.42 36.96 1.01 2.58 27.77 46.88 13.58 36.80 20.91
aDetermined by elemental analyzer.
bDetermined by inductively coupled plasma atomic emission spectrophotometer.
cUnmeasured value experimentally.
dUncalculated value due to absence of potassium atom structurally.