한국정보통신학회논문지 Vol. 22, No. 6: 849~854, Jun. 2018
클라우드 서버 기반 IoT를 이용한 무선기지국 원격 감시시스템 개발
이양원1*·김철원2
Development of Wireless Base Station Remote Monitoring System Using IoT Based on Cloud Server
Yang-weon Lee
1*· Chul-won Kim
21*
Department of Information & Comm. Eng., Honam University, Gwangju, 62399 Korea
2
Department of Computer Eng., Honam University, Gwangju, 62399 Korea
요 약
넓은 지역에 광범위하게 분포되어 있는 통신용 무선기지국은 관리에 많은 어려움이 있다. 특히 산간 오지에 있는 무인 통신무선 기지국은 위급한 상황 발생시에 접근에 많은 어려움을 겪고 있다. 대형 통신회사들은 송수신 정보만 원격으로 관리하고 있고 실제 시설 유지를 책임지고 있는 지역 중소기업 협력업체들은 이러한 기술을 보유하고 있지 않아서 일일이 현장 방문을 통하여 확인하고 있는 실정이다. 본 연구에서는 넓은 범위에 산재해 있는 무선기지국내 의 온도, 습도, 화염 발생여부, 전원 동작 여부를 실시간으로 모니터링 하여 클라우드 서버에 보내 사무실에서 실시간 모니터링을 통하여 관리하며 위급시 경고 메시지 전송 등이 수행이 가능한 시스템을 클라우드 서버 구축을 통하여 IoT 센서 기술을 이용하여 구현한 내용을 제시하고자 한다.
ABSTRACT
Radio base stations, which are widely distributed across large areas, have many difficulties in managing them.
Unmanned radio base stations in remote mountains are having a hard time accessing them in case of emergencies. Major telephone service providers only remotely control incoming and outgoing information and local small business partners responsible for maintaining actual facilities do not possess such technologies, so they are each checked during field visits.
In this study, in order to process the sensor raw data and smoothing, we apply the particle filters and confirmed that the performance of sensor data accuracy is increased. Integrated system using temperature, humidity, fire condition, and power operation at a wide range of radio base stations under the real-time monitoring status is operated well. It show that all of the status of base station are monitored at the remote office using the cloud server through internet networking.
키워드
: 사물인터넷, 입자필터, 클라우드, 4차산업혁명
Keywords
: IoT, Particle Filter, Cloud, 4th industry revolution
Received 23 May 2018, Revised 25 May 2018, Accepted 1 June 2018
* Corresponding Author Yang-weon Lee(E-mail:[email protected], Tel:+82-62-940-5572) Department of Information & Communication Engineering, Honam University, Gwangju, 62399 Korea
Open Access
http://doi.org/10.6109/jkiice.2018.22.6.849
pISSN:2234-4772Communication Engineering
Ⅰ. Introduction
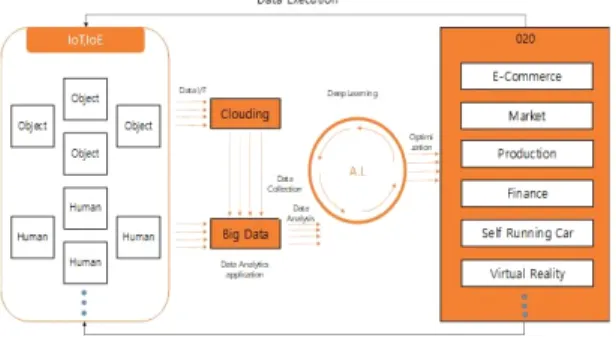
The fourth industrial revolution has become a hot topic in recent years. The basic idea of the fourth industrial revolution is as shown in Fig.1, as the superconnection, super intelligence, and large fusion, and the industrial ecosystem generates vast data through IoT(Intenet of Things) and IoP (Internet of People).
AI(Artificial Intelligence) can be understood as providing the super intelligent product production / service by making appropriate judgment and autonomous control based on deep learning of big data and leading the industrial revolution[1].
Fig. 1 Mechanism of 4th Industrial Revolution
The Internet refers to the Internet environment in which people, objects, and data are all connected to a wired / wireless network to generate, collect, share, and utilize information. On the other hand, applying the Internet of Things as shown in Fig.2 to real life requires the integrated implementation of the underlying technologies.
Fig. 2 Communication Environmental of IoT
The technologies required are largely the result of the middleware software that is used to store and analyze sensor and network hardware technologies, such as controller, wireless chip, and data reconstruction, and to represent the data representation.
In recent years, radio base stations have become so widespread in large areas that they are helping to ensure seamless communication. However, these base stations contain islands and mountainous areas, so it is very difficult to keep maintaining them. In particular, in recent years, it has become increasingly difficult to maintain the system, such as to intentionally destroy base station facilities or to attempt to prevent arson on the ground that it harms EM threats to electromagnetic humans and animals and the surrounding beauties.
Consequently, the need for remote monitoring in real time is increasing.
Fig 3. shows the overall scheme. This system consists of three parts: sensor placement area, data acquisition area, and data processing area. The purpose of the placement area is to arrange the sensors effectively.
After sensor placement, the acquired data are stored in the data base. Our primary concern is to detect the abnormal operation in the base station given the measurements and under the operation rules. In this paper, we apply the particle filter theory to process the measured data in the data processing area[2].
Fig. 3 Overall Configuration of Remote Monitoring System of Base Station
In this study, to solve these problems, a system that is
based on cloud services is constructed, and a wireless base station scattered across the country is connected to the Internet, and IoT sensor (fire, temperature and humidity) is detected at each base station.
Ⅱ. Design of Remote Control Base Station System
Fig. 4 shows the functional diagram of the remote monitoring system of the cloud service of based on wireless communication base station to be developed in this research. The flow of the main functions is as follows: First, each wireless base station detects intrusion detection, temperature, humidity, and flame by using four sensors, and transmits the equipment and power supply status in the base station to remote logging information (transmission frequency, transmission output, transmission bandwidth range, power information), preprocess in IoT device hardware, and connect to Internet AP using Wi-Fi.
Information connected to the Internet is transmitted to the cloud system in real time. The cloud system is implemented as software as a service which is called as as a SaaS, so that the maintenance company does not need to buy a separate cloud server, and it is implemented in a way that only the monthly fee is paid.
Fig. 4 System Operation Flow Diagram of S/W Structure
The wireless base station manager monitors the status
information of each base station displayed on the dashboard, and automatically sets alarm ranges and sends alarm characters to the system.
These sensors and base station information are stored in real time in the database and are designed to accumulate data in a round-robin manner, so that the desired time zone can be shortened or enlarged.
Ⅲ. Data Processing using Particle Filter
In this paper, particle filters are used to smooth data from sensors. A particle filter, unlike a Kalman filter[3,4], uses a continuous Monte Carlo technique, which is collected by updating the weights of important samples over and over again. Sensors that have been adopted in this system are transmitting data in real time, but the value of these sensors is suddenly changed due to impulses caused by the transmission noise around them, and therefore filtering is necessary.
The system proposes a simplified particle filter, especially since data processing is to be performed in real time on the Arduino Mega based. To this end, the relationship between sensors and system components was modelled to simplify[5].
The actual model of the application is usually non-linear and non-linear. Mean and variance are not indicative of the overall density function. To handle this case, the sample considers the full density function [6]
and [7,8,9].
3.1. Application of Particle Filtering for the Sensor Data Processing
We extend the methods described in Black and Jepson
[9] to apply particle filter algorithms to sensor data
processing. In particular, the state of time is described as
a parameter vector:
. This is the
integer index of the prediction model, which represents
the current data of the model. Amplitude Scaling factor
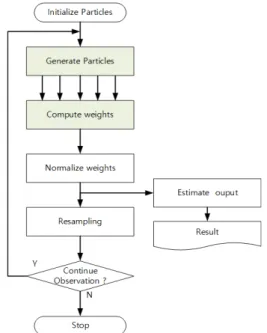
is the scale factor of the time dimension. Fig. 5 shows
the particulate filter calculation process.
To initialize, redraw N particles and normalize and equalize all weights.
∼
(1)
(2)
Then, according to the procedural model of the target mechanics we propagate the particle set.
(3) where
is the sensor and architecture dynamics model and
is the gaussian density noise.
Through this step, given a received measure and a current particle value, we update the probability density function (PDF) according to the likelihood function that receives the measure.
(4) And then normalize the system weights liks as following:
(5)
And then compute the effective particle sample size.
The effective sensor sample bounds on the overall sample size are given by ≤
≤ .
(6)
Finally, it compares
again with the sampling threshold and decides if it should be resampled if necessary. In general, conditions for repeated sampling of particle filters are given as shown in Equation 7. That is, the current value minus the changing value is multiplied by the mean value to add all. This results in Equation 7 being the same as updating errors in the Kalman filter. Therefore, the particle filter will have an optimal estimation shape.
(7)
The covariance can be computes using as following:
(8)
As a first step we sample some of the possible values for a condition (sensor information in this paper). The sampled sensor values then constitute the condition at the initial time. And these samples are called particles, which lead to the correct values through decomposition techniques. Then resample the particles. So far, no weight has been given on which of the samples is more important. The position values measured by performing an important sampling of samples from now on are weighted by the added probability of overlapping values from the previous samples. Repeating this process will allow us to find out more and more accurate values of sensors over time.
Fig. 5 Sequence of General Particle Filtering Calculation
Ⅳ. Evaluation of Development System
Two virtual environment input models were used to verify proposed particle filtering techniques for sensor data estimation and base station monitoring systems[10].
The coefficient for particle filters is to maintain a 50 % scale. First, we performed an offline experiment to evaluate the performance of the proposed monitoring system. We had two environment make each case around the base station about eight times. A random selection of 40 out of 80 event model sequences was detected. The remaining environmental conditions were used for testing. The overall detection recognition rate is 97.6 %.
In an offline experiment, we implemented a real environmental control interface based on the dynamic state of the naked station which is under the actual environment. The sensing interface worked well in a dynamic environment. Their detailed decision-making process is shown in Fig. 6. When the location range is [4, 8], the range estimation error and noise distribution for the 100-hour interval of 1250 and 2000 particles are 0:05. It can be seen in Fig. 6 that increasing the number of particles is necessary to reduce the error by estimating the correct sensor value.
Fig. 6 Variance of the particle sample density on the performance of estimation particle filter
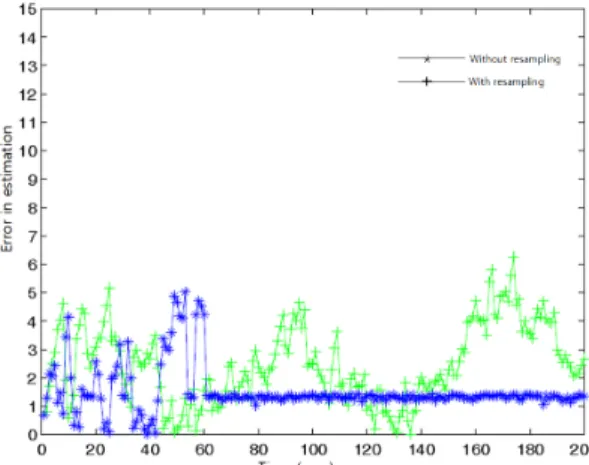
Fig. 7 shows a comparison of the weighted values when using a particle filter and the times when they are not. In particle filters, it is very important to replicate the weight values of the particles, and also to determine the appropriate number of replicates. In this paper, the changes are shown in Fig. 7 for every 200 hours.
Fig. 7 Particle Filter Performance depending on resampling
Fig. 8 shows a comparison of weighted values with and without them, as shown in Fig.7. However, this shows the change when adding noise to the range of the weight value 0.01.
Fig. 8 Particle Filter Performance depending on resampling which is added by noise
Ⅴ. Conclusions
In this paper, we developed the hardware and software that applies IoT and cloud service technologies, which are key words in the fourth industrial revolution. The IoT platform and particle filter proposed in this paper are used to provide services that are more capable of providing faster maintenance and also to drastically reduce maintenance costs.
ACKNOWLEDGEMENT
This work is resulted from financially supported by Linc+ of Honam University.
References
[ 1 ] Y.W. Lee, “Design of Smart Garden System Using Particle Filter for Monitoring and Controlling the Plant Cultivation,”
Lecture Note on Artificial Intelligence, vol.10363, pp. 461–
466, Aug. 2017.
[ 2 ] Y.W. Lee, “Implementation of Mutual Localization of Multi-robot Using Particle Filter,” Lecture Note on Computer Science, vol.7389, pp. 86–94, Aug. 2012.
[ 3 ] C. Andrieu, A. Doucet, and R. Holenstein, “Particle Markov chain Monte Carlo methods,” Journal of the Royal Statistical Society: Series B (Statistical Methodology), vol.72, no.3 pp. 269–342, Oct. 2010.
[ 4 ] K. Patel and S. Patel, “Internet of Things : Definition, Characteristics, Architecture, Enabling Technology, Application and Future Challenges,” IJESC Research Article, pp. 6122-6131, May 2016.
[ 5 ] S. Arulampam, S. Maskell, N. Gordon and T. Clapp, “A tutorial on particle lters for on-line non-linear/non-gaussian bayesian tracking,” IEEE Transaction on Signal Processing vol. 50, no.2 pp. 174-188, Feb. 2002.
[ 6 ] B.D. Anderson and J.B. Moore, Optimal Filtering. pp.
90-128, Prentice-Hall, New Jersey, 1979.
[ 7 ] M. Serrano, P. Barnaghi and F. Carrez, “Internet of Things Semantic Interoperability: Research Challenges, Best Practices, Recommendations and Next Steps, European research cluster on the internet of things,” European Research Cluster on the Internet of Things, pp. 1-45 Mar.
2015.
[ 8 ] B.K. Lee and E.H. Jeong, “A Role based Health Data Access Control Model for Patient Information Protection on Cloud Computing Environment,” Journal of Security Engineering, vol.13, no.3, pp. 183-194, Aug. 2016.
[ 9 ] P. S. Jeong and Y.H. Cho, “Smartphone User Authentication Algorithm based on Mutual Cooperation in Mobile Environment,” Journal of Korea Institute of Information and Communication Engineering, vol.21, no.7, pp.
1393-1400, July 2017.
[10] A.S. Oh, “A Study on Motion and Position Recognition Considering VR Environments,” Journal of Korea Institute of Information and Communication Engineering, vol.21, no.12, pp. 2365-2370, Dec. 2017.
이양원(Yang-Weon Lee)
포항공과대학교 전자전기공학과 공학박사 호남대학교 정보통신공학과 교수
※관심분야 : 신호처리, 사물인터넷 응용, 계측제어
김철원(Chul-Won Kim)
광운대학교 컴퓨터공학과 공학박사 호남대학교 컴퓨터공학과 교수
※관심분야 : 알고리즘, 영상처리