• 검색 결과가 없습니다.

The Effect of Macroeconomic Factors on Income Inequality: Evidence from Indonesia

N/A
N/A
Protected

Academic year: 2021

Share "The Effect of Macroeconomic Factors on Income Inequality: Evidence from Indonesia"

Copied!
12
0
0

로드 중.... (전체 텍스트 보기)

전체 글

(1)

Print ISSN: 2288-4637 / Online ISSN 2288-4645 doi:10.13106/jafeb.2021.vol8.no7.0055

The Effect of Macroeconomic Factors on Income Inequality:

Evidence from Indonesia

Andi SESSU

1

, Yulia Tri SAMIHA

2

, Maya LAISILA

3

, Nurul CHAMIDAH

4

, Imaduddin MURDIFIN

5

, Aditya Halim Perdana Kusuma PUTRA

6

Received: March 20, 2021 Revised: May 23, 2021 Accepted: June 01, 2021

Abstract

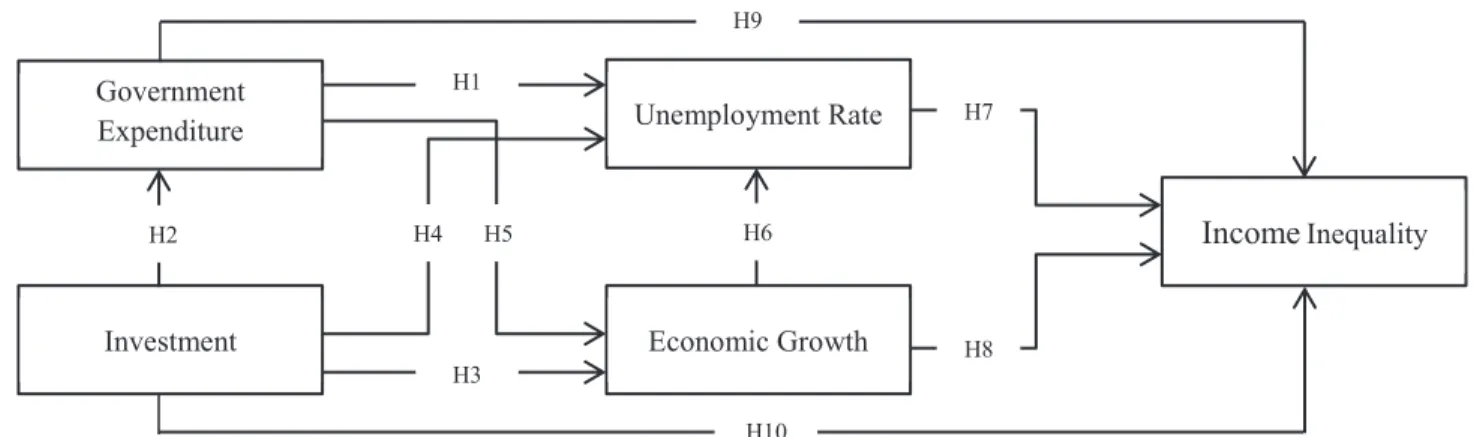
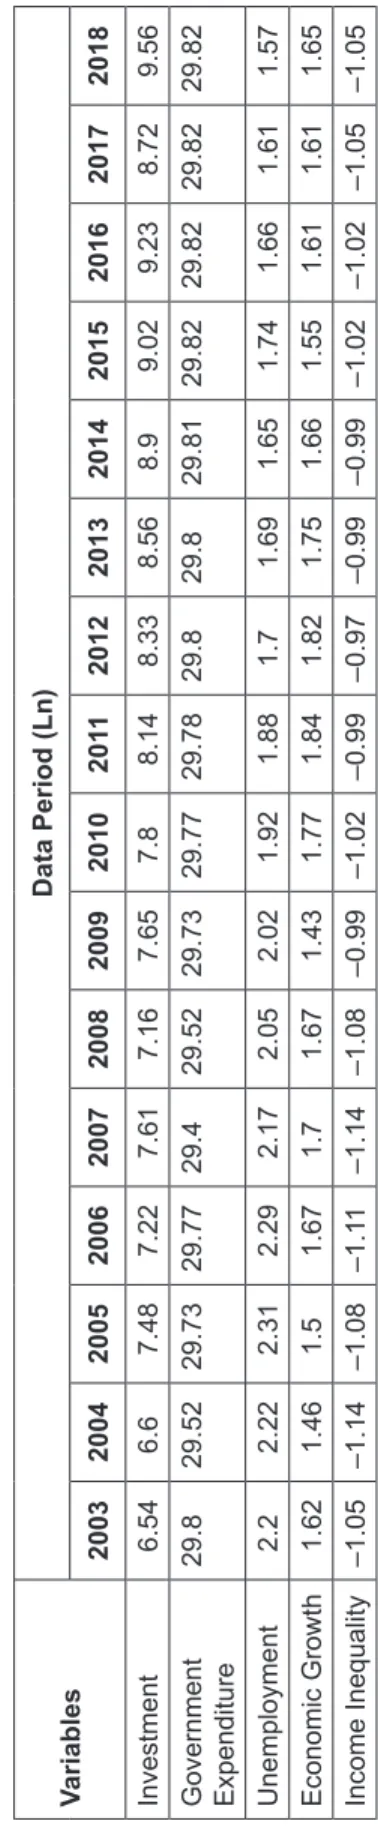
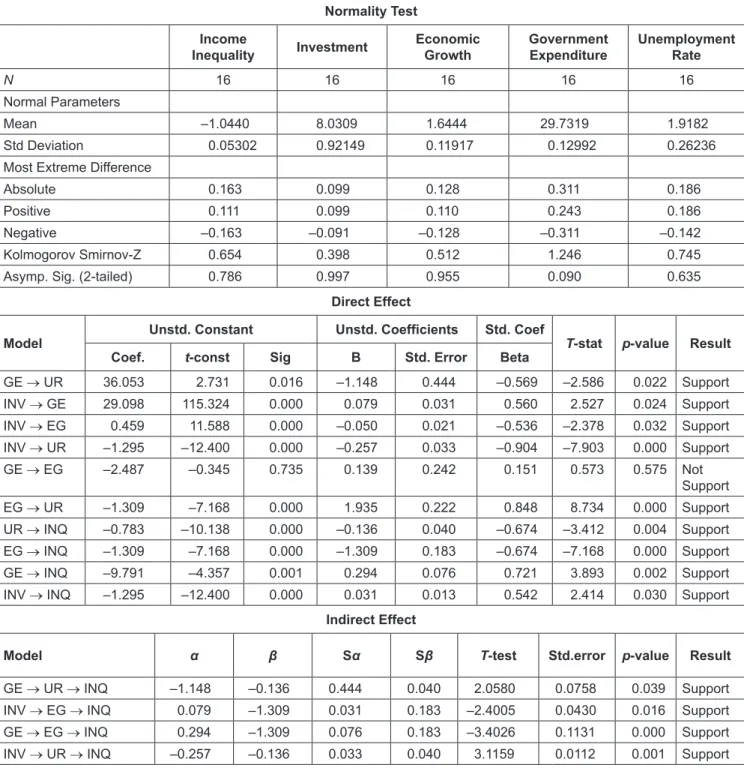
The purpose of this study is to analyze the relationship and effects of variables both directly and indirectly (e.g., investment (INV), government expenditure (GE), unemployment rate (UR), economic growth (EG), and income inequality). The analytical phases consist, first, to transform the data using the Log Natural (Ln) method. Second, to check normality and multicollinearity of data. Third, to test direct effects of variables (government expenditure and investment effect on the unemployment rate and economic growth; investment on government expenditure; economic growth on unemployment rate; economic growth and unemployment rate on income inequality). Fourth, to test indirect effects using Sobel test, which involves UR and EG as intervening variable. Fifth, to test hypotheses with p-value < 0.05.

The results of the study reveal that, of the 12 relationships, statistics show that 11 variations of the association have significant positive and negative effects. Theoretically, the different characters and goals of GE and INV in each country will have a different impact on EG and UR goals. The study provides an input, especially for the government. To create optimal EG through GE and INV, it is necessary to allocate budgets to industrial sectors that can absorb a massive labor force and to new economic growth sectors.

Keywords: Government Expenditure, Investment, Unemployment, Economic Growth, Income Inequality JEL Classification Code: E12, E22, E24, O47, D63

1. Introduction

The current Indonesian government’s investment activity focuses on increasing access to capital, both foreign and domestic. In particular, investment in the manufacturing and infrastructure industries is welcomed to improve connectivity throughout Indonesia. Of course, the Indonesian government’s investment projection aims to reduce logistics costs and increase national competitiveness, amid the current opportunities, given the direction of the world economy moving to the Asian continent; Indonesia has several great opportunities to create an investment climate that is conducive to both macro and micro scales in the long term, one of which is investment in infrastructure and investment in the creative and digital economy. Even so, the classic obstacles to investment problems in Indonesia also continue to roll. One of the main obstacles is the weight of bureaucracy and licensing, which is considered not to have optimal coordination between the center and the regions, and weaknesses in meeting the industry’s energy supply and the concentration of investment distribution that is only to the center in one particular area. Therefore, improving

1

First Author and Corresponding Author. Associate Professor, Faculty of Economic and Business, Department of Management, Universitas Muhammadiyah Prof. Dr. Hamka, Jakarta, Indonesia [Postal Address: Limau II, South Jakarta, Jakarta City, 12130, Indonesia] Email: [email protected]

2

Associate Professor, Faculty of Education and Teacher Training, UIN Raden Fatah, Palembang, South Sumatera, Indonesia.

Email: [email protected]

3

Assistant Professor, Faculty of Economic, Department of Management, Universitas Kristen Indonesia Maluku, Ambon City, Maluku, Indonesia. Email: [email protected]

4

Associate Professor, Faculty of Social Science & Political Science, Department of Communication, Universitas Muhammadiyah Cirebon, Cirebon, West Java, Indonesia.

Email: [email protected]

5

Associate Professor, Faculty of Economics and Business, Department of Management, Universitas Muslim Indonesia, Makassar City, South Sulawesi, Indonesia.

6

Associate Professor, Faculty of Economics and Business, Department of Management, Universitas Muslim Indonesia, Makassar City, South Sulawesi, Indonesia.

Email: [email protected]

© Copyright: The Author(s)

This is an Open Access article distributed under the terms of the Creative Commons Attribution Non-Commercial License (https://creativecommons.org/licenses/by-nc/4.0/) which permits unrestricted non-commercial use, distribution, and reproduction in any medium, provided the original work is properly cited.

(2)

regulations and government investment effectiveness is one of the critical aspects of creating a conducive investment climate. The policies pursued by the Government of Indonesia are through improving the investment climate in the business world; this is intended so that the synergy between productive investment will encourage the sought- after economic growth both in the short and long term (Kudasheva et al., 2015; Halvarsson et al., 2018).

Increased investment at the micro level aims to foster the enthusiasm of community business so that regional and national economic growth can be realized (Halvarsson, Korpi, & Wennberg, 2018). The position of the 2020 Indonesian State Budget (APBN) that reflects the government investment sector puts forward the aspects of national infrastructure development where a budget of up to 410.4 trillion rupiahs is allocated to the ministry of public works and public housing (PUPR). This is the investment policy in the infrastructure sector to support centers of economic growth, main logistics channels, and intermodal integration to encourage strategic areas development.

Furthermore, the government’s effort to increase economic growth and investment is through streamlining government spending (government expenditure). Reflecting on the 2018 State Budget, the total state expenditure had a budget of 2,220.7 trillion rupiahs, with the largest allocation going to state education through ministerial and institutional (K/L) spending of 847.4 trillion rupiah; then regional transfers and village funding amounting to 766, 2 trillion, and non K/L expenditures amounting to 607.1 trillion rupiah (www.

kemenkeu.go.id, 2018). The purpose of the state expenditure is to bring synergy to social protection programs and sharpen social assistance, one of which is education and health. In this regard, the dominant state expenditure policy in the education and health sectors has been empirically proven to overcome social inequality, directly or indirectly (Lavrinovicha et al., 2015; O’Campo et al., 2015; Shen, Yang, & Zanna, 2018;

Kim, 2016).

Appropriate government expenditure is a sought- after goal based on efficiency and effectiveness, which can significantly impact reducing social inequality and unemployment through a more coherent allocation of funds on the investment aspect (Raišienė, Bagdonienė, & Bilan, 2014; Qiong & Junhua, 2015; Bouwmeester & Scholtens, 2017; Prasetyo, 2020). Apart from that, specifically in Indonesia, policies on government expenditure also aim to support government administration to maintain the welfare of government officials and the effectiveness of the bureaucracy. These efforts are to support the acceleration of quality economic growth by strengthening the economy’s driving force while reducing the effect of unemployment.

The problem of unemployment will have a universal impact on improving the quality of life; this can also intersect with the economic growth and even the country. This causality

is closely related, considering that labor is an essential aspect of classical economic production (man, capital, and land). The role of adequate education mainly emphasizes unemployment to shape the demand for skilled workers in the labor market (Kudasheva et al., 2015; Salim et al., 2020).

An essential aspect in the issue of government policy requires the element of education as one of the direct investments to welcome skilled workers to reduce unemployment and overcome income inequality (Halvarsson et al., 2018;

Suhendra et al., 2020). This opinion is in line with the fact that is currently happening; the Indonesian Central Bureau of Statistics released figures on the unemployment of 7 million people dominated by high school graduates from vocational high schools. Apart from that, high unemployment causes the income received to be low and personal consumption is also low (Guerrazzi, 2015; Gächter et al., 2017; Nguyen &

Nguyen, 2019; Monsura, 2020).

Theoretical exposure and disclosure of factual phenomena regarding the linkage between investment and government expenditure concerning economic growth to overcome unemployment and income inequality give birth to main ideas related to the variety of suitability and inconsistencies between theory, facts, and empirical test results to bridge previous research findings. Research results from Adriana (2014); Roşoiu (2015); Sadiku et al (2015) conducted in Macedonia concluded that there is no correlation between economic growth and unemployment. Other studies that are considered to have limitations in disclosure and testing of variables in measuring the unemployment rate are also shown by Ghoshray et al (2016); Khodeir (2016); Strat et al (2015) where they stated that foreign investment did not affect reducing the unemployment rate. One of the studies found that investment in human development starts from improving better education to fulfill basic human needs. The linkage between investment and government expenditure through the education sector directly impacts income inequality for the productive workforce (Lavrinovicha & Teivans, 2015;

Nurlanova et al., 2019). Even though Indonesia’s economic growth ranks third-fastest among other G-20 countries, this statement follows the statistical figures for the 2000-2017 period, showing that Indonesia’s per capita Gross Domestic Product figure has increased by 4% every year after China and India. The country’s Gini ratio index also increased from index 30 in the 90s to index 39 in 2017. Indonesia’s increasing economic growth is not in line with income distribution, which has triggered inequality between people.

Income inequality that moves slowly with economic growth in Indonesia is triggered by several fundamental aspects:

educational qualifications and market demand for labor and skilled labor and skills (www.worldbank.org, 2015).

Government expenditure is a form of realization of

the government’s work plan in the implementation of

development. The public can only experience government

(3)

activities when the spending process is completed, such as spending on infrastructure provision, subsidies spending, spending on education, etc. One of the strategic aspects of government administration is state spending. The Indonesian government spending policy measures include, among other things, financing improvements in the quality of human resources, for example in the draft allocation for the 2020 Indonesian State Budget, which states that improving the quality of human resources is manifested in the form of supporting the continuation of education of the poor to a higher level through the Indonesia Smart College Card (KIP-Kuliah) program. Then, improving the quality of human resources is also reflected in the pre- employment cards, which aim to increase productivity for job seekers and the continuity of health service provision by increasing the amount of community contribution assistance. Besides, state spending for infrastructure development is needed through equitable development between regions and acceleration of the development of five tourism destinations in Indonesia, which are super priorities. Therefore, the government’s effort to improve the quality of human resources through the education sector is by allocating 20% of the state budget, namely, around 508.1 trillion rupiahs, which is targeted to fund the education sector, is then divided according to respective priorities.

For example, 11.1 trillion rupiahs for KIP, 4.5 trillion for operational assistance for early childhood education (PAUD), 6.7 trillion rupiah for college KIP, 64 trillion for school operational assistance, 1.8 trillion for magister and doctoral scholarships, 8 trillion for the construction and rehabilitation of school buildings, 4.4 trillion for university development and rehabilitation, and 284.1 billion for research by the Education Fund Management Institute (LPDP), which is under the coordination and cooperation between the Ministry of Finance and the Ministry of Education and Culture of the Republic of Indonesia.

Indonesia is the largest country in Southeast Asia, where its achievements have shown a significant change in reducing the poverty rate since 1999. Indonesia is also the fourth most populous country after China, India, and the United States. However, reducing the poverty rate has not been accompanied by a significant reduction in the income inequality ratio. The data shows that there is still income inequality in Indonesia, where economic growth is enjoyed by the wealthiest population with a percentage of 20% compared to other communities (www.worldbank.org, 2015). Even the income inequality between rich and poor people in Indonesia is still high. Inequality is reflected in the accumulation of wealth that only a handful of people enjoy. Indonesia itself is in the fourth highest position with a percentage of 49.3% of nine countries (Russia, Thailand, India, Brazil, China, the United States, South Africa, and

Mexico), which shows that national wealth is owned by only 1% of wealthy citizens.

In Indonesia, out of a total of 34 provinces, eight provinces have an inequality rate above the national Gini ratio, namely, DI Yogyakarta (0.423), Gorontalo (0.407), West Java (0.402), Southeast Sulawesi (0.399), DKI Jakarta (0.394), Papua (0.394), South Sulawesi (0.389), and West Papua (0.386). The provinces of West Nusa Tenggara (NTB) and East Java have lower inequality levels than the national average, with Gini ratios of 0.379 and 0.370. The provinces with the lowest inequality were in Bangka Belitung at 0.269, then North Kalimantan at 0.295, and West Sumatra at 0.306. In Indonesia, the government’s policy to address income inequality is by taking several strategic steps, such as improving public services and strengthening systems in the aspect of social protection (Gächter et al., 2017), as well as training for the workforce, providing employment opportunities, increasing public awareness through tax collection (www.worldbank.org, 2015). Gächter et al. (2017), in their study using the Equilibrium Theory approach, show that socioeconomic status has different impact on welfare.

However, there is a gap in the results of different studies suggested by Han, Zhao, and Zhang (2015) who state that the Gini ratio and total income per capita do not have a significant impact on income inequality.

Therefore, this study seeks to fill a critical gap of

several previous studies showing that the unemployment

ratio correlation is only measured based on the level of

economic growth alone. The novelty developed in this

study is to add investment variables and government

expenditure variables to measure the level of effectiveness

in reducing the unemployment ratio, which then measure

unemployment’s effectiveness. Economic growth also is

measured by its impact on income inequality. On the other

hand, in the empirical evidence in several studies, there

are different results. Strat et al. (2015), Khodeir (2016)

and Ghoshray et al. (2016) state that investment has no

impact on economic growth. The existence of differences

in the results of studies is mediated by differences in

decision-making processes in government policies in

covering investment, so it can be stated that policy does

play a vital role in supporting a conducive and adequate

investment climate (Roşoiu, 2015). In connection with

the introduction, the purpose of this study is to measure

and analyze the relationship and influence both directly

and indirectly between investment variables, government

expenditure, unemployment rates, economic growth, and

income inequality in Indonesia (Figure 1). Therefore,

to answer the research question, we used a linear

regression analysis approach, which was then combined

in a quantitative model to determine the relationship and

significance between each variable.

(4)

2. Literature Review and Hypothesis Development

In macroeconomic theory, the human development index (HDI) depends on two main factors, namely, economic growth and decreasing inequality between people.

A systematic increase in HDI requires government efforts to improve the education sector that is evenly distributed because it causes income inequality, one cause is the lack of education that affects the quality of human resources and mastery of skill competencies, which leads to high unemployment. Recent studies by Lavrinovicha et al. (2016);

Kim (2016); Shao et al. (2016); Kudasheva, Kunitsa, and Mukhamediyev (2015) state that social inequality caused by income inequality comes from unequal access to education.

Besides that, income inequality, which directly affects high unemployment, will also impact health and social welfare disparities. So the hope is equal distribution of all aspects to prevent inequality in society (Gächter et al., 2017). Measuring income inequality is closely related to the potential economic growth of a region (Goschin, 2015). Many researchers have studied the causal relationship between the two with various research points of view, such as Hassan, Zaman, and Gul (2015) and Lyubimov (2017). The Kuznets theory approach states that the government can reduce income inequality through government policies that are comprehensively tested, in line with Blundell et al. (2018); Birčiaková, Stávková, and Antošová (2014). The inequality theory with a deeper comparative study approach, it states that in addition to government policies, the constitutional structure and patterns of government also contribute significantly to decreasing or increasing trends in income inequality.

In terms of government policy, it is considering that the source of state revenue is more dominant from tax and non-tax revenue (PNBP). As in other developing countries, income inequality is still a complex problem to solve.

The theoretical relationship between investment and income inequality is explained in a recent study by Kudasheva et al. (2015); Halvarsson et al. (2018) state that investment has a positive effect on reducing potential income inequality.

Through investment in the education sector, it is hoped that all components of society can receive an education so that they have the potential to get out of the poverty trap through work. Halvarsson et al. (2018) also state more or less the same, namely, micro-investment significantly reduces income inequality. It is hoped that micro government regulations will be obliged to address easing of investment at the micro-level. Then, the theoretical relationship between investment and unemployment has been studied by Trejo García et al. (2017) who stated that the monetary level had a positive and significant effect on the availability of labor in the market. Besides, investment also gives essential meaning to opportunities to create labor availability. Investment and monetary levels have a positive and significant effect on exports. Trejo García et al. (2017) also state that exports have an indirect effect on the unemployment rate in the long term. Guerrazzi (2015); Qiong and Junhua (2015);

Omri and kahouli (2014); Sadikova et al. (2017) state that investment, GDP as well as consumption, and investment costs will affect productivity. The domino effect created by increasing productivity is directly proportional to a decrease in the level of unemployment (Elshamy, 2013). However, a different view is expounded by studies by Sadiku et al.

(2015); Ghoshray et al. (2016); Strat et al. (2015), which state that investment does not have a significant effect on reducing unemployment. Sadikova et al. (2017) stated that government regulation through investment that is proactive to the productive labor market in each region will play an important role to be observed.

The theoretical relationship between investment, government expenditure and economic growth, and the causality between the unemployment rate and income Government

Expenditure Unemployment Rate

Investment Economic Growth

Income Inequality H1

H2

H3

H4 H5 H6

H7

H8 H9

H10

Figure 1: Conceptual Framework

(5)

inequality was shown by Afidchao et al. (2014). They stated that investment has a positive and significant effect on economic growth, including investment in the tourism sector and foreign direct investment (Szkorupová, 2014; Mihaiu

& Opreana, 2013). The number of entrepreneurs helps overcome income inequality by absorbing labor (Halvarsson et al., 2018). Inequality of development and welfare will have a significant effect on income inequality (Gächter et al., 2017; Shao et al., 2016). Lavrinovicha et al. (2015) and Kim (2016) stated that government spending affects combating income inequality through improving human capital through education. Education and public expenditure can solve problems regarding the quality of life and income inequality. The effectiveness and efficiency of government expenditures has a positive and significant effect on reducing the unemployment rate through effective allocation of funds (Raišienė et al., 2014; Qiong & Junhua, 2015). On the other hand, poverty will increase the potential for psychological distress and the unemployment rate to impact meeting community needs and cause people to be trapped in poverty (O’Campo et al., 2015).

Government investment and cross-border investment have a positive and significant effect on economic growth.

A growing economy also has an impact on reducing unemployment (Bouwmeester & Scholtens, 2017).

Government investment and spending have a positive and significant effect on economic growth; likewise, spending at the micro level and R&D (Mihaiu & Opreana, 2013;

Candemir & Zalluhoglu, 2011). However, a different opinion is shown by Roşoiu (2015) and Adriana (2014), which state that GDP and government spending does not affect economic growth. The comparative study states that differences in economic growth in a region has a significant effect on income inequality (Han et al., 2015). Kuznets theory can measure the problem of inequality. Inequality comes from government regulations and policies (Lyubimov, 2017). Export and compensation of labor and capital input have a positive and significant effect on reducing potential income inequality. Equitable income will ensure a reduction in income inequality (Saari, Dietzenbacher, & Los, 2015).

A further study states that there are differences in income that cause inequality based on ethnicity, skilled and unskilled labor, and urban and rural areas (Hassan et al., 2015).

3. Research Methods and Materials 3.1. Data Materials

This study is designed to develop an empirical research model through each variable’s direct and indirect relationships, such as investment, government spending, economic growth, unemployment, and income inequality variables in Indonesia. Sources of data used in this study

are Indonesian macroeconomic secondary data, which includes data on the level of development of government investment, data on levels of government spending, data on economic growth, data on unemployment rates, and data on the ratio of income inequality in the territory of Indonesia for the period 2003–2018 (see Table 1). The investment variable refers to the dimensions of domestic and foreign investment. Variable government expenditure refers to dimensions (e.g., ministerial and non-ministerial and institutional expenditures) and regional expenditure, which consists of transfers to the regions, regional balancing funds, regional incentive funds, special autonomy funds, and village funds). The government expenditure indicator is the total amount of the government’s capital expenditure budget for all provinces in billions of Rupiah during the 2003–2018 period. Economic growth variables are measured by GDP for the 2003–2013 period, including the unemployment variable during the 2003–2018 period. The Gini ratio also measures the income inequality variable in this study during the 2003–2018 period.

3.2. Measurement

Secondary data about the variables described previously came from the accumulated average value of 18 provinces in western Indonesia; the first data testing stage is to normalize the data components by computing variables using SPSS with the Ln (Log Natural) method described in Table 1. Second is the testing phase for normality and multicollinearity of data. Third, statistical testing uses linear regression analysis to test the relationship and effect of variables directly (i.e., government expenditure and investment effect on the unemployment rate and economic growth; investment on government expenditure; economic growth. Unemployment rate; economic growth and unemployment rate on income inequality). Fourth, testing the relationship and influence of variables indirectly using the Sobel test (i.e., government expenditure and investment on income inequality, which involves unemployment rate and economic growth as intervening variables. Fifth is the hypothesis testing stage with a standard of significance (p-value < 0.05). Therefore, if it is explained in the linear regression mathematical function, the formula for testing the hypotheses is as follows. The conceptual framework of this study is displayed in Figure 1.

UR = πGE + e

GE

(H1)

GE = πINV+ e

INV

(H2)

EG = πINV + e

INV

(H3)

UR = πINV + e

INV

(H4)

EG = πGE + e

GE

(H5)

UR = πEQ + e

EQ

(H6)

IQ = πUR + e

UR

(H7)

(6)

Table 1: Data Materials Variables Data Period (Ln) 2003 2004 2005 2006 2007 2008 2009 2010 201 1 2012 2013 2014 2015 2016 2017 2018 Investment 6.54 6.6 7.48 7.22 7.61 7.16 7.65 7.8 8.14 8.33 8.56 8.9 9.02 9.23 8.72 9.56 Government Expenditure

29.8 29.52 29.73 29.77 29.4 29.52 29.73 29.77 29.78 29.8 29.8 29.81 29.82 29.82 29.82 29.82 Unemployment 2.2 2.22 2.31 2.29 2.17 2.05 2.02 1.92 1.88 1.7 1.69 1.65 1.74 1.66 1.61 1.57 Economic Growth 1.62 1.46 1.5 1.67 1.7 1.67 1.43 1.77 1.84 1.82 1.75 1.66 1.55 1.61 1.61 1.65 Income Inequality –1.05 –1.14 –1.08 –1.1 1 –1.14 –1.08 –0.99 –1.02 –0.99 –0.97 –0.99 –0.99 –1.02 –1.02 –1.05 –1.05

IQ = πEG + e

EG

(H8)

IQ = πGE + e

GE

(H9)

IQ = πINV + e

INV

(H10)

When combined with equations by MacKinnon et al.

(1995), then the formula is as follows:

Z a

sa a s

var = ×

× + ×

β

β β

(

2 2 2 2

) & μ = Σ Σ

Ln

n (1) So that if it is entered in a linear equation, the mathematical function of the indirect relationship is:

INQ = (Zvar

GE

+ Sα

GE

) + (Zvar

UR

+ Sβ

UR

) + e

(Zvar)

(H11) INQ = (Zvar

INV

+ Sα

INV

) + (Zvar

EG

+ Sβ

EG

) + e

(Zvar)

(H12) INQ = (Zvar

GE

+ Sα

GE

) + (Zvar

EG

+ Sβ

EG

) + e

(Zvar)

(H13) INQ = (Zvar

INV

+ Sα

INV

) + (Zvar

UR

+ Sβ

UR

) + e

(Zvar)

(H14) Information:

UR = Unemployment Rate GE = Government Expenditure INV = Investment

INQ = Income Inequality π = Coefficient Z-var = Sobel test variable

     α = Unstandardized Coefficient value of variable independent-1

      β = Unstandardized Coefficient value of variable independent-2

Sα = Standard error variable-1 on the mediator variable

Sβ = Standard error variable-2 on the mediator variable

e = Standard error

4. Results and Discussion

After going through several testing stages, such as

computing variables using the natural log method and

testing the normality and heteroscedasticity of the data, as

shown in Table 2, it is stated that, for data heteroscedasticity

testing, the entire independent variable has a VIF value <10

so that it is stated that the heteroscedasticity assumption

has been fulfilled and it is feasible to perform regression

demonstrations. The heteroscedasticity test itself assesses

whether there is an inequality of variants from the independent

variables’ residuals to the dependent. The heteroscedasticity

results in this study indicate no similarity invariants, or it

can be assumed that the data distribution pattern is not

centered on one particular point. Furthermore, we still test

(7)

Table 2: Statistical Results

Model Collinearity Statistics

Tolerance VIF

Investment 0.959 1.043

Government Expenditure 0.898 1.114

Economic Growth 0.909 1.100

Unemployment Rate 0.943 1.060

Normality Test Income

Inequality Investment Economic

Growth Government

Expenditure Unemployment Rate

N 16 16 16 16 16

Normal Parameters

Mean –1.0440 8.0309 1.6444 29.7319 1.9182

Std Deviation 0.05302 0.92149 0.11917 0.12992 0.26236

Most Extreme Difference

Absolute 0.163 0.099 0.128 0.311 0.186

Positive 0.111 0.099 0.110 0.243 0.186

Negative –0.163 –0.091 –0.128 –0.311 –0.142

Kolmogorov Smirnov-Z 0.654 0.398 0.512 1.246 0.745

Asymp. Sig. (2-tailed) 0.786 0.997 0.955 0.090 0.635

Direct Effect

Model Unstd. Constant Unstd. Coefficients Std. Coef

T-stat p-value Result

Coef. t-const Sig B Std. Error Beta

GE → UR 36.053 2.731 0.016 –1.148 0.444 –0.569 –2.586 0.022 Support

INV → GE 29.098 115.324 0.000 0.079 0.031 0.560 2.527 0.024 Support

INV → EG 0.459 11.588 0.000 –0.050 0.021 –0.536 –2.378 0.032 Support

INV → UR –1.295 –12.400 0.000 –0.257 0.033 –0.904 –7.903 0.000 Support

GE → EG –2.487 –0.345 0.735 0.139 0.242 0.151 0.573 0.575 Not

Support

EG → UR –1.309 –7.168 0.000 1.935 0.222 0.848 8.734 0.000 Support

UR → INQ –0.783 –10.138 0.000 –0.136 0.040 –0.674 –3.412 0.004 Support

EG → INQ –1.309 –7.168 0.000 –1.309 0.183 –0.674 –7.168 0.000 Support

GE → INQ –9.791 –4.357 0.001 0.294 0.076 0.721 3.893 0.002 Support

INV → INQ –1.295 –12.400 0.000 0.031 0.013 0.542 2.414 0.030 Support

Indirect Effect

Model α β T-test Std.error p-value Result

GE → UR → INQ –1.148 –0.136 0.444 0.040 2.0580 0.0758 0.039 Support

INV → EG → INQ 0.079 –1.309 0.031 0.183 –2.4005 0.0430 0.016 Support

GE → EG → INQ 0.294 –1.309 0.076 0.183 –3.4026 0.1131 0.000 Support

INV → UR → INQ –0.257 –0.136 0.033 0.040 3.1159 0.0112 0.001 Support

(8)

the classical assumption of linear regression, which demands normality requirements in Table 2. It can also be seen that, in Kolmogorov Smirnov’s conclusion, the overall residual value of the variables is normal (Asymp. sig > 0.05). The normality test results also state that this analysis is accepted and then enters the process of testing the significance and the hypothesis (Table 2).

Furthermore, in the third stage, namely, the demonstration of direct variable relationship calculations is carried out, where the government expenditure (GE) variable has a significant adverse effect on the unemployment rate (UR) with a p-value (sig = 0.022 < 0.05). It is assumed that government expenditure will indirectly affect the rise or fall of the unemployment rate. In the regression equation, the constant state the GE coefficient = 36.053 or 3.6%;

if the volume of government expenditure is in units of money measurement as in the data trend, it will constantly reduce the unemployment rate –1.148 or decrease by 0.1%.

The assumption is that every 3.6% increase or decrease in government expenditure budget allocation will trigger an increase or decrease in the unemployment rate of 0.1%.

In the relationship that explains the effect of investment (INV), the government also states that there is a positive and significant effect on government expenditure (GE) with a p-value (0.024 < 0.05). In the regression coefficient, the relationship between INV on GE is 29.98 or 2.9%; the assumption affects GE of 0.079 or 0.07%. This means that an increase or decrease in INV will trigger an increase or decrease in GE by 0.07%. A significant effect is also shown in the relationship between investment on unemployment rate with a significance value <0.01; however, there is no significant correlation between investments on economic growth. Economic growth as the dependent variable is stated to have an insignificant correlation (i.e., investment on economic growth and government expenditure on economic growth).

Then, the relationship between economic growth and the unemployment rate has a positive and significant effect. Through a direct relationship by making the income inequality variable as the dependent variable, it also states two types of significant influence, namely, positive and significant (e.g., government expenditure on income inequality, investment on income inequality) and negative and significant (i.e., the unemployment rate on income inequality, economic growth on income inequality). Positive and significant means that the independent variable directly affects the dependent variable, while negative and significant means that the dependent variable has an indirect effect on the dependent variable. A significant negative effect means that other variables affect the dependent variable;

however, these variables are not derived from this study. Still, as shown in Table 2, the relationship and influence between the variable unemployment rate (UR) and economic growth (EG) on income inequality (INQ) shows a significant negative effect

(–3.412 > –1.98) sig value of UR = 0.004 < 0.05 and sig. value of EG = < 0.01 with the effect of t-statistic = –7.168 > 1.98. The unemployment regression coefficient constantly has a value = –0.783 and –0.136. The assumption is that, if the unemployment rate decreased by –0.7%, it could also reduce the inequality of people’s income by –0.1%. Likewise, on the other hand, if each multiple of 0.7% unemployment rate increases or decreases, it has a linear potential to increase or decrease the multiplication of inequality income ratio per 0.1%. Furthermore, the direct effect relationship regarding the variable relationship between government expenditure (GE) and investment (INV) on income inequality (INQ), as illustrated in Table 2, shows a positive and significant effect. GE with t-statistical coefficient = 3.893

> 1.98 with p-value = 0.002 < 0.05; and INV with t-statistical coefficient = 2.414 > 1.98 with p-value = 0.030 < 0.05.

Furthermore, in the fourth stage, the indirect test of the relationship between government expenditure (GE) on income inequality (INQ) if it is mediated by the variable unemployment rate (UR) has a positive and significant effect (t-test = 2.058 > 1.98; p-value = 0.039 < 0.05). The same thing is also shown by the whole test demonstration indirectly, as in Table 2, which states a significant effect between the independent and dependent variables when combined with the intervening variable. The entire demonstration of the variables that have been tested is described in full, as illustrated in Figure 2.

With regard to the results of statistical testing, if the linearity function is substituted, it is stated as follows:

UR = 36.053 – 1.148

GE

+ 0.444e (H1) GE = 29.098 + 0.079

INV

+ 0.031e (H2) EG = 0.459 – 0.050

INV

+ 0.021e (H3) UR = –1.295 – 0.257

INV

+ 0.033e (H4) EG = –2.487 + 0.139

GE

+ 0.242e (H5) UR = –1.309 + 1.935

EQ

+ 0.222e (H6) IQ = –0.783 – 0.136

UR

+ 0.040e (H7) IQ = –1.309 –1.309

EG

+ 0.183e (H8) IQ = –9.791 + 0.294

GE

+ 0.076e (H9) IQ = –1.295 + 0.031

INV

+ 0.013e (H10) INQ = (–1.148

GE

+ 0.444Sα

GE

) + (–0.136

UR

+ 0.040Sβ

UR

) + 0.0758e (H11) INQ = (0.079

INV

+ 0.031Sα

INV

) + (–1.309

EG

+ 0.183Sβ

EG

) + 0.0430e (H12) INQ = (0.294

GE

+ 0.076Sα

GE

) + (–1.309

EG

+ 0.183Sβ

EG

) + 0.1131e (H13) INQ = (–0.257

INV

+ 0.033Sα

INV

) + (–0.136

UR

+ 0.040Sβ

UR

) + 0.0112e (H14)

(9)

4.2. Discussion

We have demonstrated the relationship and influence between variables using the regression method into a conceptual causality model; in the outline, the combination of 14 hypotheses states that it has a significant effect. The variety of relationships between variables is proven to have an influence both positive and negative on the dependent variable. Some important observations are that government expenditure (GE) and investment (INV) have a significant role in reducing the unemployment rate (UR) and income inequality (INQ). Of course, our study results have many differences with recent studies that previously analyzed the government expenditure relationship. Government expenditure and investment on unemployment rate, where most of the results of previous studies stated a significant positive relationship, our study noted the opposite, namely, a significant adverse effect (Afidchao et al., 2014; Szkorupová, 2014; Mihaiu & Opreana, 2013).

The existence of different research results assumed that there are differences in the designation and funding objectives of both government expenditure and investment; wherein Indonesia itself, the allocation of government expenditure in the Indonesian state budget structure is dominant to finance the operational expenditure needs of institutional and non- ministerial agencies, transfers to provinces and costs to increase the community development index in Indonesia through education and health. Therefore, a significant adverse effect on the relationship between government expenditure (GE) on the unemployment rate (UR) means that the variation in the two variables’ influence is an indirect effect. Government expenditure (GE) in our case study is an analogy that the government budget cannot directly reduce the unemployment rate level before the budget (Government

expenditure) is converted into government work projects.

Government work project budgets that initially come from the central government will then be transferred to various regions/provinces in Indonesia, which will create the potential for temporary employment through the work project. Apart from that, government expenditure (GE) in this case study has an insignificant effect on the potential for economic growth (EG). As previously explained, the assumption why government expenditure does not significantly impact economic growth is that the allocation scheme rather than government expenditure is assumed to have a more significant portion not to increase the level of economic growth directly. But to finance operational expenditure needs and improve public welfare through the sector, education and health are key. Of course, such a scheme was chosen considering the demographic typology of Indonesia, which is an archipelago country with an area of 1,905 million km

2

with a total population until 2021 of 267.7 million people; it is a separate task to arrive at the direction of the government expenditure policy which aims to increase economic growth.

Apart from that, government investment (INV) also has a significant negative effect on economic growth (EG) and the unemployment rate (UR). Investment in this study only involves two types of investment: domestic investment and foreign investment. There is an indirect influence between variables, leading to the assumption that Indonesian government investment is still focused on development sectors or infrastructure development or directed at non- labor-intensive business sectors. Therefore, the assumptions and propositions put forward in this study are not much different from those described in the first paragraph of this section discussion. That investment needs to be extracted into various work activities of the central government or local Government

Expenditure Unemployment Rate

Investment Economic Growth

Income Inequality -2.586 (0.022)

2.527 (0.024)

-2.378 (0.032) -7.903 (0.000)

0.573

(0.575) 8.734 (0.000)

-3.412 (0.004)

-7.168 (0.000) 3.893 (0.002)

2.414 (0.030) GE  UR  INQ = 2.0580 (0.039)

INV  EG  INQ = -2.4005 (0.016)

GE  EG


INQ = -3.4026 (0.000)

INV


UR


INQ = -3.1159 (0.001)

Figure 2: Full Model Analysis

(10)

government to absorb labor which is then expected to reduce the unemployment rate level (Figure 3). The assumptions about this study’s direct impact demonstration are then confirmed and answered clearly on the test results indirectly.

The overall variation in the relationship between variables is a significant effect. Then, government expenditure (GE) and investment (INV) have a positive and significant effect on reducing the level of income inequality (INQ). So, it can be stated that the elasticity of GE and INV has sensitivity to INQ or, in other words, that the problem of income inequality (INQ) in Indonesia is very dependent on the amount of government expenditure and investment budgeted.

Furthermore, this study also describes the effect of the variable unemployment rate (UR) and economic growth (EG) on income inequality (INQ), which has a significant negative impact. It means that it will take a long time to achieve a reduction in income inequality in Indonesia. The vast demographic area as an archipelagic country provides clear evidence that the problem of inequality of income in Indonesia is based on various factors that include creating labor absorption alone and various other factors that, of course, are not present in this study. Therefore the main points of this section are the drawbacks of this study. Similar to the high level of economic growth, which indirectly impacts reducing income inequality in Indonesia, this study illustrates that Indonesia’s economic growth is uneven, or a small group of people only controls economic growth sectors (Figure 3).

In this regard, there are differences in theoretical results both at the middle-range theory level and at the grounded theory, most of which state that there is a significant influence between government expenditure (GE), investment (INV), and the unemployment rate (UR), economic growth (EG) and income inequality (INQ). It provides theoretical findings that the different characteristics and objectives of government expenditure and investment in each country will impact economic growth goals and the unemployment rate.

Then, on the managerial level, this study’s results certainly provide an overview, especially for the government, both at the central government and local levels. To create optimal economic growth through government expenditure and investment allocation, it is necessary to allocate a budget to the industrial sector that can absorb massive labor or on new economic growth sectors.

5. Conclusion

The increase in investment and government expenditure is believed to contribute as a lever on the movement of a nation’s economic development. In the macroeconomy, investment and government expenditure also play a role as a national income component or Gross Domestic Product (GDP). In simple terms, the effect of investment on a country’s economy is reflected in its national income.

Investment is positively correlated with GDP, but differences in this study’s results provide contradictory findings.

1. Government Expenditure - For Government Operational - Health & Education Sector cost

purposes

- Society development program 2. Investment

- Development & Exploration program

- Infrastructure & Manufacturing

Local or Central government

funding transfer Convert

Line

Local or Central Government work-program Convert

Line

Dominan Temporary or the

main workforce labor absorption

Convert Line

Revenue, Expenditure, Consumption and saving

Economic Cycle Tax and Economic

Growth cycle Convert

Line Transformation Line

Figure 3: Government Expenditure and Investment Posture on Unemployment Reduction and Economic Growth Cycle in

Indonesia

(11)

In general, it can be said that, if investment rises, GDP tends to increase or vice versa; if investment falls, GDP tends to decrease. Some economists view the formation of investment and government spending as essential factors that play a strategic role in a country’s economic growth and development. Still, this study’s findings provide another broader understanding of investment and government expenditure that needs to be extracted into various actual work program activities. These two factors (investment and government expenditure) are positive and optimal for economic growth to reduce the unemployment rate and income inequality levels, in connection with increasing and making the influence of government expenditure and investment directly affect economic growth and employment.

Strengthening government regulations and the orientation of using government expenditure and investment budgets are directed at the labor absorption sector and economic growth at both economies of scale, which has become a mainstay, and the economic sector has the potential to create new economic sources.

References

Adriana, D. (2014). Revisiting The Relationship Between Unemployment Rates and Shadow Economy. A Toda- Yamamoto Approach for The Case of Romania. Procedia Economics and Finance, 10(14), 227–236. https://doi.

org/10.1016/s2212-5671(14)00297-4

Afidchao, M. M., Musters, C. J. M., Wossink, A., Balderama, O. F., & De Snoo, G. R. (2014). Analysing The Garm Level Economic Impact of GM Corn in The Philippines. NJAS - Wageningen Journal of Life Sciences, 70, 113–121. https://doi.

org/10.1016/j.njas.2014.05.008

Birčiaková, N., Stávková, J., & Antošová, V. (2014). The Impact of Economic Development in The Czech Republic on The Income Inequality Between Groups of Households. Procedia Economics and Finance, 12(March), 57–65. https://doi.

org/10.1016/s2212-5671(14)00320-7

Blundell, R., Joyce, R., Norris Keiller, A., & Ziliak, J. P. (2018).

Income Inequality and The Labour Market in Britain and The US. Journal of Public Economics, 162, 48–62. https://doi.

org/10.1016/j.jpubeco.2018.04.001

Bouwmeester, M. C., & Scholtens, B. (2017). Cross-Border Investment Expenditure Spillovers in European Gas Infrastructure. Energy Policy, 107(July 2016), 371–380. https://

doi.org/10.1016/j.enpol.2017.05.010

Candemir, A., & Zalluhoglu, A. E. (2011). The Effect of Marketing Expenditures During Financial Crisis: The Case of Turkey.

Procedia - Social and Behavioral Sciences, 24, 291–299.

https://doi.org/10.1016/j.sbspro.2011.09.105

Elshamy, H. (2013). The Relationship Between Unemployment and Output in Egypt. Procedia - Social and Behavioral Sciences, 81, 22–26. https://doi.org/10.1016/j.sbspro.2013.06.381

Gächter, S., Mengel, F., Tsakas, E., & Vostroknutov, A. (2017).

Growth and Inequality in Public Good Provision. Journal of Public Economics, 150, 1–13. https://doi.org/10.1016/

j.jpubeco.2017.03.002

Ghoshray, A., Ordóñez, J., & Sala, H. (2016). Euro, crisis and unemployment: Youth patterns, youth policies?

Economic Modelling, 58, 442–453. https://doi.org/10.1016/

j.econmod.2016.05.017

Goschin, Z. (2015). Territorial Inequalities and Economic Growth in Romania. A Multi-Factor Approach. Procedia Economics and Finance, 22(November 2014), 690–698. https://doi.

org/10.1016/s2212-5671(15)00285-3

Guerrazzi, M. (2015). Animal Spirits, Investment and Unemployment: An old Keynesian View of The Great Recession. EconomiA, 16(3), 343–358. https://doi.org/

10.1016/j.econ.2015.09.002

Halvarsson, D., Korpi, M., & Wennberg, K. (2018). Entrepreneurship and Income Inequality. Journal of Economic Behavior and Organization, 145, 275–293. https://doi.org/10.1016/

j.jebo.2017.11.003

Han, J., Zhao, Q., & Zhang, M. (2015). China’s income inequality in the global context. Perspectives in Science, 7, 24–29. https://

doi.org/10.1016/j.pisc.2015.11.006

Hassan, S. A., Zaman, K., & Gul, S. (2015). The Relationship Between Growth-Inequality-Poverty Triangle and Environ- mental Degradation: Unveiling the Reality. Arab Economic and Business Journal, 10(1), 57–71. https://doi.org/10.1016/

j.aebj.2014.05.007

Khodeir, A. N. (2016). The Relationship Between the Generation of Electricity from Renewable Resources and Unemployment:

An Empirical Study on the Egyptian Economy. Arab Economic and Business Journal, 11(1), 16–30. https://doi.org/10.1016/

j.aebj.2015.10.003

Kim, D. (2016). The associations between US State and Local Social Spending, Income Inequality, and Individual All-cause and Cause-Specific Mortality: The National Longitudinal Mortality Study. Preventive Medicine, 84, 62–68. https://doi.

org/10.1016/j.ypmed.2015.11.013

Kudasheva, T., Kunitsa, S., & Mukhamediyev, B. (2015). Effects of Access to Education and Information-Communication Technology on Income Inequality In Kazakhstan. Procedia - Social and Behavioral Sciences, 191, 940–947. https://doi.

org/10.1016/j.sbspro.2015.04.459

Lavrinovicha, I., Lavrinenko, O., & Teivans-Treinovskis, J. (2015).

Influence of Education on Unemployment Rate and Incomes of Residents. Procedia - Social and Behavioral Sciences, 174, 3824–3831. https://doi.org/10.1016/j.sbspro.2015.01.1120 Lyubimov, I. (2017). Income Inequality Revisited 60 Years Later:

Piketty vs Kuznets. Economic Policy (in Russian), 11(1), 27–42. https://doi.org/10.18288/1994-5124-2016-1-03 MacKinnon, D. P., Warsi, G., & Dwyer, J. H. (1995). A Simulation

Study of Mediated Effect Measures. Multivariate Behavioral

Research, 30(1), 41–62.

(12)

Mihaiu, D. M., & Opreana, A. (2013). The Analysis of The Relationship Between The Level of The Public Expenditure for Investments and de Degree of Development of the Society in Romania. Procedia Economics and Finance, 6(13), 654–661.

https://doi.org/10.1016/s2212-5671(13)00185-8

Monsura, M. P. (2020). The Importance of Financial Literacy:

Household’s Income Mobility Measurement and Decomposition Approach. Journal of Asian Finance, Economics and Business, 7(12), 647–655. https://doi.org/10.13106/jafeb.2019.vol6.no2.299 Nguyen, H. H., & Nguyen, N. Van. (2019). Factor Affecting

Poverty and Policy Implication of Poverty Reduction: A Case Study for the Khmer Ethnic People in Tra Vinh Province, Viet Nam. Journal of Asian Finance, Economics and Business, 6(1), 315–319.

Nurlanova, N. K., Satybaldin, A. A., Brimbetova, N. Z., &

Kireyeva, A. A. (2019). Reduction of Economic Disparities in The Regions of Kazakhstan Based on Inclusive Development.

Journal of Asian Finance, Economics, and Business, 6(2), 299–307. https://doi.org/10.13106/jafeb.2019.vol6.no2.299 O’Campo, P., Molnar, A., Ng, E., Renahy, E., Mitchell, C.,

Shankardass, K., St. John, A., Bambra, C., & Muntaner, C.

(2015). Social Welfare Matters: A Realist Review of When, How, and Why Unemployment Insurance Impacts Poverty and Health. Social Science and Medicine, 132, 88–94. https://doi.

org/10.1016/j.socscimed.2015.03.025

Omri, A., & kahouli, B. (2014). The Nexus Among Foreign Investment, Domestic Capital and Economic Growth: Empirical Evidence from The MENA Region. Research in Economics, 68(3), 257–263. https://doi.org/10.1016/j.rie.2013.11.001 Prasetyo, P. E. (2020). The role of Government Expenditure and

Investment for MSME Growth: Empirical Study in Indonesia.

Journal of Asian Finance, Economics and Business, 7(10), 471–480. https://doi.org/10.13106/jafeb.2020.vol7.no10.471 Qiong, L., & Junhua, H. (2015). Military Expenditure and

Unemployment in China1. Procedia Economics and Finance, 30(15), 498–504. https://doi.org/10.1016/s2212- 5671(15)01247-2

Raišienė, A. G., Bagdonienė, J., & Bilan, Y. (2014). Inter- Institutional Interaction Results: The Effect of EU Programs on the Reduction of Long-term Unemployment. Procedia Economics and Finance, 16(May), 641–650. https://doi.org/

10.1016/s2212-5671(14)00852-1

Roşoiu, I. (2015). The Impact of the Government Revenues and Expenditures on the Economic Growth. Procedia Economics and Finance, 32(15), 526–533. https://doi.org/10.1016/S2212- 5671(15)01428-8

Saari, M. Y., Dietzenbacher, E., & Los, B. (2015). Sources of Income Growth and Inequality Across Ethnic Groups in Malaysia, 1970-2000. World Development, 76, 311–328.

https://doi.org/10.1016/j.worlddev.2015.07.015

Sadikova, M., Faisal, F., & Resatoglu, N. G. (2017). Influence of Energy Ese, Foreign Direct Investment and Population Growth on Unemployment for Russian Federation. Procedia Computer Science, 120, 706–711. https://doi.org/10.1016/

j.procs.2017.11.299

Sadiku, M., Ibraimi, A., & Sadiku, L. (2015). Econometric Estimation of the Relationship Between Unemployment Rate and Economic Growth of FYR of Macedonia. Procedia Economics and Finance, 19(15), 69–81. https://doi.org/

10.1016/s2212-5671(15)00009-x

Salim, A., Rustam, A., Haeruddin, H., Asriati, A., & Putra, A. H. P.

K. (2020). Economic Strategy: Correlation between Macro and Microeconomics on Income Inequality in Indonesia. Journal of Asian Finance, Economics and Business, 7(8), 681–693.

https://doi.org/10.13106/jafeb.2020.vol7.no8.681

Shao, C., Meng, X., Cui, S., Wang, J., & Li, C. (2016). Income- Related Health Inequality of Migrant Workers in China and its Decomposition: An Analysis Based on The 2012 China Labor-Force Dynamics Survey Data. Journal of the Chinese Medical Association, 79(10), 531–537. https://doi.org/10.1016/

j.jcma.2016.02.009

Shen, W., Yang, S. C. S., & Zanna, L. F. (2018). Government Spending Effects in Low-Income Countries. Journal of Development Economics, 133(November 2015), 201–219.

https://doi.org/10.1016/j.jdeveco.2018.02.005

Strat, V. A., Davidescu, A., & Paul, A. M. (2015). FDI and The Unemployment - A Causality Analysis for the Latest EU Members. Procedia Economics and Finance, 23(October 2014), 635–643. https://doi.org/10.1016/S2212-5671(15)00448-7 Suhendra, I., Istikomah, N., Ginanjar, R. A. F., & Anwar,

C. J. (2020). Human Capital, Income Inequality and Economic Variables: A Panel Data Estimation from a Region in Indonesia. Journal of Asian Finance, Economics and Business, 7(10), 571–579. https://doi.org/10.13106/

jafeb.2020.vol7.no10.571

Szkorupová, Z. (2014). A Causal Relationship between Foreign Direct Investment, Economic Growth and Export for Slovakia.

Procedia Economics and Finance, 15, 123–128. https://doi.

org/10.1016/S2212-5671(14)00458-4

Trejo García, J. C., Rivera Hernández, E. C., & Ríos Bolívar, H. (2017). Analysis of The Hysteresis of Unemployment in Mexico in The Face of Macroeconomic Shocks. Contaduría y Administración, 62(4), 1249–1269. https://doi.org/10.1016/

j.cya.2017.06.013

www.kemenkeu.go.id. (2018). Informasi APBN 2018. Online Webpage. https://www.kemenkeu.go.id/media/10409/apbn- kita-edisi-agustus-2018.pdf

www.worldbank.org. (2015). Widespread Inequality in Indonesia.

Online Webpage. http://www.worldbank.org/in/news/feature/

2015/12/08/indonesia-rising-divide

수치

Figure 1: Conceptual Framework
Table 1: Data Materials VariablesData Period (Ln) 2003200420052006200720082009201020112012201320142015201620172018 Investment6.546.67.487.227.617.167.657.88.148.338.568.99.029.238.729.56 Government  Expenditure
Table 2:  Statistical Results
Figure 3: Government Expenditure and Investment Posture on Unemployment Reduction and Economic Growth Cycle in  Indonesia

참조

관련 문서

Second, for the relationship between hospital capability and service orientation, the hospital capability had the positive significant impact on the service orientation in the

As a result of the study, it was confirmed that only human resource competency had a positive(+) effect on the intercompany cooperation method of IT SMEs,

And, it also verified that there are positive moderating effects of internal situational factors on the relationship of entrepreneurship and the performance

The monthly average income had a significant difference in innovation and danger sensibility as business person spirit, in emotional immersion and

First, it was found that some factors of internet fashion shopping mall design quality had significant positive influences on the qualities of relationship to users such

First, as for the relationship between interest factor and self-esteem formation, human relation factor as an interest factor had a significant effect at

Competence had a positive (+) influence on satisfaction with human relationships and self-confidence also had the positive (+) influence. However, in attractiveness,

This study selected collectivism as the independent variable and analyzed the effect of organizational trust and organizational commitment on