- 2103 -
일사량에 따른 전압-전류 특성
황준원1, 정종철1, 김석곤2, 최용성1, 이경섭1 동신대학교1, 한전전력연구원2
I-V Characteristics According to the Irradiation
Jun-Won Hwang1, Jong-Chul Jeong1, Seok-Gon Kim2, Yong-Sung Choi1, Kyung-Sup Lee1 Dongshin University1, Korea Electric Power Research Institute2
Abstract - Solar, as an ideal renewable energy, has inexhaustible, clean and safe characteristics. However, solar energy is an extreme intermittent and inconstant energy source. In order to improve the photovoltaic system efficiency and utilize the solar energy more fully, and the DC current vary with the irradiation, it is necessary to study the characteristics of photovoltaic I-V according to the external factors. This paper presents the analysis of characteristics of photovoltaic I-V according to the irradiation. The results show that the DC current of the photovoltaic system are increased along with the increasing values of irradiation.
1. 서 론
재생산에너지자원을 재발하는 것은 에너지 공급을 증가시키기 위한 중요한 방법이다. 태양열은 이상적인 재생에너지이며 고갈 되지 않고 깨끗하며 안전한 특성을 가지고 있다. 태양열은 환경 오염을 감소시킬 뿐만 아니라 온실효과를 줄일 수 있다. 하지만 태양에너지는 극도로 간헐적이고 변덕스러운 에너지자원이기 때 문에 태양전지 어레이로부터 발전되는 전력은 태양일사량에 따 라 다르다. 태양전지 시스템의 효율성을 개선하고 태양에너지를 좀 더 충분히 이용하기 위해서 일사량과 같은 외부적 효과에 따 라 태양전지 전류-전압 특성을 연구하는 것은 필수적이다.
2. 실 험
실험에서 쓰인 array는 8EA의 싱글 크리스털 실리콘으로 구성되어 있는 모듈이며 모듈의 효율은 16%이다. 실험장치에 관한 설명은 다음과 같다. 장치의 전력은 800[W]이고 MPP(Maximum power point)는 100+
Wp±5[%], MPP에서의 전압은 34.5[V], MPP에서의 전류는 2.90[A], 개 회로 전압은 (Voc) 42.5[V]이며, 단락회로 전류는 (Isc) 3.20[A]이다. 또 한 측정된 데이터는 직류전류[A], 직류전압[V], 교류전류[A], 교류전압 [V], 교류전력[W], 발전[Wh], 모듈 온도 그리고 주위 온도를 포함하고 있다.
3. 결과 및 고찰
그래프 1은 100[W/m2]에서 900[W/m2]까지의 일사량에 따른 전류- 전압 특성을 보여준다. 그래프 1 (a)는 100[W/m2]의 일사량에 따른 전 류-전압 특성을 나타내며 이 조건에서는 240[V] 에서 288[V]까지 직류 전압이 증가함과 동시에 모듈온도가 24[℃] 에서 0[℃] 까지 감소하고 직류전류가 0.186[A] 에서 0.308[A]까지 증가함을 볼 수 있다.
그림 1 (b)는 200[W/m2]의 일사량에 따른 전류-전압 특성을 나타내 며 이 조건에서는 252[V] 에서 299[V]까지 직류전압이 증가함과 동시에 모듈온도가 26[℃] 에서 6[℃] 까지 감소하고 직류전류가 0.45[A] 에서 0.67[A]까지 증가함을 볼 수 있다.
그림 1 (c)는 300[W/m2]의 일사량에 따른 전류-전압 특성을 나타내 며 이 조건에서는 264[V] 에서 291[V]까지 직류전압이 증가함과 동시에 모듈온도가 32[℃] 에서 15[℃] 까지 감소하고 직류전류가 0.712[A] 에서 0.936[A]까지 증가함을 볼 수 있다.
그림 1 (d)는 400[W/m2]의 일사량에 따른 전류-전압 특성을 나타내 며 이 상황에서는 263[V] 에서 296[V]까지 직류전압이 증가함과 동시에 모듈온도가 38[℃] 에서 12[℃] 까지 감소하고 직류전류가 0.984[A] 에서 1.304[A]까지 증가함을 볼 수 있다.
그림 1 (e)는 500[W/m2]의 일사량에 따른 전류-전압 특성을 나타내 며 이 상황에서는 257[V] 에서 292[V]까지 직류전압이 증가함과 동시에 모듈온도가 43[℃] 에서 12[℃] 까지 감소하고 직류전류가 1.294[A] 에서
01.556[A]까지 증가함을 볼 수 있다.
그림 1 (f)는 600[W/m2]의 일사량에 따른 전류-전압 특성을 나타내 며 이 상황에서는 252[V] 에서 292[V]까지 직류전압이 증가함과 동시에 모듈온도가 45[℃] 에서 17[℃] 까지 감소하고 직류전류가 1.634[A]에서 1.86[A]까지 증가함을 볼 수 있다.
그림 1 (g)는 700[W/m2]의 일사량에 따른 전류-전압 특성을 나타내 며 이 상황에서는 250[V] 에서 284[V]까지 직류전압이 증가함과 동시에 모듈온도가 53[℃] 에서 20[℃] 까지 감소하고 직류전류가 1.956[A] 에서 2.148[A]까지 증가함을 볼 수 있다.
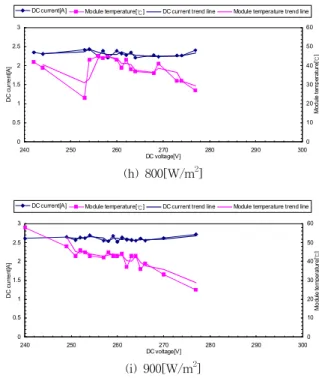
그림 1 (h)는 800[W/m2]의 일사량에 따른 전류-전압 특성을 나타내 며 이 상황에서는 242[V] 에서 277[V]까지 직류전압이 증가함과 동시에 모듈온도가 45[℃] 에서 27[℃] 까지 감소하고 직류전류가 2.212[A] 에서 2.402[A]까지 증가함을 볼 수 있다.
그림 1 (i)는 900[W/m2]의 일사량에 따른 전류-전압 특성을 나타내 며 이 상황에서는 240[V] 에서 277[V]까지 직류전압이 증가함과 동시에 모듈온도가 58[℃] 에서 25[℃] 까지 감소하고 직류전류가 2.526[A] 에서 2.722[A]까지 증가함을 볼 수 있다.
그림 1 (g)는 700[W/m2]의 일사량에 따른 전류-전압 특성을 나타내 며 이 상황에서는 250[V] 에서 284[V]까지 직류전압이 증가함과 동시에 모듈온도가 53[℃] 에서 20[℃] 까지 감소하고 직류전류가 1.956[A] 에서 2.148[A]까지 증가함을 볼 수 있다.
0 0.5 1 1.5 2 2.5 3
240 250 260 270 280 290 300
DC voltage[V]
DC current[A]
0 10 20 30 40 50 60
Module temperature
[℃
]
DC current[A] Module temperature[℃] DC current trend line Module temperature trend line
(a) 100[W/m
2]
0 0.5 1 1.5 2 2.5 3
240 250 260 270 280 290 300
DC voltage[V]
DC current[A]
0 10 20 30 40 50 60
Module temperature
[℃
]
DC current[A] Module temperature[℃] DC current trend line Module temperature trend line
(b) 200[W/m
2]
2009년도 대한전기학회 하계학술대회 논문집 2009. 7. 14 - 17
- 2104 -
0 0.5 1 1.5 2 2.5 3
240 250 260 270 280 290 300
DC voltage[V]
DC current[A]
0 10 20 30 40 50 60
Module temperature
[℃
]
DC current[A] Module temperature[℃] DC current trend line Module temperature trend line
(c) 300[W/m
2]
0 0.5 1 1.5 2 2.5 3
240 250 260 270 280 290 300
DC voltage[V]
DC current[A]
0 10 20 30 40 50 60
Module temperature
[℃]
DC current[A] Module temperature[℃] DC current trend line Module temperature trend line
(d)
400[W/m
2]
0 0.5 1 1.5 2 2.5 3
240 250 260 270 280 290 300
DC voltage[V]
DC current[A]
0 10 20 30 40 50 60
Module temperature
[℃]
DC current[A] Module temperature[℃] DC current trend line Module temperature trend line
(e) 500[W/m
2]
0 0.5 1 1.5 2 2.5 3
240 250 260 270 280 290 300
DC voltage[V]
DC current[A]
0 10 20 30 40 50 60
Module temperature
[℃
]
DC current[A] Module temperature[℃] DC current trend line Module temperature trend line
(f) 600[W/m
2]
0 0.5 1 1.5 2 2.5 3
240 250 260 270 280 290 300
DC voltage[V]
DC current[A]
0 10 20 30 40 50 60
Module temperature
[℃
]
DC current[A] Module temperature[℃] DC current trend line Module temperature trend line
(g) 700[W/m
2]
0 0.5 1 1.5 2 2.5 3
240 250 260 270 280 290 300
DC voltage[V]
DC current[A]
0 10 20 30 40 50 60
Module temperature[℃]
DC current[A] Module temperature[℃] DC current trend line Module temperature trend line
(h) 800[W/m
2]
0 0.5 1 1.5 2 2.5 3
240 250 260 270 280 290 300
DC voltage[V]
DC current[A]
0 10 20 30 40 50 60
Module temperature
[℃
]
DC current[A] Module temperature[℃] DC current trend line Module temperature trend line