AJCPP 2008 March 6-8, 2008, Gyeongju, Korea
Turbopump Performance Prediction by Using CFD Analysis
Chang-Ho Choi, Jun-Gu Noh, Dae-Jin Kim, Soon-Sam Hong, and Jinhan Kim Turbopump Department, Korea Aerospace Research Institute
Daejeon, 305-333, Korea [email protected]
Keywords: Turbopump, Inducer, Impeller, Computation, Axial thrust Abstract
The performance of an entire pump system composed of an inducer, an impeller, a volute and seals has been computationally analyzed. A commercial three dimen- sional Reynolds Averaged Navier-Stokes method is used in this study.
The axial thrust is predicted from the pump calculation in its entirety, which is necessary for such estimation. Moreover, the effects of each component on the pump performance are investigated at a design condition through the analysis of flow structures.
The predicted performance is in good agreement with experimental data in terms of head rise, efficiency and volute wall pressure distributions despite of highly complex flow structures being present. The computational results also show that the axial and radial thrusts are within the design limit although corresponding experimental measurements were not taken.
Introduction
Modern liquid-rocket-propulsion systems generally employ two types of propellant-feed cycles; pressure- feed and turbopump-feed cycles. Since high efficiency and thrust in the propulsion cycle entails high chamber pressure, a pressure-feed cycle is less desirable for highly loaded propulsion systems due to its excessively high tank pressure requirement. On the other hand, a turbopump-feed cycle leads to a comparatively lower system weight and improved performance.(1) Therefore, turbopump systems, which pressurize liquid oxidizers and fuels, are frequently employed to achieve a high specific impulse.
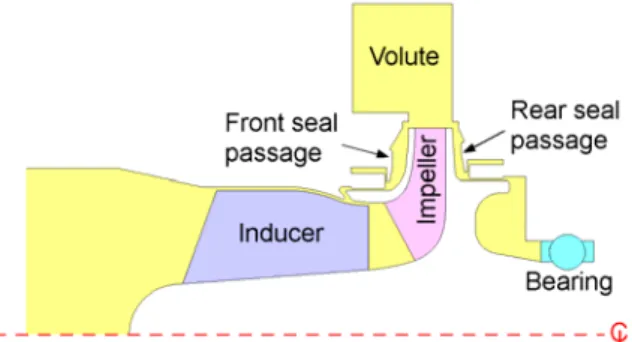
Fig. 1 Typical layout of a pump for turbopumps A typical pump system for turbopumps consists of an inducer, impeller, and volute, including seals, as shown in Fig. 1. An inducer is employed in a modern rocket feed system because it allows a turbopump
system to operate at a high speed with low inlet pressures so as to minimize the weight and the size of the system. Cavitation performance can be improved by installing an inducer to the pump, thus increasing the operational speed of the pump. With the aid of the anti-cavitation function of the inducer, a centrifugal impeller can pump low pressure propellants to high discharge pressures without cavitation breakdown.
Currently, Korea Aerospace Research Institute is making efforts on the development of core components for a demonstrator engine which employs a turbopump system.(2) The main goal of this program is to check the feasibility of technologies. A turbopump is also under development for the 30 ton class of liquid rocket engine. The present study was conducted in line with the development of the 30 ton class engine to see the applicability of the CFD techniques to the hydraulic design of a pump for turbopumps. The entire pump system was included in the computation for the accurate prediction of the important design parameters such as head rise, efficiency, and axial and radial forces which are crucial to the reliable operation of the pump. Table 1 summarizes the design requirements of the pump under consideration.
Table 1 Design requirements of the pump Flow coefficient (φ) 0.091 Rotational speed (RPM) 20,000
Efficiency (%) > 65.0
Axial thrust (kN) < 2.0 Radial force (kN) < 1.0 Critical cavitation number (σ) < 0.03 The flow coefficient and the cavitation number in Table 1 are defined as follows:
φ=Q/(A1U1t) (1)
σ=2(p1t−pv)/(ρU12t) (2)
where Q denotes volume flow rate, A1 pump inlet area, U1t inducer inlet tip speed, pv vapor pressure. The critical cavitation number is defined as the cavitation number when pump head drops 3% from the non- cavitation condition.
Computational Scheme
A commercial 3-D Reynolds Averaged Navier-Stokes (RANS) method is used in this study.(3) The method
403
AJCPP 2008 March 6-8, 2008, Gyeongju, Korea
uses an explicit Runge-Kutta scheme and second- order accurate central-difference scheme with artificial dissipation for integration in time and space.
The k-ε turbulence model with an extended wall function is used to simulate turbulence effects. To accelerate the convergence to a solution, locally varying time-steps, implicit residual smoothing, and multigrid schemes are applied to the governing equations.
A uniform flow condition is imposed at the inlet.
Static pressures are assigned at the outlet of the pump.
Periodic boundary conditions are set at corresponding positions since only one blade passage is solved for the inducer and the impeller. To simulate an inducer/impeller and an impeller/volute interactions, mixing-planes(4) are adopted which only allow exchanges of averaged flow properties. The mixing- plane method is useful in predicting overall flow fields with limited computational resources, but the method is inevitably disadvantaged in predicting detailed flow fields across the mixing plane.
Fig. 2 Computational grids (15 blocks, 1,050,641
cells)
Fig. 3 Meridional grid for computations Figure 2 shows the computational grid of the pump, and Fig. 3 shows the location of the mixing plane for the computation. The value of y+, the dimensionless quantity of the distance of the first grid point from the wall, is kept between 10~50 since the wall function is used.
Experimental Setup
The experiments were performed at a Test Facility at the Korea Aerospace Research Institute, specially
developed for hydraulic and suction performance tests of pump.(5) An outline of the closed-loop test facility is shown in Fig. 4. The test pump is driven by a variable-speed motor with a capacity of 20,000rpm and 320kW and a torque meter is installed between the pump and the motor. The flow rate is measured by a turbine flowmeter and controlled by an automatic regulating valve. The working fluid is water at room temperature.
1. Test pump 2. Regulating valve 3. Turbine flow meter 4. Water tank 5. Torque meter 6. Gear box 7. Motor 4
7
3
5 6
1
2
0 m 1 m
Fig. 4 Plane view of the pump test rig Results and Discussions
Computation was performed only at the design flow rate (100%Qd). Table 2 summarizes the computational results. Most of the pump performance parameters except mechanical efficiency were possibly calculated because all the pump components were included in the computation. Mechanical efficiency was estimated to be 97% in the present pump. The results show that the efficiency and the axial thrust satisfy the design requirements of the pump.
Table 2 Pump calculation results
Parameters values
Flow coefficient (φ) 0.091
Front leakage flow rate ratio (%) 3.2 Rear leakage flow rate ratio (%) 4.7
Head coefficient (ψ) 0.94
Axial thrust (N) (+)1,104
Leakage efficiency (%) 92.6
Disk efficiency (%) 93.8
Volute efficiency (%) 93.6
Internal efficiency (%) 74.3
Mechanical efficiency (%) 97.0
Total efficiency (%) 72.1
The head coefficient in Table 2 is defined as follows:
ψ =2( )/( 2)
2 1
2t pt U t
p − ρ (3) where U2t denotes impeller outlet tip speed.
Figure 5 shows circumferentially-averaged streamline distributions along the meridional plane. Backflows occur at the inlet of the inducer. The fluid in the
rotor/stator interface
404
AJCPP 2008 March 6-8, 2008, Gyeongju, Korea
backflow rotates with the axis and flows upstream.(6) Complex flow structures are shown at the front and rear seal passages.
Figure 6 depicts the static pressure distributions along the meridional plane. Static pressure increases smoothly from the inducer to the impeller. Static pressure coefficient in Fig. 6 is defined as follows:
Cp =2(p−p1t)/(ρU22t) (4)
Figure 7 shows streamline distributions at the mid height of the volute flow passage. It seems that no separation occurs along the flow passage.
Fig. 5 Circumferentially-averaged streamline distributions at the design point
Fig. 6 Circumferentially-averaged static pressure coefficient distributions at the design point
Fig. 7 Streamline distributions along the volute flow passage at the mid height
Figure 8 shows streamline distributions at the four volute cross sections where two vortices develop along the volute flow passage.
Fig. 8 Streamline distributions at the four volute cross sections
Figure 9 depicts the total pressure distributions along the volute flow passage. The large vortex develops along the downstream in line with the streamlines in Fig. 8.
Fig. 9 Total pressure coefficient distributions along the volute flow passage
Table 3 Radial force on the axis
Fx Fy
-73.6 N -423.6 N
Table 3 summarizes the radial force on the axis of the pump. It shows that the radial forces are within the design limit.
0.8 0.9 1 1.1
0.8 0.9 1 1.1 1.2
exp. (8,300RPM) exp. (9,300RPM) cal. (5,000RPM)
Head coefficient (ψ)
Q/Qd
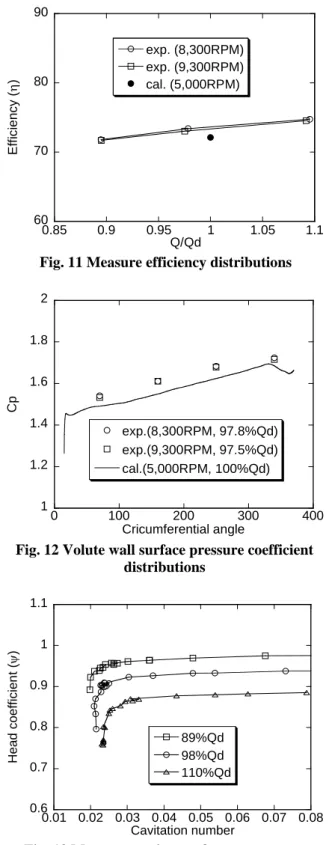
Fig. 10 Measure head coefficient distributions Figure 10 and Fig. 11 show the measured head coefficient and efficiency distributions in comparison with the computational result. The predicted head rise agrees well with the experimental ones. However, the predicted efficiency slightly differs from the experimental ones due to the difference of the rotational speeds (RPM) between the computation and
405
AJCPP 2008 March 6-8, 2008, Gyeongju, Korea
the experiments, and the inaccuracy of the mechanical efficiency estimation.
60 70 80 90
0.85 0.9 0.95 1 1.05 1.1
exp. (8,300RPM) exp. (9,300RPM) cal. (5,000RPM)
Efficiency (η)
Q/Qd
Fig. 11 Measure efficiency distributions
1 1.2 1.4 1.6 1.8 2
0 100 200 300 400
cal.(5,000RPM, 100%Qd) exp.(8,300RPM, 97.8%Qd) exp.(9,300RPM, 97.5%Qd)
Cp
Cricumferential angle
Fig. 12 Volute wall surface pressure coefficient distributions
0.6 0.7 0.8 0.9 1 1.1
0.01 0.02 0.03 0.04 0.05 0.06 0.07 0.08 98%Qd
89%Qd 110%Qd
Head coefficient (ψ)
Cavitation number
Fig. 13 Measure suction performance curves Figure 12 shows the measured volute wall surface pressure distributions in comparison with the prediction. The computation shows a similar trend to the experiments although the computation predicts lower pressure distributions than the experiments because the computational flow rate is higher than the experimental ones.
Figure 13 shows the suction performance. Suction performance calculations were not conducted due to the limitation of the CFD code. The measured critical cavitation number is about 0.025 for the design flow rate, which satisfies the design requirements of the pump.
Conclusion
The performance of an entire pump system composed of an inducer, an impeller, a volute and seals has been computationally analyzed and compared with the available measured data. The predicted performance is in good agreement with experimental data. The computational results also show that the axial and radial thrusts are within the design limit. Therefore, the present study shows that the present CFD method can be applied to the design of the pump system.
Furthermore, the computational results can be used to tune the 1-D design method because all the important design parameters can be obtained from the entire pump calculation.
References
1) Huzel, D. K. and Huang, D. H.: Modern Engineering for Design of Liquid-Propellant Rocket Engines, AIAA Press. 1992.
2) Kim, J., Hong, S. S., Jung, E. H., Choi, C. H., and Jeon, S. M.,: Development of a Turbopump for a 30 Ton Class Engine, Proceedings of the 43rd AIAA/ASME/SAE/ASEE Joint Propulsion Conference & Exhibit, Cincinnati, OH, USA, AIAA-2007-5516, 2007.
3) Fine/Turbo Manual, Ver. 6.2-3, Numeca Inc.
Brussels, 2004.
4) Choi, C. H., and Yoo, J. Y.: Unsteady Blade-Row Flows Calculations Using a Low-Reynolds Number Turbulence Model, Journal of Propulsion and Power, 16 (5), 2000, pp. 768-776.
5) Kim, D. J., Hong, S. S., Choi, C. H., and Kim, J.:
Performance Test of a Fuel Pump for a Turbopump Unit, Proceedings of the 6th KSME- JSME Thermal and Fluids Engineering Conference, Jeju, 2005, EA05.
6) Choi, C. H., Noh, J. G., Kim, J. S., Hong, S. S., and Kim, J.: Effects of a Bearing Strut on the Performance of a Turbopump Inducer, Journal of Propulsion and Power, 22 (6), 2006, pp. 1413- 1417.
406