http://dx.doi.org/10.12925/jkocs.2016.33.4.726
Antibiotics Assay of Doxycycline in Food System using Stripping Voltammetry
Suw Young Ly*․Chang Hyun Lee**
*Biosensor Research Institute, Seoul National University of Technology.
172, gongreung 2 dong, Nowon gu, Seoul, Korea 139-743.
**Department of Integrated Enviromental Systems, Pyeongtaek University, Gyeonggi do, Korea 17869 (Received November 17, 2016; Revised December 4, 2016; Accepted December 23, 2016)
Abstract : A voltammetric analysis of doxycycline was developed using DNA immobilized onto a carbon nanotube paste electrode (PE). An anodic peak current was indicated at 0.2 V (versus Ag/AgCl) in a 0.1M NH4H2PO4 electrolyte solution. The linear working range of the cyclic and square wave stripping voltammetry was obtained to 1-27 ngL-1 with an accumulation time of 800 s. Final analytical parameters were optimized to be as follows: amplitude, 0.35 V; frequency, 500 Hz; and pH, 5.43. Here detection limit was found to be 0.45 ngL-1, this result can be applied in foods systems and in the biological diagnostics
Keywords : Voltammetry, DNA, Carbon nanotube, Doxycycline, assay
1. Introduction
Antibiotics have long been clinically used to treat infectious human diseases〔1-7〕and for veterinary purposes〔8-13〕, With their use, especially as animal disinfectants, freshening agents, and for the diagnosis or treatment of some cancers, several problems have been solved 〔14〕. Due to their widespread use, however, antibiotics are found in almost anything, from food to animal tissue, to the ground, to surface waters, and even in the human body. Doxycycline has been commonly applied on food-producing animals 〔15-16〕, such as honey bees〔17-18〕. Due to the
✝Corresponding author (E-mail: [email protected])
increasing public concern about the environmental effects of antibiotics, a number of investigators recently tried to detect antibiotics〔16〕. Three methods for the analysis of doxycycline were used, such as high-performance liquid chromatography (HPLC)〔19〕capillary elecrophoresis (CE);
thin-layer chromatography (TLC);
spectrophotometry (SP); flow-injection analysis (FIA); ion- selective electrodes (ISE); and coated wire electrodes (CWE) 〔14〕. The detection limits (ppm or ug/ml) of these methods were determined to be as follows:
0.05-0.1 for HPLC, 0.5-1.0 for CE, 2.2 for SP, and 0.4-1.0 for FIA 〔14〕. Due to its low detection limit, HPLC has been recommended for the analysis of doxycycline.
Recently, however, stripping voltammetric methods were applied for doxycycline analysis,
which are more cost-effective than other instrumental techniques〔20〕. In addition, voltammetry is popular due to its low detection limit and its accuracy 〔1〕, 〔21〕.
Furthermore, many researchers have tested DNA immobilization due to its importance in biological assays and the carbon nanotube (CNT) function〔22〕, Since these are very useful methods for analysis in biology. The DNA has a relatively specific affinity in the biological matrix. It also selectively interacts with particular objects, such as dugs and pollutants. In the experiement described in this paper, the DNA-modified electrode especially responded to other molecules and ions 〔23〕.
A CNT surface has specific properties such as chemical stability and high electrical conductivity, which are very useful for an analytical biosensor〔24-25〕. DNA and CNT were combined and applied in the chemical voltammetric analysis of doxycycline with a paste electrode, which is simpler and more cost-effective than other common voltammetric methods. Besides, the detection limit of doxycycline was successfully lowered using this method. It can be applied in several fields such as pharmaceuticals, food, and biological analysis .
2. Experiment
2.1. Apparatus Reagents and the Experimental Procedure
All voltammetric systems were performed with CHI 660A instruments, which are electrochemical instruments from CH Instruments, Inc., U.S.A. For the PE working electrode, DNA and a carbon nanotube were used and were produced by mixing the 40%
heavy graphite nanotube powder, the 40%
heavy, double-stranded calf thymus DNA from Aldrich, and the 20% mineral oil. This mixture was homogenized in a mortar for 30 mins. The mixed paste was inserted in a plastic syringe needle with a diameter of 3
mm, and a copper wire was connected to the electric system. A PE working electrode was used with saturated Ag/AgCl/KCl as the reference electrode, and a platinum auxiliary was used to monitor the SWASV signal. All experimental solutions were prepared from 18 M ohms Cm-1 of double-distilled water.
Afterwards, several electrolyte solutions of acid bases in a 0.1M buffer were investigated in search of a possible supporting electrolyte, and an ammonium phosphate solution was found to be the most suitable. The concentration of NH4H2PO4 was examined at the range of 0.01~0.3 M, and the 0.1M concentrated ammonium phosphate solution effectively responded to the doxycycline solutions. All the measurements were performed in dissolved oxygen and at a room temperature of 24±2°C. DNA immobilization was carried out with a cyclic scan rate of 0.5 V/s, ranging from -0.8 to 0.8 V. The electrode cleaning time was also found to be unnecessary for every measurement. Accordingly, all experiments were performed in an open circuit, and other reagents were obtained from Aldrich.
First, the accumulation potential was tested using 10mgL-1 doxycycline in 0.1M NH4H2PO4. Whether or not the anodic peak had two peak currents and a cathodic peak current was not very clear. As a result of this parameter, the maximum peaks at -1.4 V for the anodic potential and at 1 V for the cathodic potential were obtained. These potentials were used in all the other experiments. Moreover, the DNA and the CNT bare-type electrode were compared, and the DNA-immobilized electrode responded with two hold sensitivity compared to the CNT electrode. The DNA, CNT, and mineral oil mixing ratios were examined, and a satisfactory result of 40%:40%:20% was obtained.
3. Results 3.1. Cyclic Voltammetry
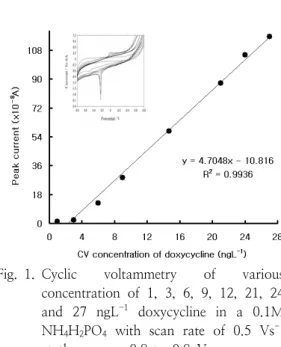
Fig. 1. Cyclic voltammetry of various concentration of 1, 3, 6, 9, 12, 21, 24 and 27 ngL-1 doxycycline in a 0.1M NH4H2PO4 with scan rate of 0.5 Vs-1 at the range -0.8 to 0.8 V
The blank solutions of 0.1M ammonium phosphate were initially scanned within -0.8 to 0.8 V at a scan rate of 0.5 Vs-1 at the base curve, which did not indicate any noise signal. First, the concentration of 1 ngL-1 doxycycline was dropped into the 0.1M NH4H2PO4 buffer electrolyte solution with a pH of 5.42 at 300 s, after which 3 ngL-1 was spiked for each up to 27 ngL-1 to achieve the voltammogram results shown in Fig. 1. As a result, an oxidation peak at 0.2 V and a reduction peak at 0 V appeared. While the reduction peak was scarcely indicated, the height of the oxidation peak appeared proportionally as the concentration increased.
The voltammogram in Fig. 1 indicates an anodic peak and was found to have a linear working curve with a sensitive slop ratio of △ x/△y = 4.7048 and a precision of R2 = 0.9936 (N = 8). Under the optimum conditions, the maximum peak current of 116.5 × 10⁻⁸ A at a doxycycline
concentration of 27 ngL-1 appeared on the anodic peak. These results can be applied in the analytical field. More sensitive analytical conditions were examined, however, using square wave stripping voltammetry.
3.2. Optimization of SW Parameters
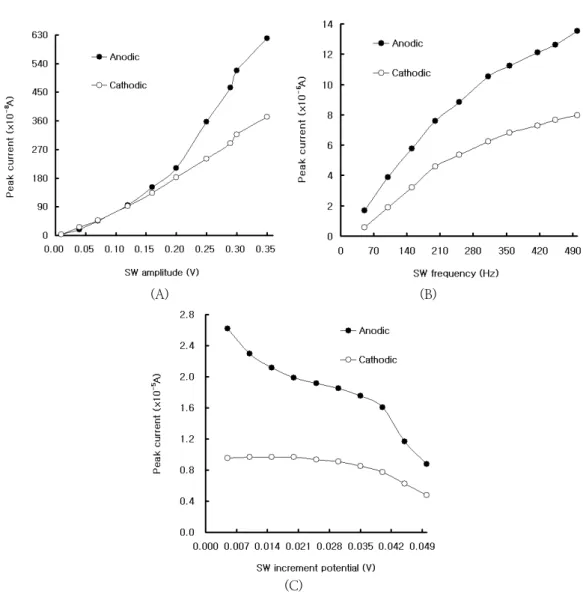
In Fig. 2(A), the SW amplitudes were tested to determine the peak current at the 0.01-0.35V range. The maximum peak currents were 691.2 × 10⁻⁸A for anodic and 372.7 × 10⁻⁸A for cathodic. Both maximum peak currents were obtained in 0.35 V, showing sensitive responses. Thus, these potential ranges were used in all the other experiments. Both the anodic and cathodic peak currents increased with similar figures at the range of 0.01-0.2 V, after which the anodic peak current responded more sharply than the cathodic peak current. Fig. 2(B) illustrates the stripping peak current of frequencies on the oxidation and reduction peak height for 50-500 Hz, using a fixed 5mgL-1 doxycycline concentration. The peak currents increased steadily, and 13.53 × 10⁻⁶ A on the oxidation peak and 7.959 × 10⁻⁶ A on the reduction peak, both at 500 Hz, were optimized. The anodic peak current appeared more sharply than the cathodic peak. Fig. 2(C) shows the peak currents of various incremental potentials, from 0.005 to 0.05 V, for 30 s in fixed concentrations of 5mgL-1 doxycycline.
The peak currents of these potentials linearly decreased on both the anodic and cathodic peaks. Thus, at 0.005 V, the maximum peak current of 2.621 × 10⁻⁵ A appeared on the anodic peak, whereas at 0.015 V, the maximum peak current of 0.9797 × 10⁻⁵ A appeared on the cathodic peak. As to the parameters of amplitude and frequency, the blank solutions were shown to be very smooth. No noise peak signal appeared in the electrolyte solution, and gradually increasing signals appeared. In the incremental potential, narrowed peak signals sharply appeared and linearly increasing signals were obtained. They
(A) (B)
(C)
Fig. 2. Anodic and cathodic various square wave conditions: (A) amplitudes of 0.01, 0.04, 0.07, 0.12, 0.16, 0.20, 0.25, 0.29, 0.30 and 0.35 V. (B) frequencies of 50, 100, 151, 200, 250, 312, 357, 416, 454 and 500 Hz. (C) peak currents in SW increment for 0.005, 0.01, 0.015, 0.02, 0.025, 0.03, 0.035, 0.04, 0.045 and 0.05 Hz. Other parameters as in Fig. 3.
responded much better than did the amplitude or frequency peak currents.
3.3. Square Wave Given Various Parameters
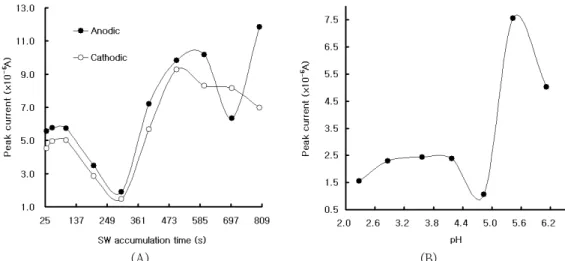
In Fig. 3(A), the SW accumulation times within 30 to 800 s were conducted in fixed concentrations of 5mgL-1 doxycycline. They did not appear linearly both on the oxidation
and reduction peak currents. At 100 to 300 s, both sharply decreased whereas at 30-100 s, slight noises emerged. Then the anodic peak rapidly increased at the range of 300-600 s, whereas the cathodic peak increased at 300-500 s. After this, it kept decreasing on the reduction peak, and the maximum peak of 9.287 × 10⁻⁶ A was obtained at 500 s. The oxidation peak of 600-700 s decreased and
(A) (B)
Fig. 3. (A) Anodic and cathodic accumulation peak currents in 5 mgL-1 doxycycline for 30, 50, 100, 200, 300, 400, 500, 600, 700 and 800 s. (B) An oxidation peak for 50 s currents in a concentration of 10 mgL-1 doxycycline of 2.27, 2.86, 3.57, 4.18, 4.83, 5.43 and 6.12 pH
then increased at 700-800 s, such that the maximum peak signal of 11.84 × 10⁻⁶ A was obtained. Fig. 3(B) shows the stripping voltammetric peak current in a 10mgL-1 concentration of doxycycline within the pH range of 2.27-6.12. It responded less sensitively than did the accumulation time, having been pegged to the deposition time for 50 s to suit the required sensitivity and experimental speed. At the pH of 2.27-4.18, the peak current plateaued and stopped increasing, then decreased at 4.18-4.83 pH, after which it very sensitively increased by 5.43 pH. In this study, the optimum condition was reached at a pH of 5.43 with a maximum peak of 7.568 × 10⁻⁶ A. For this parameter, only the oxidation peak current was shown, since the reduction peak current did not appear. Moreover, it was poorly influenced compared to the peak current of the accumulation time.
4. Discussion
4.1. Statistics and Application
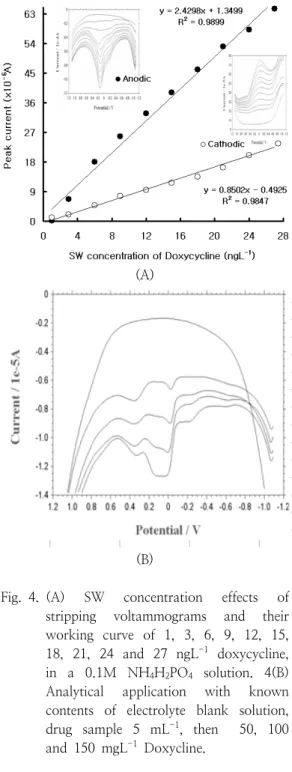
Under the optimum conditions, various working ranges and their applications were examined with SW stripping voltammetry. In Fig. 4(A), at the concentration range of 1-27ngL-1 doxycycline, oxidation and reduction peak currents linearly appeared. The anodic width of the doxycycline peak narrowed more than its cathodic peak at a deposition time of 300 s of the stripping voltammograms. The linear equation of y = 2.4298x + 1.3499 and its precision of R2 = 0.9899 with 10 points was obtained with on oxidation peak. As for the reduction peak, it was found to be a working curve that increased with a sensitive slop ratio of △x/△y
= 0.8502 and a precision of R2 = 0.9847 (N
= 10). The anodic peak showed a more sensitive peak width than did the cathodic peak. Moreover, the detection limit was estimated to be 0.45 ngL-1 on a signal-to-noise basis at the optimized SW conditions. All these results can be used in any other doxycycline analysis field. In addition, possible interference ions were tested by adding
other metals and their analog organic ions to the medium containing 1 mgL-1 of doxycycline. To detect the presence of an interference, a 5% or greater change was applied at the peak high of the doxycycline concentration. At the spike of 1 mgL-1 of doxycycline, the existence of 10 mgL-1 of Ba, Co, Ca, Hg, Bi, Fe, Ge, Cr, oxytetra, tetra, and chlortetra resulted in -45%, 106.29%, 552.61%, 57.51%, -35.46%, -2.23%, 12.96%, 5.48%, -22.42%, -3.09%, and 1.77%, respectively. The presence of other interference ions was also effectively corrected using standard addition methods. An analytical application was performed with fixed known samples of a 1,000mg/2g D-company drug. In Fig. 4(B), the first peak shows the electrolyte solution results, and no peak signal and noise appeared. Then the known drug sample of 5 mL-1 was spiked, and at this state, a small peak was obtained at the same potential, such that another standard of 50-, 100-, and 150mgL-1 doxycycline was spiked. These results were calculated using standard addition methods, yielding a linear equation of y = 10.227x + 0.6599 and a precision of R2 = 0.9772 that were examined five times, and a mean 95% confidence limit was obtained.
More analytical applications were conducted with other pegged known concentrations, and good results were obtained. A very low detection limit of 0.45 ngL-1 was achieved with this method compared with other common voltammetric methods, and a more sensitive detection limit was obtained.
A DNA and a carbon nanotube paste electrode were used to detect low doxycycline concentrations using the cyclic and square wave stripping voltammetric method. This method showed more attractive properties than other common voltammetric methods, and could be applied to the detection of doxycycline concentration at nanogram levels.
Analytical applications of doxycycline were also performed and various interference ions were corrected using standard addition
methods. This method can be used in other fields requiring doxycycline analysis in foods or in the human body.
(A)
(B)
Fig. 4. (A) SW concentration effects of stripping voltammograms and their working curve of 1, 3, 6, 9, 12, 15, 18, 21, 24 and 27 ngL-1 doxycycline, in a 0.1M NH4H2PO4 solution. 4(B) Analytical application with known contents of electrolyte blank solution, drug sample 5 mL-1, then 50, 100 and 150 mgL-1 Doxycline.
References
1. Paul, A. B., Hans, C. H. L., Hai, P. M., Bent, H. S., Alistair, B. A. B., Paul, K., (2004) Fast and robust simultaneous determination of three veterinary antibiotics in ground water and surface water using a tandem solid-phase extraction with high-performance liquid chromatography-UV detection, J Chromatogr A, 1045, 111-117.
2. Pilar, V., Nuria, B., & Carmen, L. E., (2004) Manuel Hernandez-Cordoba, Liquid chromatography with ultraviolet absorbance detection for the analysis of tetracycline.
3. Anne, M. J., Bent, H. S., Flemming, I., &
Steen, H. H., (2004) Simultaneous extraction of tetracycline, macrolide and sulfonamide antibiotics from agricultural soils using pressurised liquid extraction, followed by solid-phase extraction and liquid chromatography-tandem mass spectrometry, J Chromat A, 1038, 157-170.
4. Eva, R. S., Tjaˇsa, P., Vera, M., &
Franc, S., (2005) Susceptibility of Borrelia afzelii strains to antimicrobial agents, In J Antimicrob Ag 25, 474-478.
5. Xiaojing, D., & Shifen, M., (2000) Ion chromatographic analysis of tetracyclines using polymeric column and acidic eluent, J Chromatogr A, 89, 205-214.
6. Rosie, C., Oivind, B., & Ole, B. S., (2004) Short communication One step liquid chromatographic method for the determination of oxytetracycline in fish muscle, J Chromatogr B, 810, 325-328.
7. Shinwoo, Y., & Kenneth, C., (2004) Routine monitoring of antibiotics in water and wastewater with a radioimmunoassay technique, Water Res 3, 3155-3166.
8. Papadoyannis, I.N., Samanidou, V.F., &
Kovatsi, L.A., (2000) A rapid high performance liquid chromatographic (HPLC) assay for the determination of
oxytetracycline in commercial pharmaceuticals, J Pharmaceut Biomed 23, 275-280.
9. Hans, S., Flemming, I., Richard, A., Bent, H. S., JimK, B., Christian, J. W., David, J.
J., & Keith, R. S., (2005) Dissipation of oxytetracycline, chlortetracycline, tetracycline and doxycycline using HPLC.UV and LC/MS/MS under aquatic semi-.eld microcosm conditions, Chemosphere 60, 619-629.
10. Nozal, L., Arce, L., Simonet, B.M., Rios, A., & Valcarcel, M., (2004) Rapid determination of trace levels of tetracyclines in surface water using a continuous flow manifold coupled to a capillary electrophoresis system, Anal Chim Acta 517, 89-94.
11. Marzanna, K., & Agnieszka, K. M., (2004) Electrochemical determination of oxytetracycline in veterinary drugs, J Pharmaceut Biome 34, 95-102.
12. Fernandez, G. R, Garcia, F. M. S., &
Simal, G. J., (2000) Quantitative analysis for oxytetracycline in medicated premixes and feeds by second-derivative synchronous spectrofluorimetry, Anal Chim Acta 455. 143-148.
13. Anne, K. L., Bent, H. S., Claus, C., Jette, T., & Steen, H. H., (2004) Quantitative analysis of oxytetracycline and its impurities by LC-MS-MS, J Pharm Biomed 34, 325-332.
14. Xian, X. S., Xu, Z., Hassan, Y.,& Aboul, E., (2004) Construction and characterization of potentiometric sensor for the determination of oxytetracycline hydrochloride, IL FARMACO 59, 307-314.
15. Wangfuengkanagul, N., Siangproh, W., &
Chailapakul, O., (2004) A flow injection method for the analysis of tetracycline antibiotics in pharmaceutical formulations using electrochemical detection at anodized boron-doped diamond thin film electrode, Talanta 64, 1183-1188.
16. Zhu, J., Snow, D.D., Cassada, D.A., Monson, S.J., & Spalding, R.F. (2001) Analysis of oxytetracycline, tetracycline, and chlortetracycline in water using solid-phase extraction and liquid chromatography- tandem mass spectrometry, J ChromatogrA, 928.
177-186.
17. Hisao, O., Yuko, I., & Hiroshi, M., (2000) Chromatographic analysis of tetracycline antibiotics in foods, J Chromat A, 882, 109-133.
18. Marc, C., Mario, S,, Siska, C., & Patrick, D. B., (2003) Quantitative multi-residue analysis of tetracyclines and their 4-epimers in pig tissues by high-performance liquid chromatography combined with positive-ion electrospray ionization mass spectrometry, Anal Chim Acta 492, 199-213.
19. Hisao, O., Yuko, I., & Hiroshi, M., (2000) Chromatographic analysis of tetracycline antibiotics in foods, J Chromat A, 882, 109-133.
20. Marzanna, K., & Agnieszka, K. M., (2004) Electrochemical determination of oxytetracycline inveterinary drugs, J Pharmaceut Biome 34, 95-102.
21. Nagwa, A. E., (2004) Voltammetric analysis of drugs, Bioelectrochemistry 64, 99-107.
22. Adriano, A., Riccarda, A., Luigi, C., Roberto, D., & Irma, L. (2005) Electrochemical determination of pharmaceuticals in spiked water samples, J Hazard Mater 122, 219-225.
23. Manli, G., Jinhua, C., Dengyou, L., Lihua, N., & Shouzhuo, Y., (2004) Electrochemical characteristics of the immobilization of calf thymus DNA molecules on multi-walled carbon nanotubes, Bioelectrochemistry 62, 29-35.
24. Yuan, D. Z., Dai, W. P., Shen, Hu., Zong, L. W., Jie, K. C., & Hong, P. D., (1999) DNA-modified electrodes; part 4:
optimization of covalent immobilization of DNA on self-assembled monolayers, Talanta 49, 751-756.
25. Ge, Z., Kuaizhi. L., Song. L., Ji. L., Xinyong. G., & Zhijun, Z. (2003) Application of a Carbon Nanotube Modified Electrode in Anodic Stripping Voltammetry for Determination of Trace Amounts of 6-Benzylaminopurine, Microchim. Acta 143, 255-260.
26. Gang, W., Jing, J.X., & Hong, Y. C.
(2002) Interfacing cytochrome c to electrodes with a DNA