2004, Vol. 15, No. 4, pp. 993∼1002
Fully Efficient Fractional Imputation for Incomplete Contingency Tables
Shin-Soo Kang1)
Abstract
Imputation procedures such as fully efficient fractional imputation(FEFI) or multiple imputation(MI) can be used to construct complete contingency tables from samples with partially classified responses. Variances of FEFI estimators of population proportions are derived. Simulation results, when data are missing completely at random, reveal that FEFI provides more efficient estimates of population than either multiple imputation(MI) based on data augmentation or complete case analysis, but neither FEFI nor MI provides an improvement over complete-case(CC) analysis with respect to accuracy of estimation of some parameters for association between two variables like θi + θ+ j- θij and log odds-ratio.
Keywords : Complete Case Analysis, Multiple Imputation
1. Introduction
In the analysis of contingency tables, it may happen that some observations are not fully cross-classified. This issue has been studied for a long time. One simple approach, known as complete-case(CC) analysis, discards the missing data by restricting analysis to only fully classified counts in an incomplete contingency table.
An alternative approach involves constructing a complete table, in which all cases are completed classified, by imputing information for the missing row or column classification. Multiple imputation, proposed by Rubin (1978), provides a way to take advantage of commonly used tests of independence for completely classified tables.
1) Professor, Department of Information Statistics, Kwandong University, Kangnung, 210-701, Korea
E-mail: [email protected]
Fractional imputation was discussed by Kalton and Kish (1984) and Fay (1996).
It is a hot deck imputation procedure that uses more than one responding unit as a donor for a missing unit. The fully efficient fractional imputation(FEFI) procedure described by Kim and Fuller (2004) uses every responding unit within a designated imputation group as a donor for a unit with missing information.
This provides a single completed table and has some practical advantages over MI in that a single completed table can be published for public use.
Little and Rubin (2002) discuss three general mechanisms for missing data:
missing completely at random(MCAR), missing at random(MAR), and not missing at random(NMAR).
Let X1 and X2 denote categorical variables for a two-way incomplete contingency table. If the missing probability of Xi does not depend on either the value of the other variable or the value of Xi, then it is MCAR. If the missing probability of Xi depends on the value of the other variable but not on the value of Xi, then it is MAR. If the missing probability of Xi depends on its value, then it is NMAR.
FEFI is easily implemented in two-way incomplete contingency tables when we assume that the mechanisms that lead to missing dat are `MCAR'. FEFI imputes a number of values for the missing information on each partially classified observation along with a set of weights.
FEFI, and MI are reviewed in section 3. Small sample relative efficiency and bias are examined through Monte Carlo simulation in section 4. Methods for obtaining covariance matrices for FEFI estimates of population proportions are discussed in section 5.
2. Notation
Consider an I× J contingency table where the row factor X1 has I categories and the column factor X2 has J categories. Assume simple random sampling with replacement. In a complete table, where the row and column categories are observed for every case in the sample, the counts have a multinomial distribution with sample size N and probability vector θ. Let nij denote the count for the ( i,j) cell, and let θij, an element of θ, denote the population proportion for the ( i,j) cell.
When information on either the row or column classification is missing, we can construct a table of counts for the completely classified cases where xij denotes the number of cases observed in the ( i,j) cell. We can also construct one-way
tables of counts for partially classified cases. Let xim denote the number of cases in the ith row category, i = 1,2,…,I, where the column category is unknown, and let xmj denote the number of cases in the jth column category, j = 1,2,…,J, where the row category is unknown. Then, xim and xmj are marginally observed counts on a single variable. Let xmm denote the number of cases where both the row and column categories are missing. The total sample size is
N = ∑
ijxij+∑
i xim+∑
j xmj+ xmm
= ncc+x+ m+xm ++xmm.
3. Estimates of the population proportions 3.1 FEFI estimates under MCAR
Fully efficient fractional imputation(FEFI) is a kind of hot deck imputation which uses every responding unit as a donor for a missing unit within any particular imputation group. For a two-way contingency table obtained from a sample with no auxiliary variables, the imputation group for a unit with observed value of the row factor X1 but missing X2, the value of the column factor, is the set of complete cases with the same value of X1. Similarly, the imputation group for a unit with missing value of X1 is the set of complete cases with the same value of X2. This simplifies the implementation of FEFI.
For a unit with only X2 missing, imputation fractions for the J possible values of X2 are obtained from the conditional frequencies of X2 in the cross-classified table of complete cases given the observed value of X1. The analogous procedure is used for any unit with only X1 missing. For a unit with missing information for both X1 and X2, we impute I× J possible values with imputation fractions corresponding to the joint frequencies of X1 and X2 incorporating all partial information.
For example, consider a 2× 2 incomplete contingency table where X1 and X2
assume values of 0 or 1 from a simple random sample of size N = 88 and assume a completely missing at random mechanism. Table 1 shows observed counts for the 9 possible response patterns, using `?' to indicate a missing value for the corresponding variable.
Table 1: Response patterns for a 2× 2 incomplete contingency table
X1 1 1 0 0 ? ? 1 0 ?
X2 1 0 1 0 1 0 ? ? ?
Counts 5 10 15 20 8 9 6 7 8
Imputed information for the 8 observations with pattern (?,1) is btained from the relative frequencies of the (1,1) and (0,1) responses as shown in Table 2. The imputation fraction for (1,1), given the (?,1) response pattern is x11/x+ 1= 5/( 5 +15) = 0.25, which corresponds to allocating 8×0.25 = 2 counts to (1,1) from (?,1), and allocating 6 counts to (0,1) from (?,1). This procedure is repeated for the (?,0), (1,?), and (0,?) patterns yielding the allocated counts shown in Table 2.
Table 2: FEFI for partially classified cases in Table 1
X1 ? ? 1 0
X2 1 0 ? ?
Counts 8 9 6 7
Allocation (1,1) (0,1) (1,0) (0,0) (1,1) (1,0) (0,1) (0,0)
FEFI 2 6 3 6 2 4 3 4
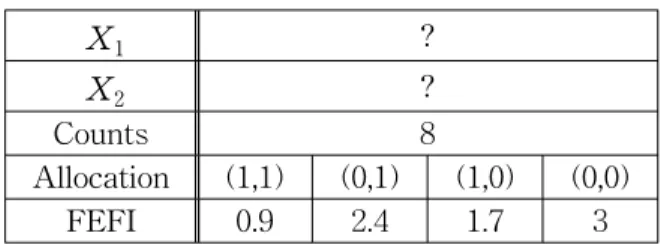
The updated complete table shown in Table 3, incorporates all partial information; it does not include the units with missing information on both variables. The 8 observed counts in (?,?) are allocated to (1,1), (1,0), (0,1) or (0,0) with respect to the relative frequencies 9/80, 17/80, 24/80, 30/80 obtained from Table 3. The resulting FEFI allocations from (?,?) are shown in Table 4. The completed table provided by FEFI is shown in Table 5.
Table 3: Updated table using complete and partial complete cases
X1 1 1 0 0 ?
X2 1 0 1 0 ?
Counts 9 17 24 30 8
Table 4: FEFI for cases with no information
X1 ?
X2 ?
Counts 8
Allocation (1,1) (0,1) (1,0) (0,0)
FEFI 0.9 2.4 1.7 3
Table 5: FEFI completed table based on N
X1 1 1 0 0
X2 1 0 1 0
Counts 9.9 18.7 26.4 33
The counts in the completed table obtained by fully efficient fractional imputation under simple random sampling are given by the following formula:
ˆn
ij
* = xij+ xij
(
xxi +im + xx+ jmj)
+ N-xxijxmmmm(
1 +xxi +im + xx+ jmj)
= xij
(
1 + xxi +im + xx+ jmj)(
1 + N-xxmmmm)
,(1)
where xij is the observed count for fully observed cases prior to imputation, xi +=∑J
j = 1xij and x+ j= ∑I
i = 1xij . The total sample size is N =∑
ij ˆn
ij
*. Discarding the xmm cases for which both variables are missing does not affect the relative allocation in the completed table. The relative allocation in Table 5 is the same as the relative allocation in the first four columns of Table 3. Those cases do not contain any information about the joint distribution of X1 and X2. Therefore (1) can be simplified as
ˆn
ij= xij
(
1 + xxi +im + xx+ jmj)
,with N changed to n=N- xmm. The FEFI estimates of the population proportions are
ˆθ
FEFI = 1
n ( nˆ
11, nˆ
12, …, nˆ
1J, nˆ
21, nˆ
22, …, nˆ
2J, …, nˆ
IJ)'
= 1
N ( ˆn
11
*, ˆn
12
*,…, nˆ
1J
*, ˆn
21
*, ˆn
22
*,…, nˆ
2J
*,…, nˆ
IJ
*)'.
3.2 MI estimates
The multiple imputation(MI) procedure proposed by Rubin (1978) offers another possibility for estimation of cell probabilities for an incomplete contingency table.
Suppose there are D imputed data sets. Each imputed data set is analyzed using the standard complete-data method. Let ˆθ
d, d = 1,…,D be the standard complete-data estimates for the vector of cell probabilities from the D imputed data sets. Then, MI estimates of the cell probabilities are given by
θD= 1 D ∑D
d = 1ˆθ
d.
4. Simulation Results
All of the 2× 2 incomplete contingency tables for this study were generated with equal cell probabilities and data missing completely at random. Four combinations of sample size and level of missing data were considered and 1000 tables were generated for each combination. X1 and X2 were independently generated as Bernoulli(0.5) random variables. There are two levels 200 and 400 for the total sample size N. MXi is a missing indicator variable independent of Xi. If MXi= 1, the corresponding variable Xi is missing. The four combinations of factors are summarized in Table 6. The percentages of cases with missing information on at least one variable are expected to be 19%, 36%, 51%, and 91%
for combination 1, 2, 3, and 4, respectively.
Table 6: Combination of factors MXi∼Ber( p)
Combination N p
1 200 0.1
2 200 0.2
3 200 0.3
4 400 0.7
θ11and θ 1 + θ + 1- θ11 were estimated by FEFI,MI, and complete-case analysis(CC). CC is a standard complete-data analysis discarding all missing cases. For multiple imputation, data augmentation with Jeffreys noninformative prior(Box and Tiao, 1992) was used to generate imputed data and construct 5 completed tables through S-PLUS 6.1(2001) functions for missing values. Mean and standard errors(S.E.) of 1000 values of the point estimates are shown in Table 7 and Table 8.
Table 7 shows means and standard errors of 1000 values for the estimates of θ11. The true value of θ11 is 0.25. All four methods provide essentially unbiased estimates for the cell probabilities. The standard errors of the estimates differ across methods. Complete-case analysis provides the estimate of θ11 with the largest variance. For all methods, variation increases as the proportion of missing values increases. FEFI tends to provide smaller standard errors of cell proportion than MI in most cases, but the standard error of the MI estimator was smaller than FEFI for combination 4 which had largest proportion of missing values.
Table 7: Estimation of θ11
Combination FEFI MI CC
Mean S.E. Mean S.E. Mean S.E.
1 0.2488 0.0340 0.2488 0.0340 0.2489 0.0352 2 0.2489 0.0344 0.2487 0.0358 0.2491 0.0367 3 0.2483 0.0399 0.2485 0.0409 0.2490 0.0444 4 0.2513 0.0566 0.2521 0.0555 0.2518 0.0722 Table 8 shows means and standard errors of 1000 simulated values for the estimates of θ 1 + θ+ 1- θ11, a measure of association between the two variables, when the true value of θ1 + θ+ 1- θ11 is 0. The averages of the estimates are similar for all methods, but the complete-case exhibits smaller standard errors than FEFI or MI.
Table 8: Estimation of θ1 + θ+ 1- θ11
FEFI MI CC
Combi. Mean S.E. Mean S.E. Mean S.E.
1 -0.000011 0.02002 0.000033 0.02042 -0.000010 0.01999 2 -0.000082 0.02242 0.000154 0.02311 -0.000079 0.02235 3 0.000815 0.02495 0.000627 0.02603 0.000792 0.02479 4 -0.000493 0.04277 -0.001406 0.04479 -0.000650 0.04117
The imputation methods, FEFI and MI can not provide more information on association between two variables than what is present in the observed data.
Although the imputation methods improve the estimation of individual cell probabilities relative to complete-case analysis, the covariance matrix for estimated cell probabilities is also affected by imputation.
5. Variance of FEFI Estimates
An estimate of the large sample variance-covariance matrix of the FEFI estimates of cell probabilities is derived using the delta method.
Let C0= ( x11,…,x1J,x21,…,x2J,…xIJ,xm1,…,xmJ,x1m,…xIm)'. Conditional on the value of xmm, C0 has a multinomial distribution with sample size
n= N- xmm and probabilities
π = ( π11,…,π1J,π21,…,π2J,…πIJ,πm1,…,πmJ,π1m,…πIm)'.
The variance-covariance matrix of C0 is Var(C0) = n(Δπ- ππ'), where Δπ is a diagonal matrix with the elements of π on the main diagonal.
Each element of ˆθ
FEFI is a function of the elements of C0. By the delta method, the variance of ˆθ
FEFI is derived as
Var( θˆ
FEFI)= 1
n D(Δπ- ππ')D'≡ΣF, where
D p×q= ꀌ
ꀘ
︳︳
︳︳
︳︳
︳︳
︳︳
︳︳
︳︳
︳︳
︳︳
︳︳
︳︳
︳︳
︳︳
︳
ꀍ
ꀙ
︳︳
︳︳
︳︳
︳︳
︳︳
︳︳
︳︳
︳︳
︳︳
︳︳
︳︳
︳︳
︳︳
︳
∂ nˆ
11
∂x11 … ∂ nˆ
11
∂xIJ
∂ nˆ
11
∂xm1 … ∂ nˆ
11
∂xmJ
∂ nˆ
11
∂x1m … ∂ nˆ
11
∂xIm
∂ nˆ
12
∂x11 … ∂ nˆ
12
∂xIJ
∂ nˆ
12
∂xm1 … ∂ nˆ
12
∂xmJ
∂ nˆ
12
∂x1m … ∂ nˆ
12
∂xIm
⋯ ⋯ ⋯
∂ nˆ
IJ
∂x11 … … … … ∂ nˆ
IJ
∂xmJ
∂ nˆ
IJ
∂x1m … ∂ nˆ
IJ
∂xIm ,
and p = I×J, q = I×J + I + J, with
∂ nˆ
ij
∂xcd = ꀊ
ꀖ ꀈ
︳︳
︳︳
︳︳
︳︳
︳︳
︳︳
︳︳
︳︳
︳︳
︳︳
︳︳
︳︳
︳︳
︳︳
︳︳
︳︳
︳︳
︳︳
︳︳
︳︳
1 +
(
xxi +im + xx+ jmj)
- xij(
xx2i+im + xx2+ jmj)
, c = i and d = j-
(
xijxx2i +im)
, c = i, d≠j, and d≠m -(
xijxx2+ jmj)
, c≠i, d = j, and c≠mxij
x+ j , c = m and d = j
xij
xi + , c = i and d = m
0, otherwise .
By the Central Limit Theorem and the Delta method, the FEFI estimators have an approximate multivariate normal distribution with expectation θ and variance
ΣF.
6. Discussion
Imputation using FEFI or MI provides more efficient estimates of cell probabilities than complete-case(CC) analysis. When data are missing completely at random and other covariates are not available, neither FEFI nor MI provides an improvement over complete-case(CC) analysis with respect to accuracy of estimation of some parameters for association between two variables like
θi + θ+ j- θij and log odds-ratio.
When data are missing completely at random, FEFI is easier to implement than MI. Explicit formulas for estimates of cell probabilities are given in (1). If the missing mechanism does not satisfy missing completely at random(MCAR) criterion, complete-case(CC) analysis can produce biased estimates of joint probabilities and distorted p-value for tests of independence. The FEFI method described in this article yields consistent estimators of cell probabilities if the missing mechanism is MCAR, but it is not necessarily consistent if data are simply missing at random(MAR). The allocation of the partially classified counts must be modified for fully efficient fractional imputation(FEFI) to provide consistent estimates for the MAR situation. MI provides consistent results under either the MAR situation.
Another approach to estimation of joint cell probabilities that can be applied when the missing mechanism is either MCAR or MAR is maximum likelihood estimation using both the complete and partially classified cases. Little(1982) developed a simple EM algorithm for two way contingency tables. This approach does as well as FEFI in estimation of the joint probabilities, but variance
estimation is more complicated.
References
1. Box, G. E. P., and Tio, G. C. (1992). Bayesian Inference in Statistical Analysis, (Wiley Classics Library Edition). J. Wiley and Sons, New York.
2. Fay, R. E. (1996). Alternative paradigms for the analysis of imputed survey data, Journal of the American Statistical Association, 91, 490-498.
3. Kalton, G., and Kish, L. (1981). Two Efficient Random Imputation Procedures, Proceedings of the Survey Research Methods Section, American Statistical Association, 146-151.
4. Kim, J. K., and Fuller, W. (2004). Fractional Hot deck imputation, Biometrika, 91, 559-578.
5. Little, R. J. A. (1982). Models for nonresponse in sample surveys.
Journal of the American Statistical Association, 77, 237-250.
6. Little, R. J. A., and Rubin, D. B. (2002). Statistical analysis with missing data, J. Wiley and Sons, New York.
7. Rubin, D. B. (1978). Multiple Imputation in Sample Surveys - A Phenomenological Bayesian Approach to Nonresponse, Proceedings of the Survey Research Methods Section, American Statistical Association, 1978, 20-34.
8. S-Plus 6.1 Manual (2001). Analyzing Data with Missing Values in S-Plus, Insightful Corporation. Seattle, Washington.
[ received date : Sep. 2004, accepted date : Nov. 2004 ]