ISSN 2288-1069 (Online)
http://dx.doi.org/10.12925/jkocs.2013.30.2.197
Diagnostic Calculation of Trace Calcium Ions in Food Using a DNA doped Sensor
Young-Kyun Yang1․Suw-Young Ly2✝
1Department of Basic Education Seoul National University of Technology.
2Biosensor Research Institute in Seoul National University of Technology.
Address: 172, gongreung 2 dong Nowon gu, Seoul, South Korea, 139-743.
(Received March 14, 2013 ; Revised June 28, 2013 ; Accepted June 28, 2013)
Abstract : The diagnostic assay of calcium ion was sought using a modified sensor with square-wave stripping voltammetry (SWSV) and cyclic voltammetry (CV). In this study, simple graphite pencil was used as working, reference, and auxiliary electrodes. By coating the working electrodes with DNA, their sensitivity was very much improved, and good results were yielded.
Moreover, clean seawater was used as an electrolyte solution instead of acid and base electrolytes to lessen the expenses involved in the experiment. The analytical optimum conditions were also examined. These conditions were attained at the low detection limit of 0.6 ugL¹. After that, the results were applied to drinking water of milk contain.
Keywords ; Diagnostic Calculation, DNA doped Sensor, Voltammetry, Calcium ion, Food
INTRODUCTION
Ionized calcium as an intracellular second messenger is ubiquitous and controls many essential biological processes. From the beginning of life to death, calcium signals regulatory processes, such as fertilization, proliferation, differentiation, secretion, contraction, transcription, phosphorylation, and apoptosis [1]. Dietary calcium has also been suggested to be capable of protecting against colorectal cancer [2]. With respect to calcium, its possible effect is thought to be mediated at least in part through the intrahuninal precipitation of hydrophobic, cytotoxic
✝Corresponding author
(E-mail : [email protected])
substances, particularly fatty and bile acids, which can promote colorectal-cancer development [2]. The data from studies in vitro and in animals support the protective effect of calcium, but the studies conducted on humans, both epidemiological and interventional, have given inconclusive results [3]. Particularly promising in terms of the prevention and treatment of cancer is the selective induction of programmed death, or apoptosis, in cancer cells, and cellular Ca2+
signals have been strongly implicated in triggering and regulating cell death [3]. It has been hypothesized that calcium reduces the risk of colon cancer by forming insoluble soaps with ionized fatty acids and secondary bile acids in the colon lumen, potentially diminishing the proliferative stimulus of these
substances on the colon mucosa [4]. It was also recently shown that the intake of calcium can affect the incidence of cancer [5, 6].
Calcium is abundant in the water in Taiwan, where the intake of calcium is much higher than that in Finland [5,6]. The incidence of cancer in these two countries is lower than that in any other country [5,6]. This also shows that calcium is related to cancer.
Recently various analytical methods were considered, such as laser ablation mass spectrometry [7], sequential injection analysis [8], simultaneous thermal analysis [9, 10], speciation of uoride and calcium [11], microfluidic technology [12], FT-IR spectroscopy [13], sequential injection analysis [14], ultrasensitive flow injection analysis [15], and the utilization of multibubble sonophotoluminescence [16]. These spectric methods, however, are expensive and time-consuming. Besides, low-priced voltammetric methods have already been developed, such as those that utilize an alizarin-nafion-modified electrode [17], an ionic-liquid-type carbon paste electrode [18], a PVC-based dibenzo-18-crown-6 electrode [19], and a composite-film-modified glassy carbon electrode [20]. These methods have high detection limits. In this experiment, the Ag/AgCl and platinum wire electrodes were used as a reference electrode and an auxiliary electrode, respectively, and phosphate was used as an electrolyte solution. These are expensive, however, and phosphate can contaminate water. In this study, however, low-cost graphites were used instead of the Ag/AgCl and platinum wire electrodes, and clean seawater was used instead of an acid-base electrolyte solution. These are very economical and eco-friendly.
Experimental Apparatus and Reagents
The experiment was conducted using the bioelectronics-2 (our systems), working electrode was prepared with DNA (double-stranded calf thymus sigma reagent
solution) immobilization on the graphite pencil lead (Pental B type 0.5 mm diameter and 10 mm length) working (DPE) sensor through a cyclic scan with an initial potential of + 2.0 V, a switching potential of –2.0 V, and a scan rate of 0.5 mVs-1 with a tan cyclic repeat to stabilize the electrode surface.
Immobilized structure was very stable and the electrolyte blank condition did not appear to have any DNA peak current. In the redox condition, a counter and reference electrode were used with graphite pencil. All electrolyte solutions were derived from double-distilled water (-18 M Ohm Cm-1) and analytical grade reagent, and the electrolyte blank solution that was used had clean sea water as the supporting electrolyte. A stock solution of 1000 mgl-1Ca(II) was used in the preparation of sigma standard and was diluted at every instance of measurement. All experiments were carried out in an open circuit in the presence of oxygen.
RESULTS AND DISCUSSION
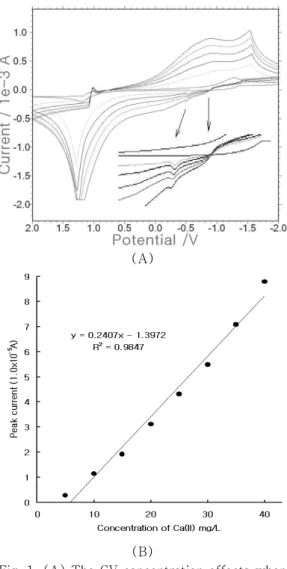
In this experiment, three graphites were used as a working, reference, and auxiliary electrode, respectively. Only the working electrode was coated with DNA. Moreover, clean seawater was used as the electrolyte solution. First, the calcium variations were examined using cyclic scanning with DPE. The 10, 20, 30, 40, 50, 60, 70, and 80 mgL⁻¹ Ca were spiked, in that order. After the 10 mgL⁻¹ Ca concentration was given, no signal was obtained. When the 20, 30, 40, and 50 Ca ranges were spiked, the 0.4 V peak current increased from 0.3764x10⁻⁵ to 1.138x10⁻⁵ A during the oxidation scan. When 50 mgL⁻¹ Ca was given, however, it decreased to 0.4524x10⁻⁵ A. After 70 mgL⁻¹ Ca was spiked, it increased again to 2.05x10⁻⁵ A, and when 80 mgL⁻¹ Ca was spiked, it decreased again to 1.798x10⁻⁵ A. Moreover, various concentrations of calcium were
(A)
(B)
Fig. 1. (A) The CV concentration effects when DPE was used within the 10-80 mgL⁻¹ range, with three pencils as the working, reference, and auxiliary electrodes, respectively, and with seawater as the electrolyte solution. (B) The various SW concentrations of calcium when DPE was used within the 5-40 mgL⁻¹ range, with three pencil electrodes and with seawater as the electrolyte solution, under the optimum
examined via square-wave voltammetry, using DPE. Fig. 1(B) shows the SW result of Ca within the 5, 10, 15, 20, 25, 30, 35, and
40mgL⁻¹ranges. It increased continuously from 0.2873 to 8.79x10⁻⁵ A. The shape of the curve was oblique under anodic stripping. The equation was y=0.240x-1.397, and the precision was R²=0.984. When 5 mgL⁻¹ Ca was spiked, the SW voltammogram did not obtain any signal, but even though 10 mgL⁻¹ Ca was spiked, the peak current obtained a clear signal. This shows that square-wave voltammetry is more sensitive than cyclic voltammetry. For this reason, square-wave voltammetry (SW) were optimized.
SW optimizations of DPE
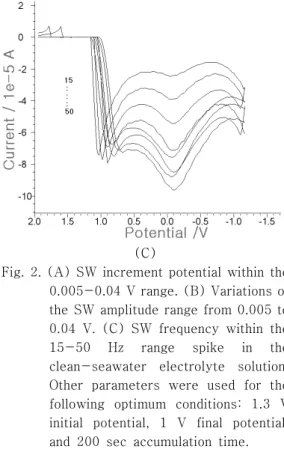
For the optimum conditions, the SW parameters were examined using DPE. Fig. 2A shows the SW increment potential variation for eight points within the 0.005, 0.01, 0.015, 0302, 03025, 0.03, 0.035, and 0.04 V ranges.
The width of the calcium peak narrowed at around -0.2 V. The peak current increased from 0.145x10⁻⁵ to 5.57x10⁻⁵ A within the 0.005~0.015 V range but slightly decreased to 3.908x10⁻⁵ A at the 0.02 V increment. It increased again to 9.438x10⁻⁵ A at 0.025 V, which is the maximum current. After that, it decreased from 8.073 to 7.302x10⁻⁵ A within the 0.03-0.04 V range. The 0.025 V increment was thus chosen as an optimum condition.
Under this condition, Fig. 2B shows the SW amplitude potential variation for eight points within the 0.005, 0.01, 0.015, 0.02, 0.025, 0.03, 0.035, and 0.04 V ranges. The peak current obtained no signal at 0.005 V amp. It increased continuously from 6.437 to 9.539x10⁻⁵ A within the 0.01-0.025 V amp range. At 0.025 V amp, the maximum current was obtained. After 0.025 V amp, it decreased from 7.145 to 4.231x10⁻⁵ A step by step.
Therefore, 0.025 V amp was chosen as an optimum condition. Fig. 2C shows the SW frequency variation for eight points within the 15, 20, 25, 30, 35, 40, 45, and 50 Hz ranges.
The peak current of the SW frequency increased from 0.237 to 3.09x10⁻⁵ A within
the 15-35 Hz range and slightly decreased to 2.913x10⁻⁵ A at 43 Hz. It increased from 3.498x10⁻⁵ to 3.717x10⁻⁵ A, however, within the 45-50 Hz range. As 3.717x10⁻⁵ was the maximum current, 50 Hz was chosen as an optimum condition. The other SW parameters were –1.3 V accumulation potential, 1 V final potential, and 200 sec accumulation time.
These results were applied to the statistics and working ranges in this study.
(A)
(B)
(C)
Fig. 2. (A) SW increment potential within the 0.005-0.04 V range. (B) Variations of the SW amplitude range from 0.005 to 0.04 V. (C) SW frequency within the 15-50 Hz range spike in the clean-seawater electrolyte solution.
Other parameters were used for the following optimum conditions: 1.3 V initial potential, 1 V final potential, and 200 sec accumulation time.
Working ranges and statistics
Under the optimized conditions, the analytical statistics and working ranges were examined with DPE under the SW condition.
Fig. 3A shows the statistics when SW was used. To determine the stability of DPE, the statistics were examined. First, 1 mgL⁻¹ calcium was spiked and was tested 15 times repeat. The peak current varied from 1.36 to 2.48x10⁻⁵ A, and the standard deviation was 0.309855, which is stable for application.
Under these conditions, the experimental low concentration was also examined. Fig. 3B shows the SW result of the microgram variation. The 1, 2, 3, 4, 5, 6, 7, and 8 ugL⁻¹ Ca concentrations were examined, and their peak currents were found to have increased from 0.423 to 3.513x10⁻⁵ A. The peak current became narrower and deeper as the Ca concentrations were spiked. The equation of the SW result within the
(A) (B)
(C) (D)
Fig. 3. (A) The statistics with a 0.025 V increment, 0.025 V amplitude, 50 Hz frequency, -1.7 V initial potential, 1 V final potential, and 180 sec accumulation time. (B) The SW effect in the microgram concentration using (A). The analytical application of milk fortified with calcium, using DPE with SW (C) and CV (D).
microgram range was y=0.426x+0.125, and the precision was R²=0.987. Moreover, the curve of the SW result in the low concentration was very sharp. It shows that square-wave stripping using DPE is effective and sensitive enough to detect Ca despite a low concentration of such.
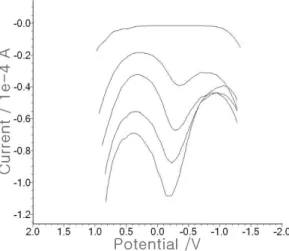
Analytical application was then conducted in this study. Much calcium can be found in milk, which usually contains 400 mg/L Ca(II).
As milk fortified with calcium is already
available these days, it was applied using DPE under the optimum conditions. Cyclic (Fig.
3D) and square-wave voltammetry (Fig. 3C) were used in this application. Here, the standard addition method was used. In the blank seawater of the SW solution, no signal was obtained, and when 0.1 ml milk was spiked, two small 0.15x10⁻⁵ A peak currents were obtained. Thus, the 1, 2, 3, 4, 5, 6, 7, and 8 mgL⁻¹ Ca standards were continuously spiked, and 400+-0.8 mg/L
calculation results were obtained.
In-vivo and in-vitro assay applications The developed sensor and optimum conditions were used to measure the Ca content of the drinking water. Fig. 4 shows the SW result of the application to drinking water. The standard addition method was also used. First, 0.1 mL drinking water was spiked, and the peak current 1.141x10⁻⁵ A was obtained. After that, the 0.1 mL Ca standard was spiked three times, and 2.45, 3.774, and 5.252x10⁻⁵ A peak currents were obtained, respectively. The equation was y=1.283x+0.013, and the precision was R²=0.994 (not shown here). These results show that asmall quality of Ca exists in drinking water. It also shows that DPE is minute and sensitive enough to measure Ca.
Fig. 4. Analytical applications of the standard addition methods for drinking water using SW voltammetry and the optimum parameters.
CONCLUSION
The novel DPE sensor showed an outstanding effect on the detection of Ca in this study. The 0.025 V increment, 0.025 V amplitude, 50 Hz frequency, -1.7 V initial
potential, 1 V final potential, and 180 sec accumulation time were obtained as optimum conditions. After that, analytical application was conducted under the optimum conditions.
First, it was applied to milk fortified with calcium, where twice as much calcium as that contained by standard milk was found.
Moreover, the application of tap water was conducted under the optimum conditions, with SWSV. Although an infinitesimal amount of Ca exists in drinking water, it can be measured using a DPE electrode with stripping.
It can also be applied in other fields requiring interfacial diagnosis in humans, foods, and animals.
Acknowledgement
This work was supported by Seoul National University of Science and Technology
References
1. W J Lee, G R. Monteith, Sarah J. R Thomson, Calcium transport and signaling in the mammary gland:Targets for breast cancer, Biochimica et Biophysica Acta 235 (2006)
2. J. H. Kleibeuker, R. V Meer, E.G.E. Vries, Calcium and Vitamin D: Possible Protective Agents Against Colorectal Cancer, European journal of Cancer.718, 1081 (1995)
3. I N. Sergeev, Calcium signaling in cancer and vitamin D, Journal of Steroid Biochemistry & Molecular Biology 97 145 (2005)
4. J. V Salas, P. B-Palau, C. P Felis, S. M Garcia, S. P-Holanda, Calcium Inhibits Colon Carcinogenesis in an Experimental Model in the Rat, European Journal of Cancer, 34,. 1941 (1998)
5. H S Park, C J Kim, Effect of dietary fat and calcium level on the biomarkers of
colon cancer in 1,2-dimethylhydrazine- treated rats, Nutrition Research 22 365 (2002)
6. CY Yang, S S Tsai, T C Lai, C F Hung, H F Chiu, Rectal Cancer Mortality and Total Hardness Levels in Taiwan’'s Drinking Water, Environmental Research Section A 80, 311 (1999)
7. A M. Beccaglia, C A. Rinaldi, J C.
Ferrero, Analysis of arsenic and calcium in soil samples by laser ablation mass spectrometry, Analytica Chimica Acta 11 (2006)
8. J.F. van Staden, R.E. Taljaard, Determination of calcium in water, urine and pharmaceutical samples by sequential injection analysis, Analytica Chimica Acta 75 (1996)
9. J Kaloustian, T F.Moselhy, H Portugal, Determination of calcium oxalate (mono- and dihydrate) in mixtures with magnesium ammonium phosphate or uric acid: the use of simultaneous thermal analysis in urinary calculi, Clinica Chimica Acta 117 (2003) 10. I I. Maes, G Gryglewicz, J Yperman, D V.
Franco, J Mullens, C. V Poucke, Effect of calcium and calcium minerals in coal on its thermal analysis, 76, 143 (1997) 11. M Trojanowicza, P W. Alexanderb, D. B
Hibbert, Flow-injection analysis wit potentiometric detection for the speciation of uoride and calcium, Analytica Chimica Acta 366 23 (1998)
12. C. F. Lin, C.H. Wang, W. Y. Liao, T.C.
Chou- B. Lee, Hydrogen and calcium ion electrochemical detecting systems using microfluidic technology, Micro & Nano Letters, 1 29 (2006)
13. N.V. Vagenas, A. Gatsouli, C.G.
Kontoyannis, Quantitative analysis of synthetic calcium carbonate polymorphs using FT-IR spectroscopy, Talanta 59 831 (2003)
14. J Nyman, A Ivaska, Spectrophotometric determination of calcium in paper machine white water by sequential injection analysis, Analytica Chimica Acta 308 286 (1995) 15. R. Traversi, S. Becagli, E. Castellano, V.
Maggi, A. Morganti , M. Severi, R. Udisti, Ultra-sensitive Flow Injection Analysis (FIA) determination of calcium in ice cores at ppt level, Analytica Chimica Acta 594 219 (2007)
16. Y Nie, J Lv, Utilizing multibubble sonophotoluminscence for calcium quantitative analysis in pharmaceuticals, Ultrasonics Sonochemistry 15 344 (2008) 17. G Jo, M S Won, Y B Shim, Amperometric Determination of Calcium Ion with an Alizarin /Nafion Modified Electrode, Department of Chemistry and Chemistry Institute of Functional Materials, Pusan National University, Pusan 609, Korea 18. J Zheng, Y Zhang, P Yang,, An ionic
liquid-type carbon paste electrode for electrochemical investigation and determination of calcium dobesilate, Talanta 73, 920 (2007)
19. A Kumar, S. K. Mittal, PVC based dibenzo-18-crown-6 electrode for Ca(II) ions , Sensors and Actuators 340 (2004) 20. X Zhang, S Wang, L Jia, Z Xu, Y Zeng,
"An electrochemical sensor for determination of calcium dobesilate based on PoPD/MWNTs composite film modified glassy carbon electrode", J. Biochem.
Biophys. Methods, 70, 1203 (2008)