†Member, Professor, Department of Civil Engineering, Hanyang Univ., Korea (E-mail : [email protected])
* Member, Directer, Hakyong Engineering Co., Ltd., Seoul, Korea
원형수직구의 흙막이 벽체에 작용하는 주동토압
Active Earth Pressure Acting
on the Cylindrical Retaining Wall of a Shaft
천병식† 신영완*
Chun, Byungsik† ․ Shin, Youngwan*
Abstract
It is well known that earth pressure on the cylindrical open caisson and cylindrical retaining wall of a shaft is less than that at-rest and in plane strain condition because of the horizontal and vertical arching effects due to wall displacement and stress relief. In order to examine the earth pressure distribution of a cylindrical wall, model tests were performed in dry sand for the care of constant wall displacement with depth. Model test apparatus which can control wall displacement, wall friction, and wall shape ratio was developed. The effects of various factors that influence earth pressure acting on the cylindrical retaining wall of a shaft were investigated.
Keywords : Active earth pressure, Arching effect, Cylinderical retaining wall, Model test
요 지
원형 오픈 케이슨과 원형 수직구에 설치된 흙막이 벽에 작용하는 토압은, 벽체의 변위와 응력해방으로 인한 수평 및 연직 아칭효과로 인하여, 평면 변형조건에서의 옹벽에 작용하는 토압보다는 작은 토압이 발생한다. 원 형벽체에 작용하는 토압분포를 조사하기 위해서, 건조한 모래지반에서 깊이에 따른 벽체변형이 균등한 조건의 모형실험을 실시하였다. 벽체 변위, 벽면 마찰, 벽체 형상비 등을 조절할 수 있는 모형 실험 장치가 개발되었 고, 모형실험을 통하여 원통형 벽체에 작용하는 토압에 대한 다양한 인자의 영향이 분석되었다.
주요어 : 주동토압, 아칭효과, 원통형 벽체, 모형실험 한국지반환경공학회 논문집 제7권 제4호 2006년 8월 pp. 15~24
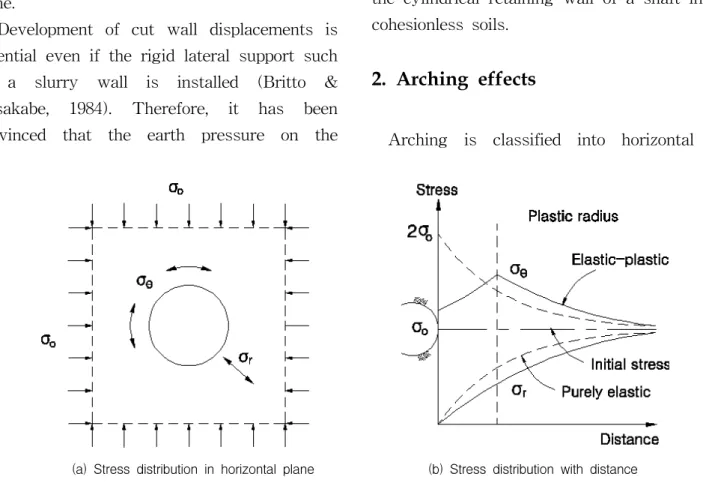
(a) Stress distribution in horizontal plane (b) Stress distribution with distance
Fig. 1. Arching effect by a circular hole (Fara et al. 1963)
1. Introduction
A shaft which is a vertical, slender and long structure should be designed by methods different from that for the horizontal long tunnel. In plan the shaft is to be designed generally with a circular shape in spite of the fact that this offers less advantageous utilization of space than the rectangular one.
Also, when a structure is constructed in the river or in the sea, the open caisson is applied to the foundation of structure and it is designed with circular section. However, this is outweighed by far by the considerable advantages offered in the reduction of external pressure due to arching effects in a horizontal plane.
Development of cut wall displacements is essential even if the rigid lateral support such as a slurry wall is installed (Britto &
Kusakabe, 1984). Therefore, it has been convinced that the earth pressure on the
cylindrical retaining wall is less than at-rest and active earth pressures in plane strain condition because of the stress relief induced by horizontal and vertical arching effects by excavation. Noticing this point, many researchers have made efforts to examine the earth pressure distribution and the shape of ground failure surface by model tests.
However, the active earth pressure distributions on cylindrical wall which have been measured in some model tests show various values, and the studies on the earth pressure with wall displacement are deficient.
Accordingly, in this study, the earth pressure distribution and the shape of failure surface were observed by model tests for the cylindrical retaining wall of a shaft in dry cohesionless soils.
2. Arching effects
Arching is classified into horizontal and
vertical ones by the direction of gravity. Many authors have studied on earth pressure considering the arching. These are mostly studies on vertical arching. Vertical arching by ground failure surface and soil-wall friction makes the stress transfer to a stationary part or an adjacent wall. After all, the horizontal pressure on the wall is reduced as the downward vertical stress decreases. In circular shaft, besides horizontal arching, vertical arching arises. As shown in Fig. 1, Fara and Wright(1963) proved analytically that if a shaft was excavated, the radial and tangential stress were equal to the initial stresses at first and then if the surrounding soil particles move toward the cut wall, the radial stress decreases in elastic and plastic zones and the tangential stress increases in elastic zone but decreases in plastic zone.
3. Review of existing model tests
3.1 Berlin model tests
Müller-Kirchenbauer et al.(1980) carried out a series of model tests to measure earth pressures exerted by dry sand on a cylindrical wall. The model wall for the 65cm deep shaft with a diameter of 10cm was fabricated from hollow, cylindrical steel sections. The bottom portion was equipped with a sharp-edged shoe. A recess of several millimeters was provided behind the shoe to simulate various amounts of soil displacement during excavation. The shaft was sunk into a test container filled with sand (grain size ranging between 0.2 and 1.0mm, the maximum porosity=44%, the minimum porosity=32.5%) compacted to a desired relative density. The soil was within the
shaft and the forces on the shaft wall were determined at various depths by two excavated from monitoring methods of model Ⅰ and model
Ⅱ. In model Ⅰ, the frictional forces on the shaft wall were measured, and the active pressures on the rings were calculated indirectly by assuming a constant angle of wall friction. In model Ⅱ, three sets of strain gauges, positioned at 120゚ to each other, were bound to each steel segment and the wall was calibrated to monitor the radial pressure directly. In both models, several earth pressure cells were placed in the sand to detect the radial stresses outside the shaft before, during, and after excavation. The vertical settlement profiles at the ground were also recorded.
The higher recorded pressure corresponds to the model without recess. A trend toward an ultimate pressure that is independent of depth is apparent.
The pressure decreases rapidly if small displacements are allowed to occur and reaches a minimum at recesses of less than 1~3mm (=2~
6% of the opening size). With larger recesses, this force seems to increase slightly or remains constant. The measured pressures were obtained by averaging readings from sensors around the circumference of the shaft. Assuming an initial vertical stress equal to the overburden pressure, the calculated K
0- values range from 0.55~1.43.
During stress relief due to shaft excavation, the radial stress decreased significantly even at a distance of twice as long as wall radius. However, Müller-Kirchenbauer et al. did not measure continuously the earth pressures with wall displacements but measured discontinuously them for some displacements.
3.2 Cambridge centrifuge model tests
Centrifuge tests were performed by Lade et al.(1981) to study the behavior of deep, vertical shafts in dry sand. The model test setup consisted of a 69.5cm deep circular drum with a diameter of 85cm. The shaft was free excavated and made of polyethylene Melinex.
The physical properties of the shaft wall are tensile strength of 176.5 MPa, yield strength of 98.1 MPa, and Young's modulus of 4300 MPa at 1% strain. Various instruments were installed to study the shaft behavior. For example, radial strains were measured by strain gauges bonded to the surface of the shaft wall, and pressure cells, placed in the soil, monitored the vertical, radial, and tangential stresses at seven locations. The vertical settlement of the lining and the vertical movement of the bottom of the shaft were recorded by linearly variable displacement transducers (LVDTs).
Since it was not possible to actually ex- cavate soil in the centrifuge during flight, the soil in the shaft was substituted with a fluid that could be removed in stages to model stress relief due to soil excavation. A Z
nCl
2solution of density 1.55g/cm
3and a parafin with a density of 0.765g/cm
3were used to simulate two cases with different vertical stresses at the shaft bottom and horizontal stresses at the shaft wall.
The tests were performed with dry, fine sand. Triaxial compression tests on the sand indicate a hyperbolic stress-strain curve that depends on the confining pressure level. The earth pressure distribution calculated with Berezantzev's formula is shown for comparison.
These pressures were calculated by Lade et al.
(1981) from radial strains measured in this wall. For the three tests, the initial horizontal earth pressure in the near of the shaft was slightly higher than the earth pressure at rest of K
0=1-sinφ. As the simulation of the excavation proceeded, the flexible wall moved inward and the formulation pressures on the shaft wall increased with depth in all three cases. The observed earth pressures in the flexible wall exceed the ones predicted at greater depth (z/R>3~5). It is evident from the measured pressure distribution that yielding and some arching developed around the shaft. The radial stresses decreased in response to the radial movement permitted during shaft excavation and the tangential stresses increased in the near of the elastic-plastic interface.
However, Lade et al. did not measure the active earth pressure of the minimum pressure with wall displacements. He also measured the radial stresses in equilibrium states between ground stresses and wall resistant stresses depending on wall stiffness when the shaft was excavated. That is the reason why earth pressures in the bottom of the shaft are the maximum values.
4. Development of model test apparatus
A new model test apparatus was developed in
order to make up for the weak points of
Berlin and Cambridge model tests as previously
described. A centrifugal model test apparatus
was not utilized because the model wall was
made in 75cm heights and an earth pressure can
be measured.
Send raining controller
Linear slide guide
Model sylindrical
wall Front wall
Constant displacement controller
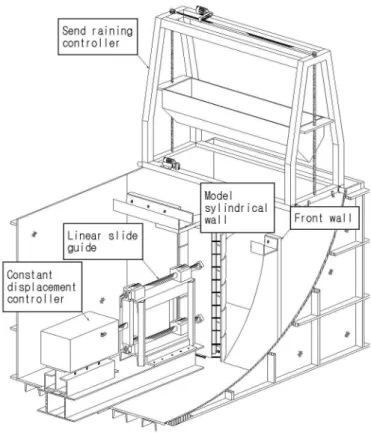
Fig. 2. Model test apparatus
4.1 Test container and sand raining controller
The test container with dimensions of 70cm length, 100cm width, and 75cm height was fabricated as shown in Fig. 2. Glass plates were adhered to the inside of the test container for the purpose of minimizing the effect of friction on the boundary wall. A sand raining controller was made of 10mm thickness of steel plates to rain fine sands using sand curtain methods. It is moved automatically back, forth, up and down by electric motors and sensors.
4.2 Cylindrical model wall of a shaft
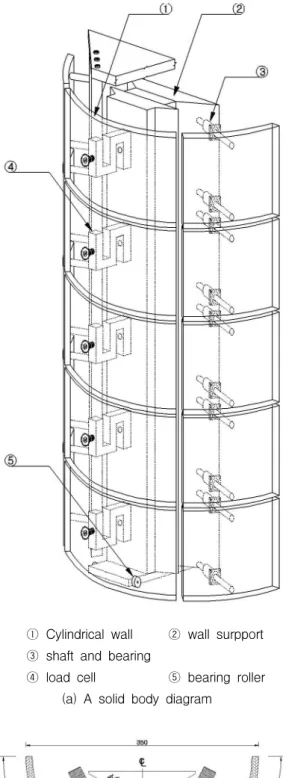
A model wall was composed of the model shaft wall of cutting scale down a real shaft and the wall support inducing the horizontal displacement as shown in Fig. 3. The shaft wall was made of 10mm thickness of acryl pipe with the wall shape ratios of 4.286, 5.000, and 6.522. It was sawn vertically into five segments to estimate the earth pressure with depth, and horizontal into three segments with an angle of 60° to induce the constant radial displacement of wall as shown in Fig. 3(b). The left and right segments of model wall were fixed in rods guided by ball bearings so that they can slide horizontally and smoothly. Load cells to measure the earth pressures were installed in central acryl plates. The wall support was composed of a front plate with load cells and a rear plate connected with linear movement guides. It was made of rigid bakelite plates of 30mm thickness to prevent from being deformed by the earth pressure(Wong et al, 1988)
The ball bearing rollers were fixed in the
bottom of wall support to be moved as smooth as possible. The corner of the wall support was milled with an angle of 60° to transfer a horizontal displacement into an axisymmetric displacement. The friction angles between sand and sand paper were measured, and sand paper with the friction angle of 0゚, 28.8゚ and 36.5゚ was attached to model wall in order to simulate wall friction.
An active wall displacement was induced by
a linear movement guide and a constant
displacement controller so that the earth
pressure on the wall was measured. Load
cells for measuring the earth pressure and
LVDTs for the wall displacement were
employed. A data logger was used to collect
data. The measured data were saved in the
portable computer at constant time interval.
① Cylindrical wall ② wall surpport
③ shaft and bearing
④ load cell ⑤ bearing roller (a) A solid body diagram
(b) R=17.5 cm Fig. 3. Cylindrical model wall
4.3 Verification of model test apparatus
Developed model test apparatus was verified whether it could measure correctly the pressure on a shaft wall. Hydrostatic pressure was measured for verification. Load cells were calibrated before the model wall was installed in test container. For the purpose of preventing a leakage of water, a vinyl envelope was installed in the test container, and water was filled up. A vinyl envelope was adhered closely to the wall for acting uniform water pressure on it. The measured hydrostatic pressure was in good agreement with that calculated.
5. Results of model test
The purpose of this study is an examination of earth pressure and the shape of failure surface with various wall friction angles and shape ratios of the shaft. The model tests were performed on the wall shape ratios of 4.286, 5.000 and 6.522 and the wall friction angles of 0゚, 28.8゚ and 36.5゚ as shown in Table 1.
Table 1. Model test conditions
Test No. Model dimensions Wall friction (°) H(cm) R(cm) H/R
T-L1 T-L2 T-L3
75.0 75.0 75.0
17.5 17.5 17.5
4.286 4.286 4.286
0.0 28.8 36.5 T-M1
T-M2 T-M3
75.0 75.0 75.0
15.0 15.0 15.0
5.000 5.000 5.000
0.0 28.8 36.5 T-S1
T-S2 T-S3
75.0 75.0 75.0
11.5 11.5 11.5
6.522 6.522 6.522
0.0 28.8 36.5
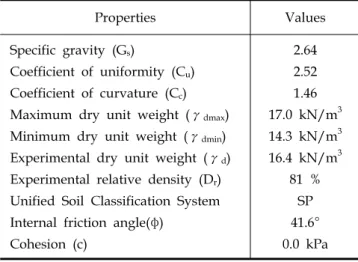
Table 2. Soil properties
Properties Values
Specific gravity (Gs)
Coefficient of uniformity (Cu) Coefficient of curvature (Cc) Maximum dry unit weight (γdmax) Minimum dry unit weight (γdmin) Experimental dry unit weight (γd) Experimental relative density (Dr) Unified Soil Classification System Internal friction angle(φ)
Cohesion (c)
2.64 2.52 1.46 17.0 kN/m3 14.3 kN/m3 16.4 kN/m3
81 % SP 41.6°
0.0 kPa
Sand gathered in downstream of the Han River was dried out to the sun. Physical characteristics of sand used in model tests are shown in Table 2. A grain size of sand was ranged from 0.08 to 2.0mm. A percent passing by weight of fine sand filled in test container smaller than 1.0mm diameter was more than 80%, and the sand was classified into SP in the Unified Soil Classification System. Sand was rained by sand curtain methods, and a falling height was 1.0m. Aluminium cans of two per a layer with depth were laid on five layers to examine whether relative densities were uniform.
Pressure variation with wall displacements, effects of wall friction and wall shape ratios were examined for the earth pressure distribution on model shaft wall. By comparison with pressure calculated by theory for plane strain condition, the effects of reducing earth pressure due to horizontal arching with shape ratios of the shaft wall were described. The effects of shaft wall heights and radii were analyzed on the shape of failure surface examined through the model tests.
5.1 Earth pressure on the cylindrical retaining wall
0 20 40 60 80 100
0 1 2 3 4 5 6 7 8
W a ll dis pla c e me n t (mm)
Earth pressure (N)
LC-1 (z=7.8cm) LC-2 (z=22.8cm) LC-3 (z=37.8cm) LC-4 (z=52.8cm) LC-5 (z=67.8cm)
Fig. 4. Variation of earth pressure with wall displacement(H/R=4.286, δ=0°)
Earth pressure distributions measured by load cells(LC) with depth are shown in Fig. 4 when active displacements of the shaft wall of shape ratio H/R=4.286, wall friction angle δ=0° were allowed. The maximum pressure was developed in at-rest state when no displacement was allowed. The pressure decreased rapidly if small displacements were allowed to occur and it reaches a minimum at the walldisplacements of about 1.5% of shaft radius. When further
0
15
30
45
60
75
0.0 1.0 2.0 3.0 4.0
pi (kPa)
z (cm)
(H/R=4 .2 8 6, δ h= 0.00 mm) (H/R=4 .2 8 6, δ h= 0.03 mm) (H/R=4 .2 8 6, δ h= 0.13 mm) (H/R=4 .2 8 6, δ h= 0.43 mm) (H/R=4 .2 8 6, δ h= 1.87 mm) Ko-Lin e
Ka -Lin e(Coulomb)
Ko-Lin e
Ka-Lin e
Fig. 5. Variation of earth pressure distribution with wall displacement (H/R=4.286, δ=0˚)
displacements were allowed, the earth pressure increased slightly again. This tendency was probably induced by ground yielding behind the shaft wall. Hence, the pressure at the displacement of about 1.5% of shaft radius can be regarded as an active earth pressure of the minimum one.
Earth pressure distribution with depth is shown in Fig. 5, when wall displacements in shape ratio H/R=4.286 and wall friction angle δ
=0° were allowed. When the shaft wall displacements were not allowed, the pressure was approximately the same as at-rest earth pressure. The pressure decreased as the wall displacements were further allowed. The earth pressure resulted in the minimum pressure at 1.87mm displacements. The deeper the depth is, the larger earth pressures are in initial state.
However, when wall displacements were allowed, earth pressures at deep locations decreased much relatively due to arching effects. Earth pressure in the lower parts of the wall was decreased with depth in active states.
Earth pressure distributions with shape ratios and wall frictions are shown in Fig. 6.
The smaller the shape ratio is, that is, the larger the wall radius is, the more earth pressures increase, because the wall shape ratios of shaft wall approach to plane strain condition. Another reason is that effects of earth pressure reduction due to horizontal arching(increase of tangential stress) become small. The maximum pressure developed in the midpoint of the shaft wall with smooth wall.
However, the earth pressure decreased slightly when the wall friction angle was greater than zero because the wall friction
resisted the downward movement of sliding soil mass.
In addition, it is clear that the longer the wall friction is, the larger the maximum pressure is. Maybe, the wall friction resisting downward sliding of soil mass due to gravity induces the vertical arching. The weight of sliding soil mass is probably transferred to the upper part of the shaft wall. Accordingly, the earth pressure increases in the upper part of the shaft wall and decreases in the lower part of that.
0
15
30
45
60
75
0.0 0.2 0.4 0.6 0.8
pi (kPa)
z (cm)
Measur ed(H/R=4.286,δ=0°) Measur ed(H/R=4.286,δ=28.8°) Measur ed(H/R=4.286,δ=36.5°) Coulomb-2D (δ=0°)
(a) H/R=4.286
0
15
30
45
60
75
0.0 0.2 0.4 0. 6 0. 8
pi (kPa)
z (cm)
Measured(H/R=5.000,δ=0°) Measured(H/R=5.000,δ=28.8°) Measured(H/R=5.000,δ=36.5°) Coulomb-2D (δ=0°)
(b) H/R=5.000
0
15
30
45
60
75
0.0 0.2 0.4 0.6 0.8
pi (kPa)
z (cm)
Measured(H/R=6.522,δ=0°) Measured(H/R=6.522,δ=28.8°) Measured(H/R=6.522,δ=36.5°) Coulomb-2D (δ=0°)
(c) H/R=6.522
Fig. 6. Measured earth pressure istributions with wall shape ratios and wall frictions
5.2 Shape of failure surface in ground behind a shaft
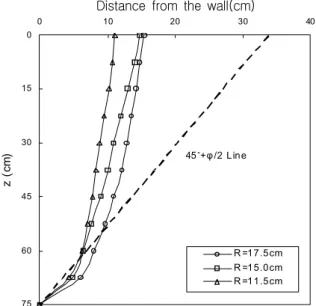
Shapes of failure surface in ground behind a shaft wall examined by model tests are shown in Fig. 7.
It shows the results of model tests in radii of 17.5, 15.0, and 11.5cm with a wall height of 75.0cm. The smaller the radius of shaft wall and the shape ratio of that are, the smaller the
0
15
30
45
60
75
0 10 20 30 40
Distanc e f rom the w all ( c m)
z (cm)
R =17.5cm R =15.0cm R =11.5cm 45˚+φ /2 Line
Distance from the wall(cm)
Fig. 7. Effect of wall radiuses on the shape of failure surfaces
distance of failure surface from the wall is. It is approximately equal to the radius of shaft wall. Since the shape of failure surface is a curved shape, the volume of sliding soil mass is less than that with failure surface slope of 45° + φ /2.
However, it is clear that the lower the wall height is and the smaller the shape ratio of the shaft is, the smaller the difference of volume of sliding soil mass due to the different shapes of failure surfaces is. The reason is probably that a big shape ratio of the shaft is close to a plane strain condition.
6. Conclusions
Model tests were performed to examine the active earth pressure distribution on a cylindrical shaft wall and the shape of failure surface of ground behind a shaft, when uniform displacements of a shaft in dry cohesionless soils were induced. The effects of some influence factors on earth pressure on a cylindrical retaining wall were investigated.
The following conclusions are made on the basis of the work presented herein.
(1) The earth pressure decreased rapidly if small displacements were allowed to occur, and result in a minimum at the 1.5% wall displacements of shaft radius.
(2) The smaller the shape ratio was and
the larger the wall radius was, the
more earth pressures was because the
shape ratios of shaft wall were small in
approximate plane strain condition.
(3) The maximum pressure developed in the midpoint of the shaft wall with smooth surface. However, that earth pressure decreased slightly when the wall friction angle was greater than zero because the wall friction resisted the downward movement of sliding soil mass.
(4) The smaller the radius of shaft wall was and the larger the shape ratio of that was, the shorter the more a distance of failure surface from the wall was. It was approximately equal to the radius of shaft wall.
(접수일 : 2005. 11. 9 심사일 : 2005. 11. 29 심사완료일 : 2006. 1. 2)
REFERENCES
1. Britto, A. M. and Kusakabe, O.(1984), On the Stability of Supported Excavations, Can. Geotechnical Journal, Vol. 2, No. 1, pp. 1~15.
2. Fara, H. D. and Wright, F. D.(1963), Plastic and Elastic Stresses Around a Circular Shaft in a Hydrostatic Stress Field, Society of Mining Engineers, pp. 319~320.
3. Lade, P. V., Jessberger, H. L., Makowski, E. and Jorden, P.(1981.), Modelling of Deep Shaft in Centrifuge Tests, Proceedings 10th International Conference on Soil Mechanics and Foundation Engineering, Vol. 1, pp. 683~691.
4. Müller-Kirchenbauer, H. B., Walz, U. H. and Klapperich(1980), Experimentelle und Theoretische Untersuchungen zum Erddruckproblem auf Radial Symmetrische Senkkästen und Schächte, Veröff. des Grundbauinstitutes der TU., Berlin, H.7, p.113.
5. Wong, R. C. K. and Kaiser, P. K.(1988), Behavior of Vertical Shafts : Reevaluation of Model Test Results and Evaluation of Field Measurements, Can. Geotech. J., Vol. 25, No. 2, pp. 338~352.