Introduction
There are four main causes of wilting: cultivation methods, soil environment, biological environment, and climate (Agro-Environment, 2004).
Wilting due to cultivation methods from difference in the absorptive power between the scion and the rootstock, very rapid cultivation, planting of seedlings with low root vitality, continuous cropping, annual dressing with the same fertilizer, overirrigation, and damage by pesticides herbicides, and others.
The climatic causes of wilting include extended periods of insufficient sunlight, a constant low temperature during seedling stage, high daily temperature, improperly ventilated or airtight environments, high rainfall, high humidity, extremes of high or low temperature, and extended periods of fog.
Among the soil characteristics that cause wilting are high ground water level, high humidity, clayey and sand soils, artificial soil, soil nematodes, salt accumulation, and unbalanced nutritional elements.
The biological causes of wilting include viruses,
phytophthora blight, root rotting disease, soil, and parasitic nematodes, allelopathy, and others.
An increase in the application of nitrogen fertilizers has been shown to decrease the ascorbic acid (AsA) content in many plants. Other reports indicate however that nitrogen fertilizer may not affect the AsA content in some plants (Maozafar, 1993).
In lettuce roots, nitrogen absorption was inhibited by an increase in potassium concentration in the nutrient solution. Nitrate accumulation depended on the absorption of nitrogen because the nitrate content was 45 times higher in lettuce plants cultured in the absence of potassium (0K level) than thosecultured with twice the amount of K (2K level). The AsA concentration alsodecreased with increasing nitrogen absorption, since the AsA content at 2K level was higher than that at 0K level in bothand young leaves (Park et al., 2006b)
This study was conducted to confirm whether or not unbalanced nutrients and high nitrogen, can induce wilting in spinach and to compare nitrogen assimilation between healthy and wilted plants.
Materials and Methods
Plant Spinach seeds (Spinacia oleracea L. cv. Kibin)
Received : June 25. 2009 Accepted : July 30. 2009*Corresponding author: Phone : +8201075035557, E-mail : [email protected]
Changes in the Nitrate Assimilation and Ascorbic Acid Content of Spinach Plants Treatmented with Nutrient Solutions Containing
High Nitrogen and Low Potassium
Yang-Ho Park,
*and Beom-Seok Seo
Korea Greenhouse Crop Research Institute, Gaedong 542-5, SooBuk, Damyang, Jeonnam, Korea
This study was conducted to determine the physiological differences betweenhealthy and wilted plants with respect to nitrate assimilation and ascorbic acid content. Wilting was artificially induced in spinach plants by treating the seeds with nutrient solution containing high nitrogen and low potassium. The plants were cultured in different plots 4 types of media: 1N-1P-1K (control), 6N-1P-0K (0K), 6N-1P-0.5K (0.5K), and 6N-1P-2K (2K). The rate of wilting among the plants was as follows: control, 0%; 2K, 10%; 0.5K, 40%;
and 0K, 70%. This shows that under high nitrogen conditions, the lower the amount of potassium provided, higher was the rate of wilting. There were no differences in plant growth among the plants treated with different levels of potassium under high nitrogen conditions.The nitrate content in both the leaves and the roots was higher in plants grown under high nitrogen media than those in the control.
Furthermore, the nitrate level decreased with increasing potassium concentration. The ascorbic acid content of spinach under high nitrogen conditions was lower than those of the control.
Key words: Spinach, Wilt, Nitrate, Ascorbic acid
were purchased from Nong-U-Bio. Spinach seeds were grown in pots (10 cm [D] × 10 cm [H]) filled with vermiculites and perlite (1:1). The pots were placed in an environmental growth chamber with 300 mL of nutrient solution supplied every 23 days under 8 h light/16 h dark cycle. The intensity of the incident light was maintained at 500 μ E/m
2·s
-1and the growth temperature was 20 ℃ day/night. The RH in the chamber was 65% ± 2%. The general nutrient solution contained the following macronutrients (mM): Ca(NO
3)
2·4H
2O, 4.0 KNO
3, 4.0;
NH
4H
2PO
4, 1.0 NH
4Cl, 1.5; NH
4Cl, 1.5; KCl, 2.5 K
2SO4, 1.0, and MgSO
4·7H
2O, 3.5. The following micronutrients were also added ( μ M): H
3BO
3, 20.6; CuSO
4·5H
2O, 0.16;
MnSO
4·2H
2O, 4.5; ZnSO
4·7H
2O, 0.34; and Fe-chelate, 107.4 (Robinson, 1984). After 10 days, unbalanced nutrient solutions were provided. The unbalanced nutrient solutions were 6N-0K-1P, 6N-0.5K-1P, and 6N- 2K-1P. The 6N-0K-1P medium contained the following macronutrients (mM): Ca(NO
3)
2· 4H
2O, 36.0 NH
4H
2PO
4, 6.0 NH
4Cl, 21.0 KCl, 0.0 K
2SO
4, 0.0; and MgSO
4·7H
2O, 3.5; The 6N-0.5K-1P medium contained the following macronutrients (mM): Ca(NO
3)
2·4H
2O, 36.0 NH
4H
2PO
4, 6.0 NH
4Cl, 21.0 KCl, 2.5 K
2SO
4, 1.5;
and MgSO
4·7H
2O, 3.5 The 6N-2K-1P medium contained the following macronutrients (mM):
Ca(NO
3)
2·4H
2O, 36.0 NH
4H
2PO
4, 6.0 NH
4Cl, 21.0 KCl, 12.0 K
2SO
4, 3.0; and MgSO
4·7H
2O, 3.5. The micronutrient composition for the three solutions was the same as of the general that nutrient solution. The growth rate of the plants was evaluated using the following parameters: leaf length, leaf width, and number of leaves.
Plant samples were divided into leaves and roots for analysis.
Measurement of nitrate content Plant samples were homogenized under liquid nitrogen and were preserved until analysis at -80 ℃ . Homogenized samples (0.5 g) were weighed and extracted in 5 mL of deionized H
2O for 1 h on a shaker (140 rpm) and then filtered through No. 2 filter paper. Nitrate was measured by the CFA method (Auto Analyzer 3: BRAN+LUEBBE) (Park et al., 2006a) (Scholl et al., 1974).
Measurement of nitrite content The method employed by Scholl et al. (1974) was used for nitrite measurement in the plants. The plant samples were first homogenized in liquid nitrogen; 0.5 g of the homogenized powder sample was transferred to 5 mL of
cold MilliQ water and placed in a shaker at 140 rpm for 1 h. The sample solution was then filtered through a No. 2 filter paper. A 0.1mL sample of the filtrate was mixed with 0.5 mL of 2% (w/v) sulfanilamide (in 3N HCl) and 0.5 mL of 0.1% (w/v) N-(1-naphthyl)ethylenediamine and allowed to react for more than 20 min. The nitrite content was measured by a HITACHI U-2000 spectrophotometer at 540 nm.
Measurement of nitrate and nitrite reductase activity For the nitrate reductase (NR) assay, fresh spinach leaves and roots were homogenized with mortar and pestle in liquid nitrogen; the homogenate was dissolved in 100 mM P-K buffer (pH 7.5) containing 6 mM l-cysteine and 5 mM EDTA and centrifuged at 10,000 × gfor 20 min at 4 ℃ . The NR activity (nitrate-to- nitrite reduction) was determinedby measuring the production of nitrite from nitrate with addition of NADH as the electron donor. The crude enzyme extract was incubated in an incubation medium containing 50 mM P- K buffer (pH 7.5), 10 mM NO
3-, and 2 mM NADH (added just before incubation) for 30 min in a water bath maintained at 30 ℃ with gentle shaking (140 rpm).The nitrite formed in the reaction solution was then measured.
For the nitrate reductase (NiR) assay, spinach leaves and roots were homogenized with mortar and pestle in liquid nitrogen; the homogenate was dissolved in 100 mM P-K buffer (pH 7.5) containing 1 mM l-cysteine and 1 mM EDTA and centrifuged at 10,000 × g at 4 ℃ . The NiR activity in the crude enzyme extract was assayed by the reduction (disappearance) of added nitrite. The incubation medium contained 50 mM P-K buffer or Tris- HCl buffer, 0.1 mM NO
2-, and crude enzyme extract with 1 mM methyl viologen (MV) reduced with 6 mM sodium dithionite (SD) in 10 mM NaHCO
3. The nitrite in the reaction solution was then measured.
Measurement of AsA content The AsA and
dehydroascorbic acid (DHA) contents were measured
using the hydrazine method (Park et al., 2006b). One gram
of plant powder (homogenized in liquid nitrogen) was
added to 10 mL of 5% (w/v) metaphosphoric acid, and the
mixture placed in a shaker at 140 rpm for 1 h and
thenpassed through a No. 6 filter paper. In order to
determine the DHA and DHA plus AsA contents (the
latter was oxidized with 2,6-dichlorophenolindophenol
solution), 2% (w/v) thiourea was added to 1 mL of the
extract, and the solution was placed in a water bath at 37 ℃
for 3 h. The solution was subsequently moved to ice water.
After the addition of 2.5 mL of 85% (w/v) H
2SO
4and 0.5 mL of 2% (w/v) 2,4-dinitrophenylhydrazine (in 9N H
2SO
4). The extract was then keptat room temperature for 30 min, and the absorption at 520 nm was measured using a HITACHI U-2000 spectrophotometer. The difference between the DHA plus AsA amount and the DHA amount provided the AsA amount.
Measurement of the mineral content The inorganic components were measured using the Walinga method (Walinga et al., 1989). Plants were digested as follows:
0.3 g of leaf powder (homogenized dried plant) was added to 3.3 mL of 368 mM in 84.7% H
2SO
4, and the solution was left overnight. This was then digested at 100ŸVC for 1 h and then at 300 ℃ for 2-3 h until the solution became colorless (2 mL H
2O
2was added every 20 min). The solution was allowed to cool with H
2O
2and then redigested.The nitrogen and phosphorus contents in the digested solutions were determined by colorimetry, and the K, Ca, Mg, Na, Fe, Cu, Mn, and Zn contents were determined by inductively coupled plasma (ICP) spectroscopy (Integra XL Dual, GBC Scientific Equipment).
Results and Discussion
Rate of wilting The rate of wilting of plants changed according to the potassium levels. Wilting was not observed when the normal nutrient solution was used.
The highest wiltingrate was observed with the 0K medium, which contained high nitrogen butno potassium.
The wilting rate was inversely proportional to the potassium concentration (Table 1).
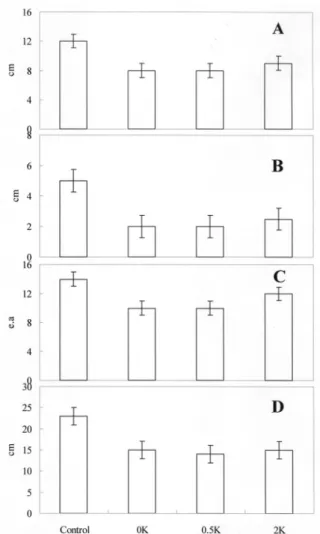
Growth rate The plant growth wasinhibited under high nitrogen conditions, i.e., when the provided nitrogen content was 6 times higher than that in the normal nutrient solution. However, the growth rate, which was deduced from leaf length, leaf width, leaf number, and root length, did not change when the potassium content was altered (Figs 1 and 2).
Treatments Control 0K 0.5K 2K
0 70±7 40±5 10±3 Percentage of wilted plant
Table 1. Percentage of wilted plant as affected by different potassium levels. Control contains normal nutrient solution, 1 N-1 P-1 K. 0 K has 6 N-1 P-0 K that nitrogen being 6 times higher than that in normal nutrient solution and potassium concentration is 0. 0.5 K has 6 N-1 P-0.5 K with nitrogen has 6 times higher than that in normal nutrient solution and potassium concentration is half of that in normal nutrient solution. 2 K has 6 N-1 P-2 K with nitrogen being6 times higher than that in the normal nutrient solution and potassium concentration is 2 times higher than that in the normal nutrient solution.
Fig. 2. Root growth as influenced by different potassium levels.
Fig. 1. Changes in the growth rate as influenced by different levels of potassium content. A is leaf length, B is leaf width, C is leaf number, and D is root length.
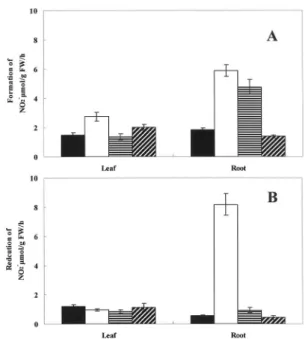
Nitrate and nitrite contents The nitrate content in both roots and leaves was remarkably increased under high nitrogen conditions. Moreover, the nitrate content was decreased by increasing the potassium levels (Fig 3 A). The patterns of the nitrite content were the same as those of nitrate contents. In addition, the nitrite content of the root was observed to increase remarkably in plants provided with the 0K nutrient solution.
NR and NiR activity The NR activity of plants
cultured using the high nitrogen nutrient solutions was higher than that of plants cultured using the normal nutrient solution. Moreover, the NR activity increased with decreasing the potassium levels. This pattern was more remarkably seen in roots than in leaves (Fig 4 A).
TheNiR activity of the leaves did not differ with the various nutrient conditions. However, the NiR activity of the roots was remarkably increased in the highly wilted plantscultured with the 6N-1P-0K medium (Fig 4 B).
AsA content AsA was mostly in the reduced form in both the leaves and the roots (Fig 5 B). With the exception of those grown in 6N-2K solution, the AsA content in both the leaves and the roots was lower in plants cultured in high nitrogen nutrient solutions, than in plants cultured using thenormal nutrient solution.
Furthermore, the AsA content increased with increasing potassium levels, under high nitrogen conditions (Fig 5).
Nitrogen, phosphorus, and potassium contents The nitrogen content of plants cultured in high nitrogen nutrient solutions was higher than that of plants cultured using the normal nutrient solution. Moreover, the nitrogen content in both the leaves and the roots
Fig. 3. Changes in nitrate content (A) and nitrite content (B) in spinach leaf and root.
Fig. 4. Changes in nitrate reductase activity (A) and nitrite reductase activity (B) as affected by different K levels in spinach leaf and root.
Fig. 5. Differences in ascorbic acid content as influenced by different K levels in spinach. Total ascorbate is A, ascorbate(reduced form) is B, and dehydroascorbate(oxidized form) is C.
increased with decreasing the potassium levels under high nitrogen conditions. There was no difference in the phosphorus contents among the plants in the different plots. The potassium content of plants cultured using the 2K medium was higher than that of plants cultured using the 0K or the 0.5K medium (Table 2). The K/N ratio in the leaves and roots was 2-3 times higher in the plants cultured in the 2K medium than in those cultured using the 0K medium (Fig 6).
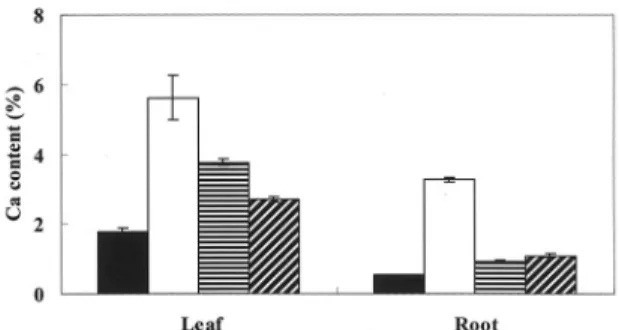
Mineral content TheMg, Na, Fe, Cu, Mn, and Zn contents were not altered by changing the potassium concentration (Table 3). However, the Ca content was higher in plants cultured using the 0K medium than in
plants cultured using the 2K or the 0.5K medium (Fig 7).
All conditions being equal, the nitrate concentrations in plants can be expected to bear some relationship with the availability of nitrate in the root and the amount of nitrogen fertilizer applied. A directly proportional relationship was reported between the nitrate concentration in the lettuce head leaves and the amount of nitrogen fertilizer applied within a given planting data and nitrogen. This report stated that the nitrate content increased with increased the nitrogen application (Maynard et al., 1976). The results of our study corronborated this (Fig 3 A), i.e., we found that the nitrate concentrationincreased by increasing the nitrogen content in the nutrient solution. We provided the same amount of
Fig.6 Difference in K/N ratio as influenced by different Klevels in spinach.
Leaf
Root
Potassium Phosphorus(%)
Nitrogen
Control 4.63±0.11 1.19±0.05 8.44±0.83
0K 6.10±0.26 0.83±0.02 3.29±0.28
0.5K 5.27±0.17 0.84±0.05 4.93±0.10
2K 5.02±0.28 0.93±0.03 7.76±0.30
Control 3.23±0.20 1.47±0.02 4.45±0.04
0K 3.50±0.09 0.95±0.00 1.54±0.06
0.5K 3.17±0.03 1.39±0.00 4.06±0.07
2K 3.50±0.23 1.03±0.03 5.05±0.04
Table 2. Difference of nitrogen, phosphorus and potassium contents as influenced by different K levels in spinach.
Leaf
Root
Zn Mn
Cu Fe
Na Mg
Mg
--- % ---
Control 1.03±0.04 0.81±0.03 151±10 8±0.1 1044±100 44±1
0K 0.82±0.03 1.05±0.11 323±40 11±1.0 1442±71 100±14
0.5K 0.63±0.02 0.84±0.02 50±5 8±1.0 1606±104 108±3
2K 0.58±0.01 1.15±0.02 87±20 11±0.8 1641±75 74±1
Control 0.63±0.00 0.31±0.00 776±9 57±1.1 1074±3 32±1
0K 0.57±0.01 0.48±0.01 1339±8 59±1.6 1645±13 123±3
0.5K 0.73±0.01 0.32±0.00 719±6 95±3.2 795±1 117±1
2K 0.94±0.01 0.44±0.01 1132±7 52±2.7 1044±4 109±2
--- mg kg-1--- Table 3. Changes in mineral element contents as influenced by different K levels in spinach.
Fig.7. Difference in Ca content as influenced by different K levels in spinach.
nitrogen but the amount of absorbed nitrogen was different (Table 2). This finding can be explained on the basis of a previous report (Cushnaha et al., 1995), which states that under low potassium conditions, the increase in nitrogen uptake from Na application is due to the K- sparing effect of Na: Na
+replaced K
+in the vacuoles of root cells. This frees the latter ion (K
+) and enables it to play its vital role as the co-transporter cation for nitrate translocation to shoot tissue. They considered that in the absence of Na
+, K
+would have been insufficient to drive the nitrate transport mechanism, and hence, the nitrate would have accumulated in the roots, thus hindering further nitrogen uptake by feedback regulation.
A previous study showed that nitrogen content does not influence AsA concentration however, it is currently believed that heavy use of nitrogen fertilizers along with a decrease in the plant AsA content may increase the nitrate concentration in the edible parts of the plants (Lorenz and Weir, 1974). Thus, the low AsA content in plants cultured in 0K medium can be explained on the basis of the above statement.
This study has therefore demonstrated that potassium prevents nitrogen absorption, thataddition of nitrogen increases the nitrate content in plants, and that the AsA content in plants can be decreased by increasing the nitrogen content.
References
Agro-Environment, R. 2004. Agro-Environment Research.
Department of Agro-Environment, National Institute of Agricultural Science and Technology.
Cushnaha, A., j.S. Bailey, and F.J. Gordon. 1995. Some effects of sodium application on the yield and chemical composition of pasture grass under differing conditions of potassium and moisture supply. Plant and Soil 176:117-127.
Lorenz, O.A., and B.L. Weir. 1974. Nitrate accumulation in vegetables. Environmental Quality and Food Supply:93-103.
Maozafar, A. 1993. Nitrogen fertilizers and the amount of vitamins in plants : A review. Journal of Plant Nutrition 16 (12):2479-2506.
Maynard, D.N., A.V. Barker, P.L. Minotti, and N.H. Peck. 1976.
Nitrate accumulation in vegetables. Advances in Agronomy 28:71- 118.
Park, Y.H., S.H. Park, and J.H. Park. 2006a. Continuous-Flow analysis for determination of nitrate in plant by using hydrazine- copper method. Korean Journal of Soil Science and Fertilizer 39 (4):204-208.
Park, Y.H., S.H. Park, J.H. Park, J.Y. Lee, B.C. Jang, and K.S. Lee.
2006b. Changes of ascorbic acid and nitrate content in lettuce by unbalanced nutrient solution. The Korea Society of Crop Science 51 (1):107-111.
Robinson, J.M. 1984. Photosynthetic carbon metabolism in leaves and isolated chloroplasts from spinach plants grown under short and intermediate photosynthetic periods. Plant Physiology 75:397- 409.
Scholl, R.L., J.E. Harper, and R.H. Hageman. 1974. Improvements of the nitrite color development in assays of nitrate reductase by phenazine methasulfate and zinc acetate. Plant Physiology 53:825- 828.
Walinga, I., W.V. Vark, V.J.G. Houba, and J.J. Vand der lee. 1989.
Soil and Plant Analysis. Wageningen Agricultural University, Wagenningen, the Netherlands:264.
이 연구의 목적은 건강한 작물과 시들은 식물의 질소대사와 아스코리빈산 함량의 차이를 비교하는것에 있다.
시듬은 인공적으로 유도되었으며, 그방은 질소과다 시비 및 저칼륨 시비에 의한 것으로4개의 처리구를 두었다.
1N-1P-1K (control), 6N-1P-0K (0K), 6N-1P-0.5K (0.5K), and 6N-1P-2K (2K). 시듬 정도는 control, 0%;
2K, 10%; 0.5K, 40%; and 0K, 70%. 식물 생장에는 고질소 저 칼륨 처리구에서는 그리 큰 차이가 없었으며 질산태질소의 함량은 control 구와 비교하여 고 질소 처리구가 높았으며, 아스코리빈 산 함량은 고질소 처리구 가 control구에 비하여 낮았음을 확인 할수 있었다.
고질소 및 저 칼륨 양액처리시 시금치내의 비타민C및 질소 대사의 변화
박양호*·서범석