830
Copyright © 2016 The Korean Society of Fisheries and Aquatic Science pISSN:0374-8111, eISSN:2287-8815
서 론
해산어류에게염분은가장중요한환경요인중하나이며
,
염 분의변화는어류체내의다양한영향을일으킬수있다.
해산어 류에게낮은염분은이온과수분평형에혼란을일으키고,
삼투 조절에영향을미쳐어류의생리적변화로인한스트레스를초 래한다(Kim et al., 2004).
그리고염분은어류의부력에영향 을미치는요인으로어류의난의수직운동에도영향을미친다(Sclafani et al., 1993).
또한염분농도는염분에따른중금속은(Ag)
의형태를전환시킴으로써생체이용률에영향을주어은(Ag)
의생물축적에도밀접한관계를가진다(Webb and Wood,
2000).
염분에대한내성은어종마다차이가다양하게나타나는데
,
초기성장기에많은영향을받는다(Panfill et al., 2006).
어류의염분변화에따른노출시광염성어류
,
혐염성어류에 따라차이는있지만,
일반적으로성장지연및생리적으로부정적영향을미치는스트레스요인으로작용한다
(Partridge and
Jenkins, 2002).
어류의혈액학적성상은외부환경적변화에따른대사작용 및건강상태를확인하기위한지표로많이사용되고있다
(Kim and Kang, 2014).
그리고생태및생리학적반응으로적혈구세염분농도에 따른 치어기 은대구(Anoplopoma fimbria)의 혈액학적 성상, 혈장성분 및 항산화반응의 변화
김준환·박희주·황인기·김도형·오철웅
1·이정식
2·강주찬*
부경대학교 수산생명의학과, 1부경대학교 자원생물학과, 2전남대학교 수산생명의학과
Alterations of Hematological Parameters, Plasma Constituents and An- tioxidant Responses in the Sablefish Anoplopoma fimbria Depending on
Salinity
Jun-Hwan Kim, Hee-Ju Park, In-Ki Hwang, Do-Hyung Kim, Chul Woong Oh
1
, Jung sick Lee2
and Ju-Chan Kang*Department of Aquatic Life Medicine, Pukyong National University, Busan 48513, Korea
1
Department of Marine Biology, Pukyong National University, Busan 48513, Korea
2
Department of Aqualife Medicine, Chonnam National University, Yeosu 59626, Korea
Juvenile Anoplopoma fimbria (mean length 15.6±1.4 cm, mean weight 68.7±4.3 g) were exposed to 4 months with the different levels of salinity [100 (35.0), 90 (31.5), 80 (28.0), 70 (24.5), 60 (21.0), 50 (17.5), and 40 (14.0) % (psu)]
for 4 months. Hematological parameters such as red blood cell (RBC) counts, hematocrit (Ht), and hemoglobin (Hb) concentrations were substantially decreased under salinities of 50% psu or lower. Of the measured inorganic plasma constituents, magnesium was notably decreased, whereas there was no effect on calcium. Among organic plasma components, glucose and cholesterol were significantly increased, and total protein was decreased. Among enzyme plasma components, glutamic oxalate transaminase (GOT), glutamic pyruvate transaminase (GPT), and alkaline phosphatase (ALP) were significantly increased under salinities of 50% psu or lower. Antioxidant responses such as glutathione S-transferase (GST) and glutathione (GSH) were significantly decreased at salinities of 50% psu or lower.
The results of this study indicate that salinity affects the blood parameters, plasma constituents, and antioxidant re- sponses of A. fimbria .
Key words: Anoplopoma fimbria , salinity, hematological parameters, plasma components
This is an Open Access article distributed under the terms of the Creative Commons Attribution Non-Commercial Licens (http://creativecommons.org/licenses/by-nc/3.0/) which permits unrestricted non-commercial use, distribution, and reproduction in any medium, provided the original work is properly cited.
http://dx.doi.org/10.5657/KFAS.2016.0830 Korean J Fish Aquat Sci 49(6) 830-837, December 2016
Received 19 August 2016; Revised 6 October 2016; Accepted 19 October 2016
*Corresponding author: Tel: +82. 51. 629. 5944 Fax: +82. 51. 629. 5938
E-mail address: [email protected]
염분농도가 은대구에 미치는 영향
831
포
,
호르몬, hematocrit, hemoglobin
농도,
백혈구수와같은다 양한혈액성분의변화가일어난다(Zarejabad et al., 2010).
혈액 내의혈장성분역시염분변화에따른어류의스트레스를평가하고건강상태를판단하는주요한지표로판단된다
(Arnason
et al., 2013).
하지만,
다른환경적요인에따른영향에비해염 분에대한연구는많이수행되어있지않다.
염분이해산어류에 미치는가장주요한환경요인중하나임을고려해보았을때,
염 분농도에따른영향에대한연구가필요할것으로판단된다.
어류에서염분의변화는생리적인스트레스를유발함으로써
,
활성산소를생성하게된다(Yin et al., 2011).
어류에서활성산 소생성에따른방어작용으로항산화반응을나타내게되는데, GST
는대표적인항산화반응중하나이다. GST
는이차해독효 소중대표적인항산화효소로작용을하며,
어류에서산화스트 레스에따른산화손상을평가하는지표로많이사용되고있다(Regoli and Principato, 1995). GSH
역시활성산소를물과산 소로전환시킴으로써항산화작용을하는대표적인물질중하 나이다(Kim and Kang, 2016a).
이러한항산화물질의중요성 을고려해보았을때, GST
활성과GSH
수준과같은항산화반응 은염분변화에따른항산화영향을평가하는좋은지표가될것 이다.
본실험에사용된은대구는미국및캐나다에서양식되고있 는고부가가치를지닌한해성어종으로
,
높은상품성을지니고 있는어종이다.
하지만,
우리나라에서는현재까지양식이이루 어지고있지않다.
따라서본실험의목적은은대구완전양식을 위한실험의일환으로,
치어기와성어기의생육환경이상이하 여다양한염분농도로이동하는생활사에서적정염분농도및 염분에대한내성을확인하기위해염분농도에따른성장,
혈액 성상및혈장성분의변화를확인하는데있다.
재료 및 방법
실험어 및 실험환경
본 실험에 사용한 실험어는 미국
Troutlodge
사에서 분양받은 은대구치어를실험어 크기
(
전장15.6±1.4 cm,
체중68.7±4.3 g)
로성장시킨뒤,
실험에사용할외관상건강한개체 를175
마리선별하였다.
실험중사육수온은해수냉각장치를이용하여
13±1°C
로일정하게유지하였다.
실험염분농도는해수
35 psu
를100%
로보고100 (35.0 psu), 90 (31.5 psu), 80 (28.0 psu), 70 (24.5 psu), 60 21.0 psu), 50 (17.5 psu), and 40 (14.0 psu)%
로염분농도구간을두어염분에따른변화를4
달 간실시하였으며, 2
달간격으로혈액학적변동을검토하였다. 혈액성상
실험어는혈액응고를방지하기위해헤파린을처리한
1
회용 주사기를사용하여미부정맥에서채취하였다.
채혈한혈액으 로RBC (Red Blood Cell) count, hemoglobin (Hb)
농도및hematocrit (Ht)
을즉시분석하였다. RBC count
는Hendrick`s diluting soluton
으로혈액을400
배희석후, hemo-cytometer (Improved Neubauer, Germany)
를이용하여광학현미경으로 계수후다시희석배수를곱하여계산하였다. Ht
는Ht
모세관 내로혈액을넣어, microhematocrit centrifuge(Model; 01501, HAWKSLEY AND SONS Ltd., England)
에서12,000 rpm, 5
분간원심분리후판독판(Micro-Haematocrit reader, HAWK- SLEY AND SONS Ltd., England)
으로측정하였다. Hb
농도 는임상용kit (Asan Pharm. Co., Ltd.)
를이용하여Cyan-met- hemoglobin
법(Azim et al., 2002)
으로540 nm
에서측정하였 다.
혈장분석을위해채취한혈액은
4°C, 3,000 g
로5
분간원심 분리하였다.
분리한혈장으로무기성분,
유기성분,
효소활성의 변화를분석하였다.
무기성분으로는칼슘(Calcium),
마그네슘(Magnesium)
을 측정하였다.
칼슘은OCPC
법(Connerty and Briggs, 1966)
에의해570 nm
에서,
마그네슘은Xylidyl blue- I
법(Kannan et al., 2015)
에의해515 nm
에서시판되고있는임 상용kit (Asan Pharm. Co., Ltd)
를이용하여측정하였다.
유기성분으로는 글루코즈
(Glucose),
콜레스테롤(Cholester- ol),
총단백질(Total protein)
을측정하였다.
글루코즈는GOD/
POD
법(Raabo and Terkildsen, 1960)
에의해500 nm
에서,
콜 레스테롤은효소법(Allain et al., 1974)
에의해500 nm
에서,
총 단백질은Biuret
법(Lubran, 1978)
에의해540 nm
에서각각시 판되고있는임상용kit (Asan Pharm. Co., Ltd)
를이용하여분 석하였다.
혈장 내 효소활성으로는
GOT (Glutamic oxalate trans- minase), GPT (Glutamic pyruvate transminase), ALP (Alka- line phosphatase)
를측정하였다. GOT
와GPT
는505 nm
에서Reitman-Frankel
법(Hollands and Logan, 1966), ALP King- King
법(King and King, 1954)
에의해500 nm
에서시판되고 있는임상용kit (Asan Pharm. Co., Ltd)
를이용하여분석하였 다.
항산화반응
간과아가미의항산화반응을측정하기위해
washing buffer (0.1 M KCl, pH 7.4)
로세척후, homogenizing buffer (0.1 M PBS, pH 7.4)
로Teflon-glass homogenizer
를이용하여균질화 하였다.
균질화한뒤4°C, 10,000 g
로60
분간원심분리하여상 등액을실험에사용하였다.
GST
활성은Habig (1974)
의방법을이용하여측정하였다.
일 정량의시료에0.2 M potassium phosphate (pH 6.5)
와증류수 를첨가,
혼합시킨뒤10 mM GSH
와10 mM CDNB
를첨가하 여실온에서1
분간반응시켰다.
반응뒤분광광도계를이용하 여340 nm
에서30
초단위로5
분간측정하여nmol/ min/ mg protein
으로표시하였다.
GSH
수준은Beutler (1984)
의방법을이용하였다.
상등액에precipitation solution (metaphosphoric acid, Na
2EDTA, NaCl)
을첨가하여혼합후, 4,500 g
에10
분간원심분리 하였다.
상 등액에0.3 M Na
2HPO
4를넣고, 0.5 nM DTNB
로발색시켜 분광광도계로412 nm
에서흡광도를측정하였다. GSH
함량은reduced glutathione standard curve
를 이용하여 측정하였고, nmol GSH/ mg protein
으로표시하였다.
유의성 검정
실험분석결과에대한통계학적유의성은
SPSS
통계프로그램
(SPSS Inc.)
을이용하여ANOVA test
를실시하여Tukey’s multiple range test
를통해P<0.05
일때유의성이있는것으로 간주하였다.
결 과
혈액성상분석
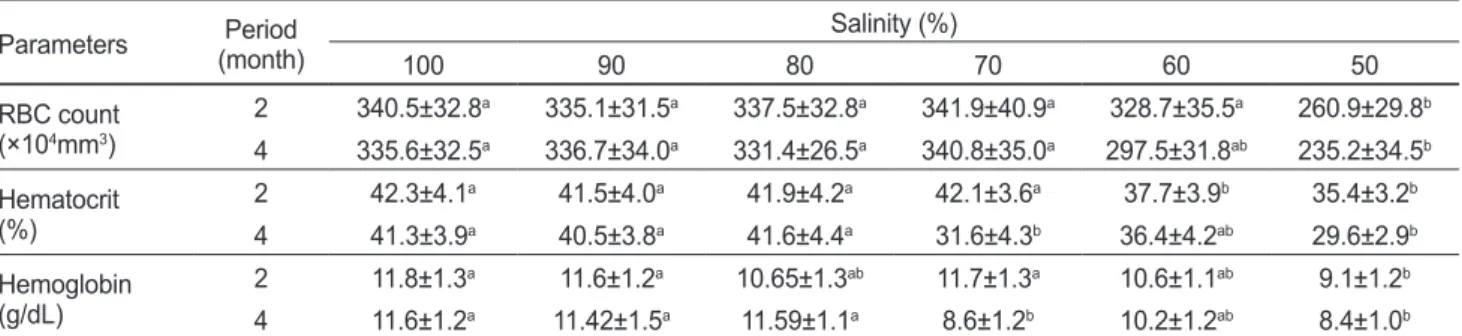
염분농도에따른은대구의혈액성상변화는
Table 1
에나타 내었다. RBC
수치는실험2
달과4
달뒤50%
의염분농도에서 유의적인 감소를 나타내었다(P<0.05). Hematocrit
는 실험2
달뒤
60%
이하의염분농도에서유의적감소를나타내었고,
실험
4
달뒤50%
의염분농도에서유의적감소를나타내었다(P<0.05). Hemoglobin
은실험2
달과4
달뒤50%
의염분농도 에서유의적인감소가나타났다(P<0.05).
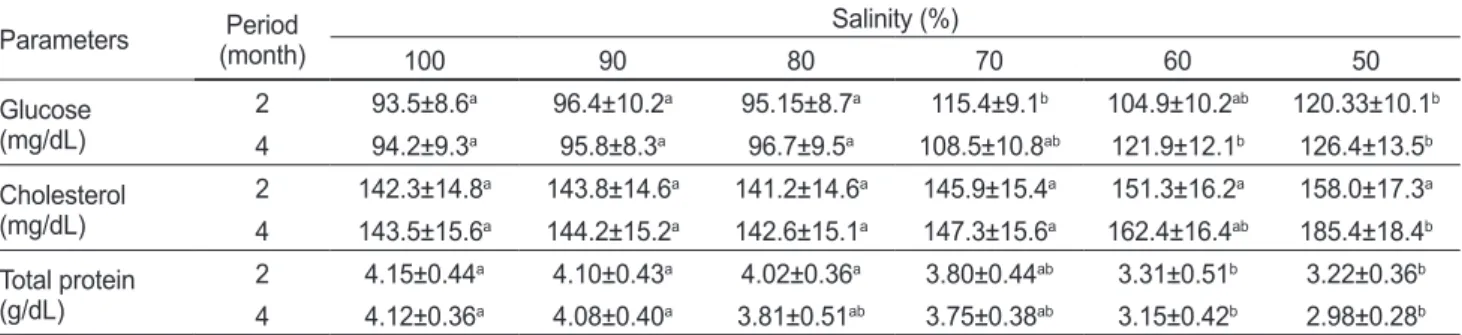
혈장성분 분석
혈장성분변화중무기성분변화는
Table 2
에나타내었다.
혈 장무기성분중칼슘은염분농도에의한유의적변화는나타나 지않았다.
혈장무기성분중마그네슘은실험4
달뒤50%
의염 분농도에서유의적감소를나타내었다(P<0.05).
혈장성분변화 중유기성분의변화는Table 3
에나타내었다.
글루코즈는실험2
달뒤50%
의염분농도에서유의적증가를나타내었으며,
실험
4
달뒤60%
이하의염분농도에서유의적증가를나타내었다
(P<0.05).
콜레스테롤은실험2
달뒤유의적변화를나타내지 않았지만,
실험4
달뒤50%
의염분농도에서유의적증가를나 타내었다(P<0.05).
반면총단백질은실험2
달과4
달뒤60%
이 하의염분농도에서유의적감소를나타내었다(P<0.05).
혈장성 분변화중효소성분의변화는Table 4
에나타내었다.
혈장GOT
는실험2
달뒤50%
의염분농도에서유의적으로증가하였고,
실험
4
달뒤60%
이하의염분농도에서유의적으로증가하였다
(P<0.05). GPT
는실험2
달과4
달뒤50%
의염분농도에서 유의적증가를나타내었다(P<0.05). ALP
역시실험2
달과4
달 뒤50%
의염분농도에서유의적증가를나타내었다(P<0.05).
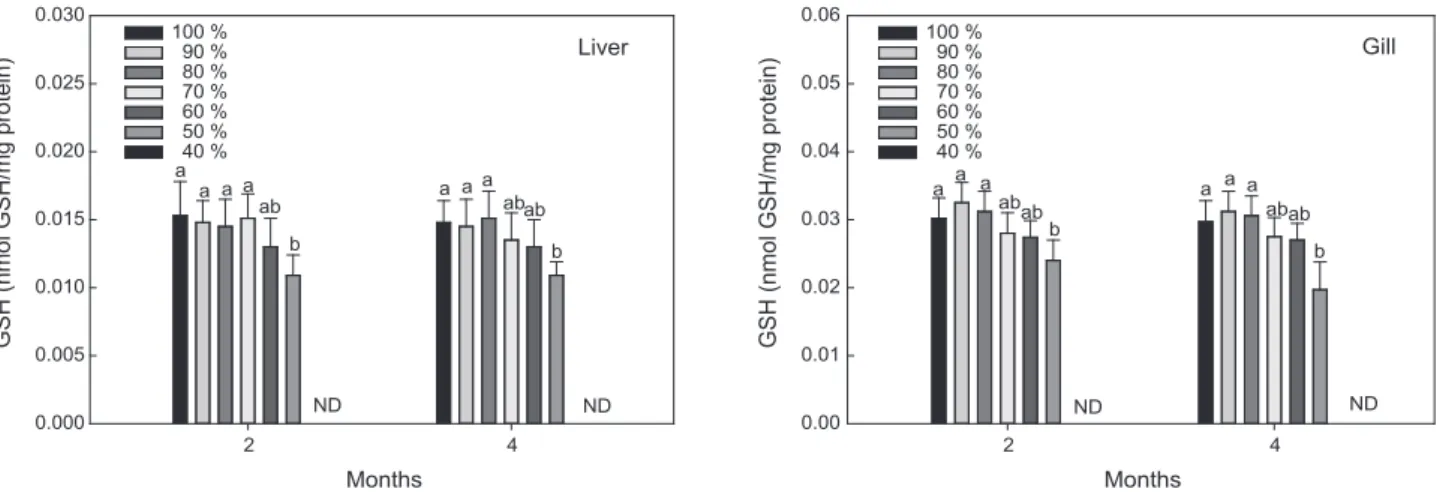
항산화반응
염분농도에따른
GST
활성의변화는Fig. 1
에 나타내었다.
간과아가미조직의GST
활성은노출2
달과4
달뒤50%
의염 분농도에서유의적으로감소하였다(P<0.05).
염분농도에따른Table 2. Changes of inorganic plasma components in sablefish Anoplopoma fimbria exposed to the different levels of salinity for 4 months Parameters Period
(month) Salinity (%)
100 90 80 70 60 50
Calcium
(mg/dL) 2 1.75±0.20a 1.73±0.21a 1.74±0.19a 1.73±0.27a 1.67±0.18a 1.70±0.17a 4 1.74±0.18a 1.76±0.20a 1.73±0.20a 1.75±0.25a 1.72±0.25a 1.70±0.18a Magnesium
(mg/dL) 2 3.33±0.29a 3.32±0.31a 3.38±0.34a 3.30±0.38a 3.29±0.23a 3.25±0.32a 4 3.32±0.32a 3.37±0.24a 3.42±0.33a 3.29±0.19a 2.95±0.37ab 1.97±0.25b Values are mean±S.E. Values with different superscript are significantly different at 2 months and 4 months (P<0.05) as determined by Tukey's multiple range test.
Table 1. Changes of RBC (red blood cell) count, Hematocrit and Hemoglobin in sablefish Anoplopoma fimbria exposed to the different levels of salinity for 4 months
Parameters Period (month)
Salinity (%)
100 90 80 70 60 50
RBC count
(×104mm3) 2 340.5±32.8a 335.1±31.5a 337.5±32.8a 341.9±40.9a 328.7±35.5a 260.9±29.8b 4 335.6±32.5a 336.7±34.0a 331.4±26.5a 340.8±35.0a 297.5±31.8ab 235.2±34.5b Hematocrit
(%) 2 42.3±4.1a 41.5±4.0a 41.9±4.2a 42.1±3.6a 37.7±3.9b 35.4±3.2b
4 41.3±3.9a 40.5±3.8a 41.6±4.4a 31.6±4.3b 36.4±4.2ab 29.6±2.9b Hemoglobin
(g/dL) 2 11.8±1.3a 11.6±1.2a 10.65±1.3ab 11.7±1.3a 10.6±1.1ab 9.1±1.2b
4 11.6±1.2a 11.42±1.5a 11.59±1.1a 8.6±1.2b 10.2±1.2ab 8.4±1.0b Values are mean±S.E. Values with different superscript are significantly different at 2 months and 4 months (P<0.05) as determined by Tukey's multiple range test.
염분농도가 은대구에 미치는 영향
833
GSH
수준의변화는Fig. 2
에나타내었다.
간조직의GSH
수준 은노출2
달과4
달뒤50%
의염분농도에서유의적으로감소를 나타내었고,
아가미조직의GSH
수준역시노출2
달과4
달뒤50%
의염분농도에서유의적으로감소하였다(P<0.05).
고 찰
어류에서염분변화에따른노출은어류의삼투압조절에필 요한체내이온평형에문제를일으키고
(Mccormick, 2001),
성 장및발달에사용할에너지를체내의항상성유지에소모함으 Fig. 1. Changes of GST (glutathione S-transferase) activity in liver and gill of sablefish, Anoplopoma fimbria exposed to the different levels of salinity for 4 months. Vertical bar denotes a standard error. Values with different superscript are significantly different at 2 months and 4 months (P<0.05) as determined by Tukey's multiple range test.Months
2 4
G ST (n m ol/ m in /m g pro te in)
0.000 0.001 0.002 0.003 0.004 0.005
a a a a
ab b a a a
ab b
Liver
ND ND
ab 100 %
90 % 80 % 70 % 60 % 50 % 40 %
Months
2 4
G ST (n m ol/ m in /m g pro te in)
0.000 0.001 0.002 0.003 0.004
0.005 100 %
90 % 80 % 70 % 60 % 50 % 40 %
a a a a
b a a
ab b
ND ND
Gill
ab abab
Months
2 4
G SH (n m ol G SH /m g pro te in)
0.000 0.005 0.010 0.015 0.020 0.025 0.030
100 % 90 % 80 % 70 % 60 % 50 % 40 %
a a a a b
a a aab b
ND ND
Liver
ab ab
Months
2 4
G SH (n m ol G SH /m g pro te in)
0.00 0.01 0.02 0.03 0.04 0.05
0.06 100 %
90 % 80 % 70 % 60 % 50 % 40 % aa a
ab b
a a a b
ND ND
Gill
ab abab
Table 3. Changes of organic plasma components in sablefish Anoplopoma fimbria exposed to the different levels of salinity for 4 months Parameters Period
(month) Salinity (%)
100 90 80 70 60 50
Glucose
(mg/dL) 2 93.5±8.6a 96.4±10.2a 95.15±8.7a 115.4±9.1b 104.9±10.2ab 120.33±10.1b 4 94.2±9.3a 95.8±8.3a 96.7±9.5a 108.5±10.8ab 121.9±12.1b 126.4±13.5b Cholesterol
(mg/dL) 2 142.3±14.8a 143.8±14.6a 141.2±14.6a 145.9±15.4a 151.3±16.2a 158.0±17.3a 4 143.5±15.6a 144.2±15.2a 142.6±15.1a 147.3±15.6a 162.4±16.4ab 185.4±18.4b Total protein
(g/dL) 2 4.15±0.44a 4.10±0.43a 4.02±0.36a 3.80±0.44ab 3.31±0.51b 3.22±0.36b 4 4.12±0.36a 4.08±0.40a 3.81±0.51ab 3.75±0.38ab 3.15±0.42b 2.98±0.28b Values are mean±S.E. Values with different superscript are significantly different at 2 months and 4 months (P<0.05) as determined by Tukey's multiple range test.
Table 4. Changes of enzymatic plasma components in sablefish Anoplopoma fimbria exposed to the different levels of salinity for 4 months Parameters Period
(month) Salinity (%)
100 90 80 70 60 50
GOT(karmen unit)
2 2.37±0.28a 2.33±0.26a 2.38±0.29a 2.36±0.25a 2.59±0.26ab 2.96±0.42b 4 2.33±0.24a 2.27±0.22a 2.37±0.32a 2.45±0.29a 3.23±0.33b 3.40±0.27b GPT(karmen unit) 2 1.65±0.17a 1.63±0.16a 1.64±0.22a 1.58±0.16a 1.82±0.15ab 1.95±0.27b 4 1.71±0.17a 1.62±0.32a 1.58±0.17a 1.98±0.27b 1.88±0.26ab 2.01±0.21b ALP(K-A) 2 5.54±0.61a 5.32±0.57a 5.63±0.47a 5.61±0.38ab 6.26±0.58ab 6.90±0.47b 4 5.60±0.53a 5.39±0.54a 5.70±0.61a 6.34±0.61ab 6.42±0.65ab 7.32±0.68b Values are mean±S.E. Values with different superscript are significantly different at 2 months and 4 months (P<0.05) as determined by Tukey's multiple range test. GOT, glutamic oxalate transminase; GPT, glutamic pyruvate transminase; ALP, alkaline phosphatase.
김준환
ㆍ
박희주ㆍ
황인기ㆍ
김도형ㆍ
오철웅ㆍ
이정식ㆍ
강주찬834
로써성장지연및질병에대한저항력을감소시킨다
(Kim et al., 2009; Xiu-mei and Wen-tao, 2005). Saoud et al. (2007)
는 적정삼투압이하의염분농도는해산어류의성장에영향을미 칠수있음을보고한바있으며,
실험에서40% psu (17.5 ppt)
이 하의저염분은rabbitfish
의성장을둔화시켰다.
RBC
수치, hematocrit,
그리고hemoglobin
과같은혈액학적 지표는외부스트레스영향에의한생리적반응을판단하는지 표로많이사용된다(Kim and Kang, 2016b; Roche and Boge,
1996).
본실험에서 저염분농도에서의은대구노출은유의적인혈액학적성상의감소를나타내었다
. Pufferfish
에서저염분 으로갈수록RBC count
와hematocrit
수치가유의적으로감 소가보고된바있다(Lee and Huh, 2004). Hematocrit
는어류 의빈혈과종합적인건강상태를판단하는주요한지표로환경 염분농도에많은영향을받으며,
저염분에 노출된cobia
에게 서hematocrit
의유의적감소를보고한바있다(Denson et al., 2003). Shirangi et al. (2016)
는저염분농도에노출된Persian sturgeon
에서더낮은hematocrit
값을보고했으며,
이는감소 된삼투조절요구에따른조직산소요구량의감소에의한것으 로판단된다. Tavares-Dias et al. (2000)
는hemoglobin
농도는hematocrit
비율과비례해서높은상관관계가있음을발견하였고
,
감소된hemoglobin
농도는서식환경의염분농도저하시나 타나는hematocrit
비율변화및적혈구순환저하의영향에따 른것으로보고한바있다
.
어종에따른이온농도의조절능력차이는서식지의염분변화 시종에따라스트레스요인으로작용할수있으며
,
혈액의다 양한성분에영향을미친다(Arnason et al., 2013; Imsland et
al., 2008).
혈장무기성분인칼슘과마그네슘은항상성을유지하기위해이온조절기능을하기때문에
,
환경변화에따른영향 을판단하는지표로많이이용되고있다(Bijvelds et al., 1998).
본실험에서염분농도에따른은대구혈장칼슘성분의변화는 나타나지않았지만
,
혈장마그네슘성분은유의적감소를나타 내어,
저염분이은대구혈장의이온조절에도영향을미치고있 음을확인하였다.
염분저하에따른마그네슘의주요기능인신 경자극의전달및근이완의저하는성장둔화를유발할수있 다(Bolton et al., 1987).
염분의변화에따른삼투압조절에서 문제가생기면뇌하수체내아세틸콜린의분비를초래하며,
이 는부신피질에서의콜티졸분비를촉진시킨다.
분비된콜티졸 은염류세포의능동수송에의한작용을증대시키고혈당이용 을 억제함으로써,
혈중글루코즈의농도를증가시킨다(Oh et al., 2014).
본실험에서저염분의노출은은대구의혈장글루코 즈를유의적으로증가시켰다. Tsuzuki et al. (2001)
역시낮은 농도의염분노출이pejerrey
의스트레스를유발하여,
스트레스 에따른글루코즈의변화를보고한바있다.
콜레스테롤은세 포막필수구조성분이며,
스테로이드호르몬전구체이다.
콜레 스테롤의증가는간과신장기능의실패로혈액으로콜레스테 롤의분비에따른결과로판단된다.
따라서콜레스테롤의증가 는환경적스트레스를판단하는주요한지표로이용된다(Oner et al., 2008).
본실험에서낮은염분의노출은은대구의콜레스 테롤수치를유의적으로증가시켰다. Jave and Usmani
역시오 염된환경에노출된Channa punctatus
에서증가된콜레스테롤 수치를보고한바있다.
총단백질은수분평형과영양상태를판 단하는유용한지표이며,
환경적염분농도에따라민감하게반 응한다(Chang and Hur, 1999).
본실험에서저염분노출에의 해은대구의혈장단백질은유의적으로감소하였다. Lee and Huh (2004)
는pufferfish
의총단백질이저염분노출에의해유 의적으로변화였다고보고한바있다.
혈장효소성분에서GOT,
GPT,
그리고ALP
는환경변화에따른간조직손상및영향을판단하는 지표로많이사용되고 있다
(Kim and Kang, 2015).
Fig. 2. Changes of GSH (glutathione) level in liver and gill of sablefish, Anoplopoma fimbria exposed to the different levels of salinity for 4 months. Vertical bar denotes a standard error. Values with different superscript are significantly different at 2 months and 4 months (P<0.05) as determined by Tukey's multiple range test.
Months
2 4
G ST (n m ol/ m in /m g pro
0.000 0.001 0.002 0.003
a a a a
ab b a a a
ab b
ND ND
ab 50 %
40 %
Months
2 4
G ST (n m ol/ m in /m g pro
0.000 0.001 0.002 0.003
50 % 40 %
a a a a
b a a
ab b
ND ND
ab abab
Months
2 4
G SH (n m ol G SH /m g pro te in)
0.000 0.005 0.010 0.015 0.020 0.025 0.030
100 % 90 % 80 % 70 % 60 % 50 % 40 %
a a a a b
a a aab b
ND ND
Liver
ab ab
Months
2 4
G SH (n m ol G SH /m g pro te in)
0.00 0.01 0.02 0.03 0.04 0.05
0.06 100 %
90 % 80 % 70 % 60 % 50 % 40 % aa a
ab b
a a a b
ND ND
Gill
ab abab
염분농도가 은대구에 미치는 영향
835
본실험에서은대구의혈장
GOT, GPT,
그리고ALP
는낮은염 분농도의노출에의해유의적으로증가를나타냈다.
이와유사 하게낮은염분농도에노출된rockfish
의혈장GOT
에서도유 의적인증가가나타났다(Oh et al., 2014). Wickee and Morgan (1976)
역시염분농도에따른American oyster
의GOT
값의유 의적변화를보고하였다. Fazio et al. (2013)
은염분농도에따 른mullet
의유의적인GOT
와GPT
의변화를보고하기도하였 다. Joseph and Philip(2007)
역시낮은농도의염분노출은gi- ant tiger prawn
에서염분스트레스를유발하여ALP
와같은혈 액학적성상을변화시켰다고보고하였다.
본실험에서저염분 농도에노출된은대구혈장성분의변화는염분의변화가은대 구의혈장성상에도많은영향을미치고있음을보여주고있다.
어류에게염분의변화는활성산소를생성함으로써,
산화스트 레스로작용할수있다(Lushchak, 2011).
본실험에서저염분농 도에노출된은대구의GST
활성과GSH
수준은유의적으로감 소하였다. Ruiz and Blumwald (2002)
는GSH
합성은염분스 트레스에의해유발된산화스트레스로인한영향을받을수있 다고보고한바있다. Donham et al. (2006)
은염분농도에의해white sturgeon
과Chinook salmon
에서GST
수준이유의적으 로변화했음을보고한바있다.
그리고많은연구자들은염분이 수중생물의GST
활성에영향을미친다고보고한바있다(Lau et al., 2004; Cailleaud et al., 2007).
이와같이,
염분의변화는 산화스트레스를유발하며,
본실험에서은대구GST
와GSH
와 같은항산화반응의지표의유의적변화는저염분농도에서산화 스트레스에따른영향을받았을것으로판단된다.
본염분의노출에따른은대구의성장및혈액학적성상변화 에대한결과는장기간의염분노출이은대구의성장및생리 적변화에상당한영향을주었으며
,
그리고이러한변화에따른 스트레스또는항상성유지를위한많은에너지를소모했을것 으로판단된다.
본실험의결과치어기의은대구에서염분농도60%
이하의노출은은대구에상당한영향을미칠것이며,
향후은대구양식에서저염분노출에따른영향을판단할수있는기 준이마련되어야할것이다
.
사 사
이논문은
2016
년해양수산부재원으로한국해양과학기술진흥원의지원을받아수행된연구임
(
은대구인공종묘생산실용 기술개발).
References
Allain CC, Poon LS, Chan CS, Richmond WFPC and Fu PC.
1974. Enzymatic determination of total serum cholesterol.
Clinical Chem 20, 470-475.
Arnason T, Magnadottir B, Bjornsson B, Steinarsson A and Bjornsson BT. 2013. Effects of salinity and temperature on growth, plasma ions, cortisol and immune parameters of ju-
venile Atlantic cod (Gadus morhua). Aquaculture 380-383, 70-79. http://dx.doi.org/10.1016/j.aquaculture.2012.11.036.
Azim W, Parveen S and Parveen S. 2002. Comparison of photo- metric cyanmethemoglobin and automated methods for he- moglobin estimation. J Ayub Med Coll Abbottabad 14, 22-3.
Bolton JP, Collie NL, Kawauchi H and Hirano T. 1987. Os- moregulatory actions of growth hormone in rainbow trout (Salmo gairdneri). J Endocrinol 112, 63-68.
Bijvelds MJ, Velden JA, Kolar ZI and Flik G. 1998. Magnesium transport in fresh-water teleosts. J Exp Biol 201, 1981-1990.
Cailleaud K, Maillet G, Budzinski H, Souissi S and Forget-Ler- ay J. 2007. Effects of salinity and temperature on the expres- sion of enzymatic biomarkers in Eurytemora affinis (Cala- noida, Copepoda). Comp Biochem Physiol A 147, 841-849.
http://dx.doi.org/10.1016/j.cbpa.2006.09.012.
Chang YJ and Hur JW. 1999. Physiological responses of grey mullet, Mugil cephalus and Nile tilapia Oreochromis ni
loticus by rapid changes in salinity of rearing water. Fish
Aquatic Sci 32, 310-316.Connerty HV and Briggs AR. 1966. Determination of serum calcium by means of orthocresolphthalein complexone.
American J Clinical Pathol 45, 290-296.
Denson MR, Stuart KR and Smith TIJ. 2003. Effects of salinity on growth, survival, and selected hematological parameters of juvenile cobia Rachycentron canadum. J World Aquac Soc 34, 496-504. http://dx.doi.org/10.1111/j.1749-7345.2003.
tb00088.x.
Donham RT, Morin D and Tjeerdema RS. 2006. Salinity ef- fects on activity and expression of glutathione S-trans- ferases in white sturgeon and Chinook salmon. Ecotoxi- col Environ Saf 63, 293-298. http://dx.doi.org/10.1016/j.
ecoenv.2005.01.007.
Fazio F, Marafioti S, Arfuso F, Piccione G and Faggio C. 2013.
Influence of different salinity on haematological and bio- chemical parameters of the widely cultured mullet, Mugil
cephalus. Mar Freshw Behav Physiol 46, 211-218. http://
dx.doi.org/10.1080/10236244.2013.817728.
Hollands M and Logan JE. 1966. An examination of commer- cial kits for the determination of glutamic oxaloacetic trans- aminase (GOT) and glutamic pyruvic transaminase (GPT) in serum. Canadian Medical Association J 95, 303.
Imsland AK, Gustavsson A, Gunnarsson S, Foss A, Arnason J, Arnarson I, Jonsson A F, Smaradottir H and Thorarensen H.
2008. Effects of reduced salinities on growth, feed conver- sion efficiency and blood physiology of juvenile Atlantic hal- ibut (Hippoglossus hippoglossus L.). Aquaculture 274, 254- 259. http://dx.doi.org/10.1016/j.aquaculture.2007.11.021.
Javed M and Usmani N. 2015. Stress response of biomolecules (carbohydrate, protein and lipid profiles) in fish Channa punctatus inhabiting river polluted by Thermal Power Plant effluent. Saudi J Biol Sci 22, 237-242. http://dx.doi.
org/10.1016/j.sjbs.2014.09.021.
Joseph A and Philip R. 2007. Acute salinity stress alters the hae- molymph metabolic profile of Penaeus monodon and re- duces immunocompetence to white spot syndrome virus in- fection. Aquaculture 272, 87-97. http://dx.doi.org/10.1016/j.
aquaculture.2007.08.047.
Kannan MB, Yamamoto A and Khakbaz H. 2015. Influence of living cells (L929) on the biodegradation of magnesium–
calcium alloy. Colloids and Surfaces B: Biointerfaces 126, 603-606. http://dx.doi.org/10.1016/j.colsurfb.2015.01.015.
Kim JH and Kang JC. 2014. The selenium accumulation and its effect on growth, and haematological parameters in red sea bream, Pagrus major, exposed to waterborne selenium. Eco- toxicol Environ Saf 104, 96-102. http://dx.doi.org/10.1016/j.
ecoenv.2014.02.010.
Kim JH and Kang JC. 2015. The lead accumulation and hema- tological findings in juvenile rock fish Sebastes schlegelii exposed to the dietary lead (II) concentrations. Ecotoxi- col Environ Saf 115, 33-39. http://dx.doi.org/10.1016/j.
ecoenv.2015.02.009.
Kim JH and Kang JC. 2016a. Oxidative stress, neurotoxicity, and metallothionein (MT) gene expression in juvenile rock fish Sebastes schlegelii under the different levels of dietary chromium (Cr6+) exposure. Ecotoxicol Environ Saf 125, 78-84. http://dx.doi.org/10.1016/j.ecoenv.2015.12.001.
Kim JH and Kang JC. 2016b. The chromium accumulation and its physiological effects in juvenile rockfish, Sebastes
schlegelii, exposed to different levels of dietary chromium
(Cr6+) concentrations. Environ Toxicol Pharmacol 41, 152- 158. http://dx.doi.org/10.1016/j.etap.2015.12.001.Kim MJ, Chung SC and Song CB. 2004. Effect of salinity on growth and survival of olive flounder, Paralichthys oliva
ceus. Korean J Ichthyol 16, 100-106.
Kim YS, Do YH, Min BH, Lim HK, Lee BK and Chang YJ.
2009. Physiological responses of starry flounder Platichthys
stellatus during freshwater acclimation with different speeds
in salinity change. Aquaculture 22, 28-33.King RN and King ET. 1954. Estimation of plasma phosphatase by determination of hydrolyzed with amino antipyrene. J Clinical Pathol 7, 332-338.
Lau PS, Wong HL and Carrigues Ph. 2004. Seasonal variation in antioxidative responses and acetylcholinesterase activity in Perna viridis in eastern oceanic and western estuarine waters of Hong Kong. Cont Shelf Res 24, 1969-1987. http://dx.doi.
org/10.1016/j.csr.2004.06.019.
Lee BK and Huh MK. 2004. Effects of Varying Salinity on the Growth and Hematological Response of Juvenile Pufferfish,
Takifugu obscurus. Korean J Ichthyol 16, 254-260.
Lubran MM. 1978. The measurement of total serum proteins by the Biuret method. Annals Clinical Laboratory Sci 8, 106- Lushchak VI. 2011. Environmentally induced oxidative stress 110.
in aquatic animals. Aquat Toxicol 101, 13-30. http://dx.doi.
org/10.1016/j.aquatox.2010.10.006.
McCormick SD. 2001. Endocrine control of osmoregulation in teleost fish. American zoologist 41, 781-794. http://dx.doi.
org/10.1093/icb/41.4.781.
Oh SY, Kim CK, Jang YS, Choi HJ and Myoung JG. 2014.
Effect of salinity on survival, oxygen consumption and blood physiology of Korean rockfish Sebastes schlegelii.
Ocean Polar Res 36, 135-143. http://dx.doi.org/10.4217/
OPR.2014.36.2.135.
Oner M, Atli G and Canli M. 2008. Changes in serum bio- chemical parameters of freshwater fish Oreochromis niloti
cus following prolonged metal (Ag, Cd, Cr, Cu, Zn) expo-
sures. Environ Toxicol Chem 27, 360-366. http://dx.doi.org/10.1897/07-281R.1.
Panfili J, Thior D, Ecoutin JM, Ndiaye P and Albaret JJ. 2006.
Influence of salinity on the size at maturity for fish spe- cies reproducing in contrasting West African estuaries.
J Fish Biol 69, 95-113. http://dx.doi.org/10.1111/j.1095- 8649.2006.01069.x.
Partridge GJ and Jenkins GI. 2002. The effect of salin- ity on growth and survival of juvenile black bream (Ac
anthopagrus butcheri). Aquaculture 210, 219-230. http://
dx.doi.org/10.1016/S0044-8486(01)00817-1.
Raabo BE and Terkildsen TC. 1960. On the enzymat- ic determination of blood glucose. Scandinavian J Clinic Laborat Investig 12, 402-407. http://dx.doi.
org/10.3109/00365516009065404.
Regoli F and Principato G. 1995. Glutathione, glutathione- dependent and antioxidant enzymes in mussel, Mytilus
galloprovincialis, exposed to metals under field and labo-
ratory conditions: implications for the use of biochemi- cal biomarkers. Aquat Toxicol 31, 143-164. http://dx.doi.org/10.1016/0166-445x(94)00064-W.
Roche H and Bogé G. 1996. Fish blood parameters as a potential tool for identification of stress caused by environmental fac- tors and chemical intoxication. Mar Environ Res 41, 27-43.
http://dx.doi.org/10.1016/0141-1136(95)00015-1.
Ruiz JM and Blumwald E. 2002. Salinity-induced glutathione synthesis in Brassica napus. Planta 214, 965-969. http://
dx.doi.org/10.1007/s00425-002-0748-y.
Saoud IP, Kreydiyyeh S, Chalfoun A and Fakih M. 2007. In- fluence of salinity on survival, growth, plasma osmolality and gill Na+–K+–ATPase activity in the rabbitfish Siganus rivulatus. J Exp Mar Bio Ecol 348, 183-190. http://dx.doi.
org/10.1016/j.jembe.2007.05.005.
Sclafani M, Taggart CT and Thompson KR. 1993. Condition, buoyancy and the distribution of larval fish: implications for vertical migration and retention. J Plankton Res 15, 413- 435. http://dx.doi.org/10.1093/plankt/15.4.413.
Shirangi SA, Kalbassi MR, Khodabandeh S, Jafarian H, Lorin- Nebel C, Farcy E and Lignot JH. 2016. Salinity effects on osmoregulation and gill morphology in juvenile Persian
염분농도가 은대구에 미치는 영향
837
sturgeon (Acipenser persicus). Fish Physiol Biochem 1-14.
http://dx.doi.org/10.1007/s10695-016-0254-y.
Tavares-Dias M, Schalch SHC, Martins ML, Onaka EM and Moraes FR. 2000. Hematological characteristics of Brazil- ian Teleosts. III. Parameters of the hybrid tambacu(Piaractus
mesopotamicus × Colossoma macropomum Cuvier) (Ostei-
chthyes, Characidae). Revista Bras Zool 17, 899-906. http://dx.doi.org/10.1590/S0101-81752000000400002.
Tsuzuki MY, Ogawa K, Strussmann CA, Maita M and Ta- kashima F. 2001. Physiological responses during stress and subsequent recovery at different salinities in adult pejerrey
Odontesthes bonariensis. Aquaculture 200, 349-362. http://
dx.doi.org/10.1016/S0044-8486(00)00573-1.
Webb NA and Wood CM. 2000. Bioaccumulation and dis- tribution of silver in four marine teleosts and two marine elasmobranchs: influence of exposure duration, concentra- tion, and salinity. Aquat Toxicol 49, 111-129. http://dx.doi.
org/10.1016/S0166-445X(99)00063-6.
Wickes MA and Morgan RP. 1976. Effects of salinity on three enzymes involved in amino acid metabolism from the American oyster, Crassostrea virginica. Comp Biochem Physiol B 53, 339-343. http://dx.doi.org/10.1016/0305- 0491(76)90338-2.
Xiu-mei WXJZ and Wen-tao LI. 2005. Effects of salinity on the non-specific immuno-enzymetic activity of Sebastes
schlegeli [J]. Mar Fish Res 6, 004.
Yin F, Peng S, Sun P and Shi Z. 2011. Effects of low salinity on antioxidant enzymes activities in kidney and muscle of juve- nile silver pomfret Pampus argenteus. Acta Ecologica Sinica 31, 55-60. http://dx.doi.org/10.1016/j.chnaes.2010.11.009.
Zarejabad AM, Jalali MA, Sudagar M and Pouralimotlagh S.
2010. Hematology of great sturgeon (Huso huso Linnaeus, 1758) juvenile exposed to brackish water environment. Fish Physiol Biochem 36, 655-659. http://dx.doi.org/10.1007/
s10695-009-9339-1.