http://e-nrp.org
Effects of natural raw meal (NRM) on high-fat diet and dextran sulfate sodium (DSS)-induced ulcerative colitis in C57BL/6J mice
Sung-Ho Shin
1,2, Jia-Le Song
1, Myoung-Gyu Park
2, Mi-Hyun Park
2, Sung-Joo Hwang
2and Kun-Young Park
1§1Department of Food Science and Nutrition, and Kimchi Research Institute, Pusan National University, 2, Busandaehak-ro 63 beon-gil, Geumjeong-gu, Busan 609-735, Korea
2Erom R&D Center, Erom Co., Ltd., Chuncheon, Gangwon-do 200-943, Korea
BACKGROUND/OBJECTIVES: Colitis is a serious health problem, and chronic obesity is associated with the progression of colitis.
The aim of this study was to determine the effects of natural raw meal (NRM) on high-fat diet (HFD, 45%) and dextran sulfate sodium (DSS, 2% w/v)-induced colitis in C57BL/6J mice.
MATERIALS/METHODS: Body weight, colon length, and colon weight-to-length ratio, were measured directly. Serum levels of obesity-related biomarkers, triglyceride (TG), total cholesterol (TC), low density lipoprotein (LDL), high density lipoprotein (HDL), insulin, leptin, and adiponectin were determined using commercial kits. Serum levels of pro-inflammatory cytokines including tumor necrosis factor-α (TNF-α), interleukin (IL)-1β, and IL-6 were detected using a commercial ELISA kit. Histological study was performed using a hematoxylin and eosin (H&E) staining assay. Colonic mRNA expressions of TNF-α, IL-1β, IL-6, inducible nitric oxide synthase (iNOS), and cyclooxygenase-2 (COX-2) were determined by RT-PCR assay.
RESULTS: Body weight and obesity-related biomarkers (TG, TC, LDL, HDL, insulin, leptin, and adiponectin) were regulated and obesity was prevented in NRM treated mice. NRM significantly suppressed colon shortening and reduced colon weight-to-length ratio in HFD+DSS induced colitis in C57BL/6J mice (P < 0.05). Histological observations suggested that NRM reduced edema, mucosal damage, and the loss of crypts induced by HFD and DSS. In addition, NRM decreased the serum levels of pro-inflammatory cytokines, TNF-α, IL-1β, and IL-6 and inhibited the mRNA expressions of these cytokines, and iNOS and COX-2 in colon mucosa (P < 0.05).
CONCLUSION: The results suggest that NRM has an anti-inflammatory effect against HFD and DSS-induced colitis in mice, and that these effects are due to the amelioration of HFD and/or DSS-induced inflammatory reactions.
Nutrition Research and Practice 2015;9(6):619-627; doi:10.4162/nrp.2015.9.6.619; pISSN 1976-1457 eISSN 2005-6168
Keywords: Natural raw meal (NRM), anti-inflammation, cytokines, iNOS, COX-2
INTRODUCTION
8)Intake of natural materials is known to aid in the maintenance of body health and to prevent development of chronic diseases [1]. Traditionally, natural raw meal, also called Saengshik in Korea and heat-processed powder meal (Sunsik), has been eaten as health food instead of normal diets by Buddhist monks practi- cing meditation in Korean temples [2]. Saengshik is a mixture of powdered raw meals containing whole grains, fruits, vegetables, and other natural materials, and easily eaten by mixing it with water, milk, or other liquids. It has also been shown to have higher nutritional value [3] and had a greater anti-inflammatory effect than Sunsik in our study. Several studies have reported that Saengshik has protective effects on carbon tetrachloride (CCl
4)- induced protein oxidative damage in mouse liver, and other health benefits, such as anti-diabetes, anti-hyperlipidemia, anti- obesity, immune enhancement, anti-oxidative, detoxifying, fatty
liver improving, and other effects in human and animal studies [4-11]. Natural raw meal (NRM), called raw meal in America, which is regarded as a natural health food, contains high levels of freeze-dried fresh whole grains, vegetables, and berries instead of legumes due to high allergic score [12], which is a critical difference between it and Saengshik manufactured in South Korea [5].
Obesity is a cause of chronic diseases [13]. Unhealthy lifestyle, particularly high intake of fat and carbohydrates, is the main cause of obesity, which is known to be associated with chronic systemic inflammation, and diseases such as diabetes, cardio- vascular disease, and cancer [14]
.Approximately 66% of adult Americans are considered overweight or obese, and it was found that such morbidity has increased over time [15]
.In addition, association of high-fat intake with promotion of inflam- matory bowel disease (IBD) such as Crohn’s disease (CD) and ulcerative colitis (UC) has also been reported [16]. Adipose
This work was supported by a research grant (BCUM-B12019) from the National Center of Efficacy Evaluation for the Development of Health Products Targeting Digestive Disorders (NCEED) funded by the Ministry of Health and Welfare (Korea).
§Corresponding Author: Kun-Young Park, Tel. 82-51-510-2839, Fax. 82-51-514-3138, Email. [email protected] Received: January 19, 2015, Revised: March 31, 2015, Accepted: May12, 2015
This is an Open Access article distributed under the terms of the Creative Commons Attribution Non-Commercial License (http://creativecommons.org/licenses/by-nc/3.0/) which permits unrestricted non-commercial use, distribution, and reproduction in any medium, provided the original work is properly cited.
Ingredient (g/1000g diet)
Groups
Norm.1) HFD2) DSS3) HFD +DSS4) HFD+DSS+NL5) HFD+DSS +NH6)
Casein 200 245 200 245 164.1 66.2
L-Cystine 3 4 3 4 8.3 1.0
Corn starch 397.5 85 397.5 85 56.9 23.0
Maltodextrin 132 115 132 115 77.0 31.1
Sucrose 100 200 100 200 134.0 54.0
Lard - 195 - 195 130.6 52.7
Soybean oil 70 30 70 30 20.1 8.1
Cellulose 50 58 50 58 38.8 15.7
Mineral mix (AIN-93G-MX) 35 43 35 43 28.8 11.6
Vitamin mix (AIN-93VX) 10 19 10 19 12.7 5.1
Calcium phosphate, dibasic 3 3 2.3 3.0
Choline bitartrate 2 3 2 3 2.0 3.0
Red food color 0.1 0.1 0.1 0.1
NRM (natural raw meal) 330.2 725.1
Total calorie (cal/g) 3,800.0 4,600.0 3,800.0 4,600.0 4,600.0 4,600.0
1)Norm: normal control mice
2)HFD: mice treated with a high-fat diet (HFD, 45%)
3)DSS: mice treated with DSS (2%) and a normal diet
4)HFD+DSS: mice treated with HFD and DSS
5)HFD+DSS+NL: mice treated with HFD and DSS with 30% NRM in diet
6)HFD+DSS+NH: mice treated with HFD and DSS with 70% NRM in diet Table 2. Diet Compositions
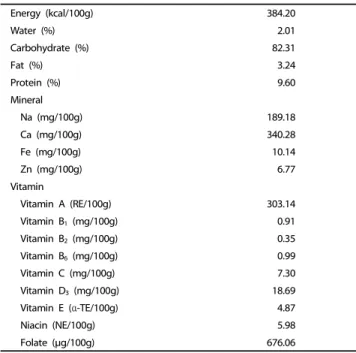
Energy (kcal/100g) 384.20
Water (%) 2.01
Carbohydrate (%) 82.31
Fat (%) 3.24
Protein (%) 9.60
Mineral
Na (mg/100g) 189.18
Ca (mg/100g) 340.28
Fe (mg/100g) 10.14
Zn (mg/100g) 6.77
Vitamin
Vitamin A (RE/100g) 303.14
Vitamin B1 (mg/100g) 0.91
Vitamin B2 (mg/100g) 0.35
Vitamin B6 (mg/100g) 0.99
Vitamin C (mg/100g) 7.30
Vitamin D3 (mg/100g) 18.69
Vitamin E (α-TE/100g) 4.87
Niacin (NE/100g) 5.98
Folate (μg/100g) 676.06
Table 1. Nutrient content of Natural Raw Meal (NRM, JUVO®)
tissues are important endocrine organs that secrete various cytokines, such as TNF-α and IL-6, and modulate the activities of immune cells, macrophages, and mast cells [17]. These immune cells, in themselves or due to intercellular interactions or interac- tions with adipocytes, increase the expression of leukocyte adhesion molecules, chemokines, and adipokines, such as leptin and adiponectin, and thereby enhance inflammatory response and exacerbate IBD [18]
.In particular, Batra et al. [19] reported that leptin, the well-known adipokine in adipose tissues, was found to accelerate progress of IBD in a comparative mouse model.
The etiology of UC remains unclear. In general, its pathogenesis is believed to involve complex interactions between the intestinal microbial environment, persistent pathogenic infections, dysre- gulation of the colonic mucosal immune system, and genetic and environmental factors [20]
.Currently, it is widely accepted that UC and CD are caused by inflammation-related, cytokine- driven, and/or mixed inflammatory infiltrates in intestinal mucosa [21], and it is clear that levels of inflammatory factors, such as TNF-α, IL-1β, IL-6, and IL-8, are elevated in the inflamed colonic tissues of patients [22]
.Furthermore, the combination of high-fat diet (HFD)-induced obesity and dextran sodium sulfate (DSS)-induced chronic UC induced by DSS synergistically exacerbate colon inflammation [23]. Therefore, we designed an obesity-associated colitis mouse model based on induction with HFD+DSS treatment and used it to evaluate the anti-inflam- mation effects of NRM.
MATERIALS AND METHODS
Samples and preparation of the experimental diet
Natural raw meal (NRM, JUVO®) was provided by Erom Inc.
(La Mirada, CA, USA), and it was manufactured in an NPA GMP Organic certified facility to ensure quality control, and stored
at room temperature until needed. This material contains
freeze-dried and powdered brown rice, fruits and vegetables,
and other materials. Its main ingredients are brown rice, black
rice, millet flour, berries, parsley, beet, mushroom, chlorella,
broccoli, carrots, pumpkin, kale, burdock, spirulina, cabbage,
spinach, potato, and sweet potato. The nutrient contents of
NRM were analyzed by the Korean Health Supplement Institute
according to the Food Code of South Korea (results are
summarized in Table 1). Other than those compounds, NRM
is presumed to be rich in phytochemicals including polyphenols,
anthocyanins, phytosterols, flavonoids, tocopherols, gamma- oryzanol, resistant starch (RS), and dietary fiber [24,25].
Male C57BL/6J mice (6 weeks old, 16-18 g) were purchased from Samtako Bio Korea (Gyeonggi-do, South Korea), and were housed under a 12-h light/dark cycle at room temperature with ad libitum access to food and water. Animals were randomly divided into six groups of ten mice per group: group 1 (Normal) mice were given a normal diet (AIN-93G); group 2 (HFD) mice were given a HFD (AIN-93G; 45% HFD), group 3 (DSS) mice were given a normal diet and DSS (2%, w/v), group 4 (HFD+DSS) mice were both given an HFD and treated with DSS, group 5 (HFD+DSS+NL) and group 6 (HFD+DSS+NH) mice were given an HFD containing 30% and 70% NRM and treated with DSS, respectively.
The compositions of the experimental diets used in this study are shown in Table 2. To resolve the differences of nutrient in the control diet and the experimental diet containing NRM, the NRM used in this study was analyzed for its carbohydrate, lipid, and protein. All diets were prepared to have an equivalent energy density. Animals were given DSS (2%, w/v) in drinking water for week 1 and week 4 of the experiment [26]. At the end of the 8-week experimental period, mice were euthanized using CO
2. Colon lengths and weights were determined and blood samples collected from inferior vena cava were transferred to tubes and centrifuged (3,000 × g for 10 min at 4°C) for the biochemical assay of sera. The protocol used for this study was approved by the Institutional Animal Care and Use Committee (PNU-IACUC; approval number PNU-2009-00034) of Pusan National University in Busan, Korea.
Chemicals reagents
TriZol, oligo dT
18primer, reverse transcriptase buffer, dNTPs, murine Maloney leukemia virus (MMLV) reverse transcriptase, RNase inhibitor, and agarose were obtained from Invitrogen Life Technologies (Carlsbad, CA, USA). Ethidium bromide (EtBr) was purchased from Sigma (St. Louis, MO, USA), and dextran sulfate sodium (DSS; molecular weight: 36,000-50,000) from MP Biom- edical (Solon, OH, USA). All chemicals used were of analytical grade.
Serum levels of triglyceride, total cholesterol, low density lipoprotein and high density lipoprotein assay
Serum levels of triglyceride (TG), total cholesterol (TC), low density lipoprotein (LDL), and high density lipoprotein (HDL) were determined using commercial assay kits purchased from Asan Pharmaceutical (Seoul, South Korea). Serum insulin, leptin, and adiponectin levels were also determined using a commercial ELISA kit (Biolegend, San Diego, CA).
Histological observations
Samples of distal colon of each animal were examined histologically. Colon tissues were fixed in 10% (v/v) neutral buffered formalin, dehydrated in ethanol, and embedded in paraffin. Sections (4-μm thick) were then prepared and stained with hematoxylin and eosin (H&E). A Zeiss Axioskop 2 Plus microscope (Carl Zeiss Microimaging, Thornwood, NY, USA) equipped with an AxioCam MRc5 CCD camera (Carl Zeiss) was used for acquisition of images.
Measurement of serum pro-inflammatory cytokine levels Serum pro-inflammatory cytokine levels were measured using a commercial ELISA kit (ELISA MAK; Biolegend, San Diego, CA).
After performing reactions, absorbance was measured at 450 nm using a spectrophotometer.
RT-PCR of pro-inflammation cytokines and inflammation-related enzymes
The colonic expressions of the mRNAs of TNF-α, IL-1β, IL-6, iNOS, and COX-2 were measured by RT-PCR. Total RNA was isolated from colonic tissue (100 mg) using Trizol reagent (according to the manufacturer’s recommendations), centrifuged at 12,000 × g for 15 min at 25°C after the addition of chloroform.
Isopropanol was then added (1:1 v/v) to supernatants and total RNAs was pelleted by centrifugation at 12,000 × g for 15 min at 4°C. After washing pellets with ethanol, RNAs were solubilized in diethyl pyrocarbonate-treated RNase-free water and quantified by measuring absorbance at 260 nm using a UV-2401PC spectrophotometer (Shimadzu, Kyoto, Japan). Equal amounts of RNA (1 μg/μl) were reverse-transcribed in a master mix containing 1 × reverse transcriptase buffer, 1mM dNTPs, 500 ng of oligo dT18 primers, 140 units of MMLV reverse transcriptase, and 40 units of RNase inhibitor for 45 min at 42°C. PCR was then performed in an automatic thermocycler (Bioneer, Daejeon, South Korea) over 25 cycles (94°C for 30 s, 55°C for 30, 72°C for 40 s) followed by an 8-min extension at 72°C. PCR products were separated in 2% agarose gels and visualized by EtBr staining. Gene expressions were quantified using Image J software (NIH, Maryland, MD, USA). β-actin was used as an internal control.
Statistical analysis
Results are presented as mean ± SD. Significances of differences between mean values were assessed using one-way ANOVA with Duncan’s multiple range test. P-values of < 0.05 were considered significant. Statistical analysis was performed using the SAS v 9.1 software package (SAS Institute Inc., Cary, NC, USA).
RESULTS
Effect of NRM on body weights and serum lipid profiles in HFD and DSS-induced colitis mice
Body weights
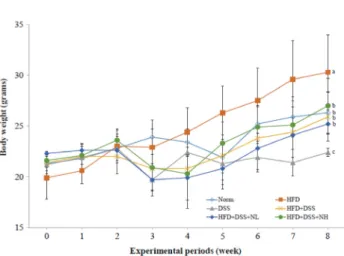
As shown in Fig. 1, mice in the Normal group (24.1 ± 2.2 g) had significantly lower body weights than those in the HFD group (27.9 ± 3.0 g, P < 0.05). However, mice in the DSS group (20.5 ± 0.8 g) had significantly lower body weights than normal controls (P < 0.05). Mean body weight in the HFD+DSS group (24.5 ± 2.8 g) was between those of the HFD and DSS groups.
Mice fed low- and high levels of NRM had 24.7 ± 3.0 g and 23.5
± 1.0 g of body weight, respectively, which were close to that of normal group.
Serum levels of TG, TC, LDL, and HDL
Similar serum levels of TG, TC, LDL, and HDL were observed
in the normal and DSS control groups were similar. Serum levels
of TG and TC were lower in the normal controls (92.0 ± 11.0
Fig. 1. Effects of NRM on body weights of mice treated with HFD (45%) and/or DSS. Norm.: normal control mice; HFD: mice treated with a high-fat diet (HFD, 45%);
DSS: mice treated with DSS (2%) and a normal diet; HFD+DSS: mice treated with HFD and DSS; HFD+DSS+NL: mice treated with HFD and DSS with 30% NRM in diet;
HFD+DSS+NH: mice treated with HFD and DSS with 70% NRM in diet. Results are presented as mean ± SD. Superscript with different letters on 8th week are significantly
different (p < 0.05) based on Duncan’s multiple range test. Groups1) Levels (ng/ml)
Insulin Leptin Adiponectin
Norm. 2.3 ± 0.3c2) 2.4 ± 0.4d 9.6 ± 0.3a
HFD 7.6 ± 1.6a 30.9 ± 0.7a 3.6 ± 0.1e
DSS 2.3 ± 0.6c 3.1 ± 0.5d 8.9 ± 0.9b
HFD+DSS 6.7 ± 0.6a 24.5 ± 1.5b 4.1 ± 0.3e
HFD+DSS+NL 4.1 ± 0.7b 23.7 ± 0.8b 5.0 ± 0.5d HFD+DSS+NH 3.6 ± 0.4b 19.6 ± 1.8c 5.9 ± 0.2c
1)DSS. Norm.: normal control mice; HFD: mice treated with a high-fat diet (HFD, 45%); DSS: mice treated with DSS (2%) and a normal diet; HFD+DSS: mice treated with HFD and DSS; HFD+DSS+NL: mice treated with HFD and DSS with 30% NRM in diet; HFD+DSS+NH: mice treated with HFD and DSS with 70%
NRM in diet.
2)Results are presented as mean ± SD.Superscript with different letters in each column are significantly different (P< 0.05) by Duncan’s multiple range test.
Table 4. Effect of NRM on serum insulin, leptin, and adiponectin levels in HFD (45%) and/or DSS-treated mice
Groups1) Blood biochemical indexes (mg/dl)
TG TC LDL HDL
Norm. 92.0 ± 11.0d2) 143.7 ± 6.0d 36.4 ± 7.1e 88.9 ± 3.3a HFD 217.1 ± 20.3a 270.7 ± 27.8ab 177.0 ± 30.5ab 50.4 ± 5.1d DSS 91.2 ± 8.6d 144.6 ± 1.9a 35.4 ± 6.7e 90.9 ± 6.1a HFD+DSS 208.2 ± 27.0a 267.8 ± 31.7ab 173.9 ± 25.0ab 52.3 ± 3.4d HFD+DSS+NL 184.6 ± 22.2abc 247.5 ± 8.6bc 143.1 ± 10.1cd 67.5 ± 10.2bc HFD+DSS+NH 169.1 ± 18.4bc 225.2 ± 7.3c 120.0 ± 3.5d 71.4 ± 6.9b
1)DSS. Norm.: normal control mice; HFD: mice treated with a high-fat diet (HFD, 45%); DSS: mice treated with DSS (2%) and a normal diet; HFD+DSS: mice treated with HFD and DSS; HFD+DSS+NL: mice treated with HFD and DSS with 30% NRM in diet; HFD+DSS+NH: mice treated with HFD and DSS with 70%
NRM in diet.
2)Results are presented as mean ± SD.Superscript with different letters in each column are significantly different (P< 0.05) by Duncan’s multiple range test.
Table 3. Effect of NRM on blood chemical indexes (TG, TC, LDL, and HDL) in HFD (45%) and/or DSS-treated mice
mg/dl for TG and 143.7 ± 6.0 mg/dl for TC) than in HFD-treated mice (217.1 ± 20.3 mg/dl for TG and 270.7 ± 27.8 mg/dl for TC;
Table 3). DSS reduced serum TG and TC levels to 91.2 ± 8.6 mg/dl and 144.6 ± 1.9 mg/dl, respectively, but these concen- trations were not significantly lower than in normal controls.
In the HFD+DSS group, serum levels of TG and TC were 208.2
± 27.0 mg/dl and 267.8 ± 31.7 mg/dl, respectively, similar to those in the HFD group. Following treatment with low- or high- NRM, NRM reduced TG levels to 184.6 ± 22.2 mg/dl and 169.1
± 18.4 mg/dl, respectively, and TC levels to 247.5 ± 8.6 mg/dl and 225.2 ± 7.3 mg/dl, respectively, versus the HFD+DSS group (P < 0.05).
Serum LDL level was lower in normal controls (36.4 ± 7.1 mg/dl) than in the HFD group (177.0 ± 30.5 mg/dl; P < 0.05), but non-significantly higher than in DSS controls (35.4 ± 6.7 mg/ml). In the HFD+DSS group, serum LDL (173.9 ± 25.0 mg/dl) was similar to that in the HFD group. Treatment with low- and high- NRM decreased the LDL level to 143.1 ± 10.1 mg/dl and 120.0 ± 3.5 mg/dl compared with HFD+DSS, respectively.
Serum HDL level was higher in normal controls (88.9 ± 3.3 mg/dl) than in the HFD group (50.4 ± 5.1 mg/dl). Serum level of HDL in DSS controls was 90.9 ± 6.1 mg/dl, similar to that found in normal mice (88.9 ± 3.3 mg/dl). In the HFD+DSS group, mean HDL serum level (52.3 ± 3.4 mg/dl) was similar to that observed in the HFD group (50.4 ± 5.1 mg/dl). Following treatment with low- or high- NRM, serum levels of HDL were higher (67.5 ± 10.2 mg/dl and 71.4 ± 6.9 mg/dl, respectively) in the HFD group than that in the HFD+DSS group (52.3 ± 3.4 mg/dl). High NRM treatment effectively decreased elevations in the serum levels of TG, TC, and LDL and increased HDL levels caused by HFD or HFD+DSS.
Serum levels of insulin, leptin, and adiponectin
Serum level of insulin was lower in normal controls (2.3 ± 0.3 ng/ml) than in the HFD group (7.6 ± 1.6 ng/ml), but DSS did not influence serum levels (Table 4). Serum insulin (6.7 ± 0.6
ng/ml) in the HFD+DSS group was similar to that in the HFD group. NRM treatment significantly reduced serum insulin elevations versus the HFD+DSS group to 4.1 ± 0.7 ng/ml (low NRM) and 3.6 ± 0.4 ng/ml (high NRM), respectively (P < 0.05).
Serum level of leptin was lower in normal controls (2.4 ± 0.4 ng/ml) than in the HFD group (30.9 ± 0.7 ng/ml). However, DSS treatment increased serum leptin levels non-significantly to 3.1
± 0.5 ng/ml versus normal controls. In the HFD+DSS group, mean serum leptin (24.5 ± 1.5 ng/ml) was similar to that observed in the HFD group. NRM treatment significantly decreased serum leptin elevation by HFD+DSS to 23.7 ± 0.8 ng/ml (low NRM) and 19.6 ± 1.8 ng/ml (high NRM) (P < 0.05).
Serum level of adiponectin was higher in normal controls (9.6
± 0.3 ng/ml) than in the HFD group (3.6 ± 0.1 ng/ml). However, DSS treatment did not affect serum adiponectin level (8.9 ± 0.9 ng/ml). In the HFD+DSS group mean serum adiponectin level (4.1 ± 0.3 ng/ml) was similar to that observed in the HFD group.
NRM treatment resulted in significantly increased serum adiponectin levels by HFD+DSS to 5.0 ± 0.5 ng/ml (low NRM) and 5.9 ± 0.2 ng/ml (high NRM) (P < 0.05).
Effect of NRM on colon length and colon weight-to-length ratio in C57BL/6J mice
Colon length and weight-to-length ratio are used as markers
Fig. 2. Effects of NRM on colon length and colon weight-to-length ratio in HFD (45%) and/or DSS-treated mice. Norm.: normal control mice; HFD: mice treated with a high-fat diet (HFD, 45%); DSS: mice treated with DSS (2%) and a normal diet; HFD+DSS: mice treated with HFD and DSS; HFD+DSS+NL: mice treated with HFD and DSS with 30%
NRM in diet; HFD+DSS+NH: mice treated with HFD and DSS with 70% NRM in diet. Superscriptwith different letters on the bars are significantly different (P< 0.05) by Duncan's multiple range test.
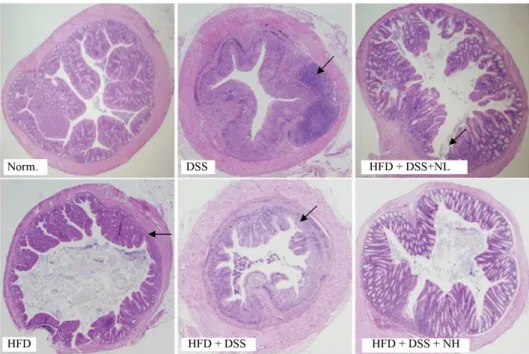
Fig. 3. Histological observations of colon tissue damage in mice treated with NRM, HFD (45%), and/or DSS The arrow (→) indicates specific points of inflammation.
Norm.: normal control mice; HFD: treated with a high-fat diet (HFD, 45%); DSS: mice treated with DSS (2%) and a normal diet; HFD+DSS: mice treated with HFD and DSS; HFD+DSS+NL:
mice treated with HFD and DSS with 30% NRM in diet; HFD+DSS+NH: mice treated with HFD and DSS with 70% NRM in diet.
of the degree of colitis (Fig. 2). Shorter colon length was observed in the HFD group (6.7 ± 0.4 cm) and DSS group (5.1
± 0.4 cm) than in the Normal group (7.7 ± 0.4 cm). Mean colon length (4.8 ± 0.4 cm) was lower in the HFD+DSS group than in the HFD and DSS groups. In particular, colon length was shorter in the HFD+DSS group than in the DSS-treated group.
However, low and high NRM treatment significantly increased colon shortening in the HFD+DSS group to 6.1 ± 0.5 cm and 6.7 ± 0.8 cm, respectively (P < 0.05).
Colon weight-to-length ratio was lower in normal controls (20.7 ± 4.4 mg/cm) than in the HFD (35.2 ± 2.8 mg/cm) and DSS (65.3 ± 6.1 mg/cm) groups. Colon weight-to-length ratio was greatest in the HFD+DSS group (72.4 ± 13.9 mg/cm). However, low and high NRM treatment significantly reduced this colon weight-to-length ratio increase (40.4 ± 4.9 and 32.9 ± 7.7
mg/cm, respectively) (P < 0.05).
Histological observations of colonic tissues
Overall inflammation was observed in the HFD group and
DSS groups. The HFD group showed slight pre-inflammatory
condition, whereas the DSS group showed a prominent
inflammatory condition, compared with the normal group. In
addition, mucus of the HFD+DSS group showed deterioration
in inflammation versus the normal group. Low- and high density
NRM treatment reduced inflammatory reactions. Low density
NRM inhibited inflammation compared with the HFD+DSS
group, whereas the suppression of inflammation achieved by
high NRM treatment was similar to that observed in the normal
group (Fig. 3).
Fig. 4. Effect of NRM on the serum levels of TNF-α, IL-1β, and IL-6 in HFD (45%) and/or DSS-treated mice. Norm.: normal control mice; HFD: mice treated with a high-fat diet (HFD, 45%); DSS: mice treated with DSS (2%) and a normal diet; HFD+DSS: mice treated with HFD and DSS; HFD+DSS+NL: mice treated with HFD and DSS with 30% NRM in diet; HFD+DSS+NH: mice treated with HFD and DSS with 70% NRM in diet. Superscript with different letters on the bars are significantly different (P< 0.05) by Duncan's multiple range test.
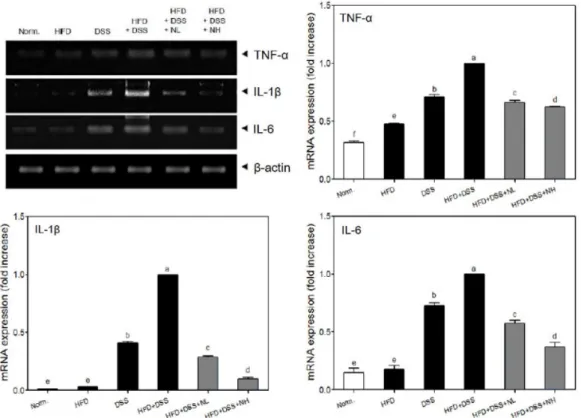
Fig. 5. Effect of NRM on the mRNA levels of TNF-α, IL-1β, and IL-6 of HFD (45%) and/or DSS-treated mice. Norm.: normal control mice; HFD: mice treated with a high-fat diet (HFD, 45%); DSS: mice treated with DSS (2%) and a normal diet; HFD+DSS: mice treated with HFD and DSS; HFD+DSS+NL: mice treated with HFD and DSS with 30% NRM in diet; HFD+DSS+NH: mice treated with HFD and DSS with 70% NRM in diet. Band intensities were measured using a densitometer and are expressed as folds of the control (HFD+DSS treated groups). Fold ratio: Gene expression / β-actin × control numerical value (Control fold ratio = 1). Superscript with different letters on the bars are significantly different (P< 0.05) by Duncan's multiple range test.
Serum levels of pro-inflammatory cytokines
The effects of NRM on serum levels of TNF-α, IL-1β, and IL-6 were evaluated by ELISA assay. As shown in Fig. 4, the serum level of TNF-α was lower in normal controls (117.0 ± 4.5 pg/ml) than in the HFD group (152.1 ± 12.5 pg/ml). DSS treatment increased the serum TNF-α level to 233.1 ± 18.9 pg/ml, and the highest serum level of TNF-α was observed in the HFD+DSS group (247.4 ± 6.3 pg/ml). However, high NRM treatment significantly decreased the increase observed in the HFD+DSS group to 150.4 ± 15.2 pg/ml (P < 0.05).
Serum level of IL-1β was lower in normal controls (30.6 ± 14.4 pg/ml) than in the HFD group (42.7 ± 5.1 pg/ml). DSS treatment
increased serum IL-1β to 89.8 ± 13.5 pg/ml versus normal controls. Serum IL-1β (101.5 ± 13.4 pg/ml) was highest in the HFD+DSS group. However, high NRM treatment significantly decreased the increase in serum IL-1β observed in the HFD+DSS group to 60.2 ± 13.8 pg/ml (P < 0.05).
Serum level of IL-6 in normal controls (81.3 ± 22.2 pg/ml) was
lower than that in the HFD group (110.0 ± 6.7 pg/ml). DSS
treatment increased mean serum IL-6 to 256.5 ± 27.0 pg/ml. The
highest serum level of IL-6 (285.2 ± 24.9 pg/ml) was observed
in the HFD+DSS group. High NRM treatment significantly
reduced this HFD+DSS-induced increase in IL-6 serum level to
206.9 ± 19.0 pg/ml (P < 0.05).
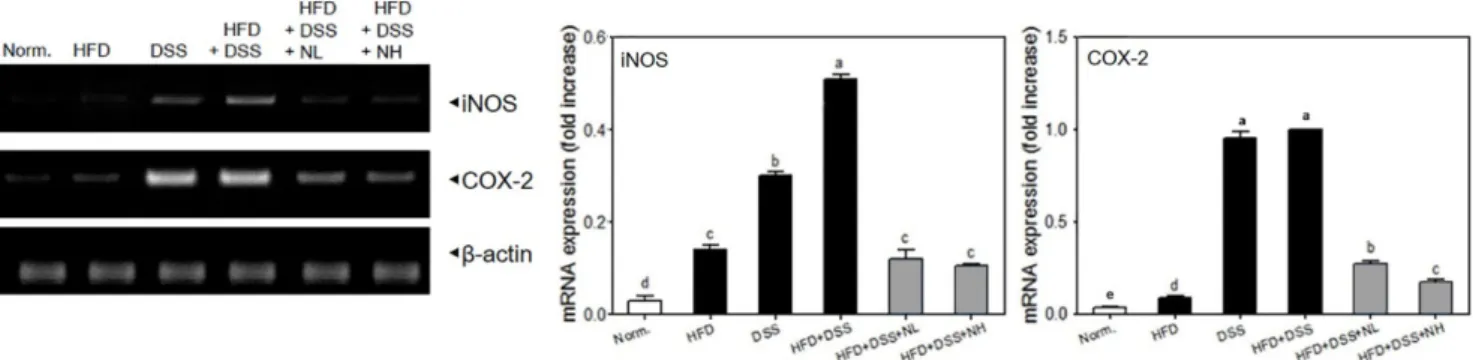
Fig. 6. Effect of NRM on the mRNA levels of iNOS and COX-2 in the colon tissues of HFD (45%) and/or DSS-treated mice. Norm.: normal control mice; HFD: mice treated with a high-fat diet (HFD, 45%); DSS: mice treated with DSS (2%) and a normal diet; HFD+DSS: mice treated with HFD and DSS; HFD+DSS+NL: mice treated with HFD and DSS with 30% NRM in diet; HFD+DSS+NH: mice treated with HFD and DSS with 70% NRM in diet. Band intensities were measured using a densitometer and are expressed as folds of control (HFD+DSS treated groups). Fold ratio: Gene expression / β-actin × control numerical value (Control fold ratio = 1). Superscript with different letters on the bars are significantly different (P< 0.05) by Duncan's multiple range test.
Colonic mRNA levels of pro-inflammatory cytokines
As shown in Fig. 5, TNF-α mRNA level was lower in normal controls (0.32) than in the HFD group (0.48). DSS treatment increased the TNF-α mRNA to 0.71. TNF-α mRNA levels were highest in the HFD+DSS group (1.00). However, high NRM treatment significantly decreased the overexpressed TNF-α mRNA to 0.62 (P < 0.05). IL-1β mRNA levels were highest in the HFD+DSS group (1.00). DSS treatment increased mean IL-1β mRNA to 0.41. However, high NRM treatment significantly decreased the IL-1β mRNA overexpression (P < 0.05). IL-6 mRNA level was lower in normal controls (0.15) than in the HFD-treated group (0.18). DSS treatment increased mean IL-6 mRNA to 0.73.
IL-6 mRNA levels were highest in the HFD+DSS group (1.00).
However, high NRM treatment significantly reduced the IL-6 mRNA levels to 0.37 (P < 0.05).
mRNA levels of inflammation-related enzymes in colonic mucosa Significantly higher iNOS and COX-2 mRNA expression was observed in the colonic mucosa in the HFD and DSS groups than in normal controls (P < 0.05, Fig. 6), and these expressions were highest in the HFD+DSS group. However, Low- or high NRM treatment significantly reduced the increases observed in the HFD+DSS group (P < 0.05).
DISCUSSION
NRM, American-style Saengshik, is a non-cooked health food prepared from whole grains, vegetables, and berry fruits.
Furthermore, NRM contains a mixture of phytochemicals including anthocyanin, phytosterols, gamma-oryzanol, RS, and dietary fiber which synergistically enhance health benefits [10, 24, 27].
In this study, we found that NRM showed activity against HFD- and DSS-induced colitis in C57BL/6J mice. HFD treatment resulted in significantly increased body weight and obesity- related biomarkers, whereas DSS treatment resulted in decreased body weight and did not affect obesity-related biomarkers. In addition, NRM supplementation decreased HFD-induced body weight gain in HFD+DSS-treated mice, and reduced the weight loss caused by DSS treatment. In addition, high levels of NRM maintained body weight in HFD and DSS treated mice at normal levels, and high and low levels of NRM
reduced increase in TG, TC, and LDL levels and reductions in HDL levels in HFD+DSS treated mice. These results are similar to the improvements in obesity-related biomarkers reported for Saengshik [6]
,a health food with anti-obesity effects in women [7]. As a main ingredient in NRM, brown rice contains high levels of RS and is recognized as a low glycemic index food [28]
,and low glycemic index foods have been reported to increase insulin sensitivity and improve insulin resistance [29]. In mice, reduc- tions in serum insulin are associated with insulin resistance- induced chronic inflammation [30], and recent studies have shown that leptin is not only pro-inflammatory but also antiapoptotic enough to cause advancement of colitis to a cancerous status [31]. Increase in adiponectin level to reduce inflammatory response in women has also been reported [32].
In the current study, we found that NRM treatment resulted in significantly decreased serum levels of leptin and insulin, and increased serum levels of adiponectin in HFD+DSS-treated mice.
In general, colon length and colon weight-to-length ratio
provides a useful index for evaluation of the inflammatory status
in a colitis model [33]. Based on our observations, 8 weeks of
45% HFD administration resulted in significantly shortened
colon lengths and increased colon weight-to-length ratios in
mice, whereas co-treatment with HFD and 2% DSS resulted in
significantly decreased colon lengths and increased colon
weight-to-length ratios versus DSS- or HFD-treated mice. In
contrast, NRM treatment significantly suppressed colon length
shortening, decreased colon weight-to-length ratios, and
protected colons from cell damage induced by exposure to HFD
and/or DSS. In histological study, we found that HFD and/or
DSS treatment induced colitis inflammatory condition in mice,
while co-administration of NRM suppressed such progression
of colitis. In addition, HFD significantly increased the expression
of pro- inflammatory cytokines associated with colitis, and DSS
induced these cytokines to greater extents [23]. In the current
study, the HFD+DSS group showed enhanced serum TNF-α, IL-1
β, and IL-6 levels, and treatment with NRM prevented these
increases in mice treated with HFD and/or DSS. In addition,
treatment with a high level of NRM decreased the mRNA levels
of TNF-α, IL-1β, and IL-6 in colon tissues. Overexpression of
proinflammatory cytokines (TNF-α, IL-1β, IL-6 and IL-8) is known
to occur in the intestinal mucosa of IBD patients [18].
High intake of whole grains, vegetables, and fruits, which contain high levels of antioxidants, dietary fiber, and functional phytochemicals, might have a chemopreventive effect on colorectal diseases [34-37]. In particular, functional phytochemicals in brown rice suppress the DSS-induced expression of TNF-α and IL-6 mRNA [35]
.Similarly, the dietary fiber and polyphenols in millet also suppress the production of these pro-inflammatory cytokines [36] and fruits and vegetables have been reported to significantly decrease the serum levels of some inflammatory markers, including TNF-α and IL-1β [34]. Berries, which are enriched in anthocyanins, have anti-inflammatory effects as demonstrated by their ability to inhibit expressions of pro-inflammatory genes, such as TNF-α and IL-1β [25]. All of the compounds referred to above are present in NRM, and thus, probably contributed to the improvements in colonic conditions observed in this study.
iNOS and COX-2 are involved in early inflammatory reactions [38]. We found that the mRNA expressions of iNOS and COX-2 were significantly increased in the colonic mucosa of DSS controls. mRNA expressions of iNOS and COX-2 were higher in the HFD+DSS group than those in DSS controls. HFD+DSS induced the highest levels of these pro-inflammatory cytokines (TNF-α, IL-1β, and IL-6) in serum and colon tissues. However, low- or high NRM treatment significantly decreased the increases in the mRNA expressions of iNOS and COX-2 observed in HFD+DSS treated mice. Accordingly, our results suggest that high levels of NRM in the diet could contribute to prevention of colitis.
Berries contain high levels of anthocyanins such as cyanidin-3- glucoside and malvidin-3-glucoside, which reduce NO generation in RAW 264.7 mouse macrophages and suppress iNOS and COX-2 expression in endothelial cells [25, 39]. In addition, the high dietary fiber and polyphenol levels in millet also suppress COX-2 and iNOS activation [37]. Dietary fiber prevents feces from remaining in the colon for protracted times in contact with gastrointestinal mucosa, and thus reduces colon inflam- mation [40]. In addition, as a main ingredient in NRM, brown rice contains high levels of RS, which has been shown to increase fecal bulking and production of short-chain fatty acids to reduce fecal pH and produce high levels of butyric acid, one of the main energy substrates of large intestinal epithelial cells and has been reported to reduce the carcinogenesis of intestinal cells [41]. RS has also been shown to promote the growth of probiotics (such as lactic acid bacteria and bifido- bacteria), which are essential for maintenance of the intestinal microbial environment and prevention of colonic disease [42].
Thus, RS in NRM might ameliorate colitis. We also observed that other health promoting materials might synergistically reduce HFD and DSS-induced colitis.
In conclusion, NRM treatment suppressed HFD-induced body weight gain and DSS-induced body weight loss. High levels of NRM maintained body weights in HFD+DSS-treated mice to near the normal treatment level. NRM showed anti-obesity effects by modulating serum lipid profiles (TG, TC, LDL, and HDL), serum insulin and leptin levels, and by increasing adiponectin in HFD- and DSS-treated mice. High levels of NRM prevented colon shortening and colon weight-to-length ratio gains in HFD- and/or DSS-treated mice. In addition, NRM
reduced the infiltration of inflammatory cells and suppressed mucosal injury in the colon tissues of HFD and/or DSS-treated mice by modulating pro-inflammatory cytokine (TNF-α, IL-1β, IL-6) levels in serum and colon tissues and by reducing the expressions of inflammatory iNOS and COX-2. These results suggest that NRM might have a significant inhibitory effect in obesity and DSS-induced inflammation-associated colitis mice.
As NRM is a mixture of multiple food ingredients, however, no single ingredient can account for the efficacy of NRM; such efficacy might be due to increased bioactive compounds from the ingredients and/or synergistic effect of each ingredient in NRM. Thus, further studies are required to determine the mechanism whereby NRM prevents the inflammation associated with colitis and to optimize levels of ingredients in NRM with respect to efficacy.
REFERENCES
1. Song M, Kim H, Suh H. Analysis of Korea national plant used on temple food. J Korean Soc Jungshin Sci 2005;9:1-16.
2. Lee JR. A study on Buddhist monk's dietary life in relation to the contemporary culture of well-being. J Indian Philos 2013;38:57-79.
3. Chung SS, Jan YS. Consumer's recognition, nutrient composition, and safety evaluation of commercial Sunsik and Saengsik. Korean J Food Cult 2003;18:235-43.
4. Kim HY, Kim JH, Lee SA, Chang HE, Park MH, Hwang SJ, Lee JY, Mok C, Hong SG. Saengshik, a formulated health food, prevents liver damage in CCl4-induced mice and increases antioxidant activity in elderly women. J Med Food 2008;11:323-30.
5. Kim M, Kim ES, Park MH, Hwang SJ, Jeong Y. Saengshik, a formulated health food, decreases blood glucose and increases survival rate in streptozotocin-induced diabetic rats. J Med Food 2004;7:162-7.
6. Kang SM, Shim JY, Hwang SJ, Hong S, Jang HE, Park MH. Effects of Saengshik supplementation on health improvement in diet-induced hypercholesterolemic rats. J Korean Soc Food Sci Nutr 2003;32:
906-12.
7. Ha TY, Kim NY. The effects of uncooked grains and vegetables with mainly brown rice on weight control and serum components in Korean overweight/obese female. Korean J Nutr 2003;36:183-90.
8. Song MK, Hong SG, Hwang SJ, Park OJ, Park MH. Improve effects of Saengshik on patient with fatty liver and hyperlipidemia in murine. Korean J Nutr 2003;36:834-40.
9. Lim BO, Jeong YJ, Park MH, Kim JD, Hwang SJ, Yu BP. Immun- oregulatory effects of Saengshik on DSS-induced inflammatory bowel disease in mouse model system. J Korean Soc Food Sci Nutr 2007;36:32-42.
10. Lee YJ, Lee HM, Park TS. Effects of uncooked powdered food on antioxidative system and serum mineral concentrations in rats fed unbalanced diet. Korean J Nutr 2003;36:898-907.
11. Oh YJ, Kim JM, Song SW, Ha HC, Kim HS. Protective effect of Saengshik supplementation on lead induced toxicity in rats. J Korean Soc Food Sci Nutr 2005;34:959-67.
12. Klemans RJ, Knol EF, Michelsen-Huisman A, Pasmans SG, de Kruijf-Broekman W, Bruijnzeel-Koomen CA, van Hoffen E, Knulst AC.
Components in soy allergy diagnostics: Gly m 2S albumin has the best diagnostic value in adults. Allergy 2013;68:1396-402.
13. Abu-Abid S, Szold A, Klausner J. Obesity and cancer. J Med
2002;33:73-86.
14. Gaesser GA. Carbohydrate quantity and quality in relation to body mass index. J Am Diet Assoc 2007;107:1768-80.
15. Flegal KM, Carroll MD, Kit BK, Ogden CL. Prevalence of obesity and trends in the distribution of body mass index among US adults, 1999-2010. JAMA 2012;307:491-7.
16. Larsson SC, Wolk A. Obesity and colon and rectal cancer risk: a meta-analysis of prospective studies. Am J Clin Nutr 2007;86:556-65.
17. Nishimura S, Manabe I, Nagasaki M, Eto K, Yamashita H, Ohsugi M, Otsu M, Hara K, Ueki K, Sugiura S, Yoshimura K, Kadowaki T, Nagai R. CD8+ effector T cells contribute to macrophage recruitment and adipose tissue inflammation in obesity. Nat Med 2009;15:
914-20.
18. Baumgart DC, Carding SR. Inflammatory bowel disease: cause and immunobiology. Lancet 2007;369:1627-40.
19. Batra A, Okur B, Glauben R, Erben U, Ihbe J, Stroh T, Fedke I, Chang HD, Zeitz M, Siegmund B. Leptin: a critical regulator of CD4+ T-cell polarization in vitro and in vivo. Endocrinology 2010;151:56-62.
20. Abraham C, Cho JH. Inflammatory bowel disease. N Engl J Med 2009;361:2066-78.
21. Rovedatti L, Kudo T, Biancheri P, Sarra M, Knowles CH, Rampton DS, Corazza GR, Monteleone G, Di Sabatino A, Macdonald TT.
Differential regulation of interleukin 17 and interferon gamma production in inflammatory bowel disease. Gut 2009;58:1629-36.
22. Mudter J, Neurath MF. IL-6 signaling in inflammatory bowel disease:
pathophysiological role and clinical relevance. Inflamm Bowel Dis 2007;13:1016-23.
23. Teixeira LG, Leonel AJ, Aguilar EC, Batista NV, Alves AC, Coimbra CC, Ferreira AV, de Faria AM, Cara DC, Alvarez Leite JI. The combination of high-fat diet-induced obesity and chronic ulcerative colitis reciprocally exacerbates adipose tissue and colon inflammation.
Lipids Health Dis 2011;10:204.
24. Park J, Yang M, Jun HS, Lee JH, Bae HK, Park T. Effect of raw brown rice and Job’s tear supplemented diet on serum and hepatic lipid concentrations, antioxidative system, and immune function of rats.
J Korean Soc Food Sci Nutr 2003;32:197-206.
25. Lee SG, Kim B, Yang Y, Pham TX, Park YK, Manatou J, Koo SI, Chun OK, Lee JY. Berry anthocyanins suppress the expression and secre- tion of proinflammatory mediators in macrophages by inhibiting nuclear translocation of NF-κB independent of NRF2-mediated mechanism. J Nutr Biochem 2014;25:404-411.
26. Perše M, Cerar A. Dextran sodium sulphate colitis mouse model:
traps and tricks. J Biomed Biotechnol 2012;2012:718617.
27. Liu RH. Health benefits of fruit and vegetables are from additive and synergistic combinations of phytochemicals. Am J Clin Nutr 2003;78:517S-520S.
28. Raigond B. Resistant starch in food: a review. J Sci Food Agric
2015;95:1968-1978.
29. Jenkins DJ, Kendall CW, Augustin LS, Franceschi S, Hamidi M, Marchie A, Jenkins AL, Axelsen M. Glycemic index: overview of implications in health and disease. Am J Clin Nutr 2002;76:266S- 273S.
30. Ridker PM, Hennekens CH, Buring JE, Rifai N. C-reactive protein and other markers of inflammation in the prediction of cardiovascular disease in women. N Engl J Med 2000;342:836-43.
31. Bartucci M, Svensson S, Ricci-Vitiani L, Dattilo R, Biffoni M, Signore M, Ferla R, De Maria R, Surmacz E. Obesity hormone leptin induces growth and interferes with the cytotoxic effects of 5-fluorouracil in colorectal tumor stem cells. Endocr Relat Cancer 2010;17:823-33.
32. Engeli S, Feldpausch M, Gorzelniak K, Hartwig F, Heintze U, Janke J, Möhlig M, Pfeiffer AF, Luft FC, Sharma AM. Association between adiponectin and mediators of inflammation in obese women.
Diabetes 2003;52:942-7.
33. Vowinkel T, Kalogeris TJ, Mori M, Krieglstein CF, Granger DN. Impact of dextran sulfate sodium load on the severity of inflammation in experimental colitis. Dig Dis Sci 2004;49:556-64.
34. Steinmetz KA, Potter JD. Vegetables, fruit, and cancer prevention:
a review. J Am Diet Assoc 1996;96:1027-39.
35. Park DK, Park HJ. Ethanol extract of Antrodia camphorata grown on germinated brown rice suppresses inflammatory responses in mice with acute DSS-induced colitis. Evid Based Complement Alternat Med 2013;2013:914524.
36. Park MY, Kim JH, Park DS. Anti-inflammatory activities of hog millet (Panicum miliaceum L.) in murine macrophages through IRAK-4 signaling. Korean J Food Nutr 2011;24:268-72.
37. Holt EM, Steffen LM, Moran A, Basu S, Steinberger J, Ross JA, Hong CP, Sinaiko AR. Fruit and vegetable consumption and its relation to markers of inflammation and oxidative stress in adolescents. J Am Diet Assoc 2009;109:414-21.
38. Watanabe K, Kawamori T, Nakatsugi S, Wakabayashi K. COX-2 and iNOS, good targets for chemoprevention of colon cancer. Biofactors 2000;12:129-33.
39. Paixão J, Dinis TC, Almeida LM. Malvidin-3-glucoside protects endothelial cells up-regulating endothelial NO synthase and inhibiting peroxynitrite-induced NF-kB activation. Chem Biol Interact 2012;
199:192-200.
40. Stephen AM, Cummings JH. Mechanism of action of dietary fibre in the human colon. Nature 1980;284:283-4.
41. Ferguson LR, Tasman-Jones C, Englyst H, Harris PJ. Comparative effects of three resistant starch preparations on transit time and short-chain fatty acid production in rats. Nutr Cancer 2000;36:230-7.
42. Sajilata MG, Singhal RS, Kulkarni PR. Resistant starch - a review.
Compr Rev Food Sci Food Saf 2006;5:1-17.