J F E S
Journal of Forest and Environmental Science
Journal of Forest and Environmental Science Vol. 31, No. 3, pp. 207-213, August, 2015 http://dx.doi.org/10.7747/JFES.2015.31.3.207
Valuation of Forest Habitat Functions of Endangered Mammals Using Species Distribution Model
Jung Teak Kim1, Jaeuk Kim2, Woo-Kyun Lee3, Seong Woo Jeon3 and Joon Soon Kim1,*
1Division of Forest Science, Kangwon National University, Chuncheon 24341, Republic of Korea
2Korea Environment Institute, Sejong 30147, Republic of Korea
3Division of Environmental Science and Ecological Engineering, Korea University, Seoul 02841, Republic of Korea
Abstract
It is estimated that there is a total of approximately 100,000 species in Korea. However, the number is currently about 30,000 and only 16,027 species are listed in the ‘Species Korea’ (as of December, 2014). Of the listed species, 51 species are designated as the Endangered Species Class I while 195 species are in the Class II, totaling 246 endangered species including 20 mammals. Under the circumstances that development (e.g., roads) is increasingly threatening the persistence of endangered mammals, it is significant to identify and preserve suitable habitats for them. In this context, evaluating the values of the suitable habitat environment would serve as essential information for development decision making.
This study estimated the values of endangered mammals’ forest habitats through spatialization of habitat services. In doing so, a species distribution model, Maximum Entropy Model (MaxEnt) was utilized for a group of endangered mammals including, mountain goat, wildcat, marten cat, and flying squirrel. To calculate the values per unit area, a benefit transfer method was used based on the point-estimate technique with the best available values estimated previously. The range of discount rate of 3.0 to 5.5 percent was applied taking the notion of social discount rate into account. As a result, the province with the highest values for endangered mammal habitats appeared to be Gangwon, followed by Gyeongbuk and Gyeongnam. The monetary values of the endangered mammal habitats were estimated to be 330 billion to 421 billion won per year.
Key Words: endangered mammals, habitat, values per unit area, benefit transfer method, social discount rate
Received: July 15, 2015. Revised: August 12, 2015. Accepted: August 12, 2015.
Corresponding author: Joon Soon Kim
Division of Forest Science, Kangwon National University, Chuncheon 24341, Republic of Korea Tel: 82-33-250-8338, Fax: 82-33-243-2901, E-mail: [email protected]
Introduction
The Korea Natural Environmental Conservation Law defines ecosystem as a dynamic complex of plants, animals and microorganism communities interacting with abiotic environments as a functional unit. Ecosystem services were defined by Daily (1997) as a status and process through ecosystems and meeting human's life by plant and animal species. While Costanza et al. (1997) described it as hu-
man's benefits directly or indirectly obtained from ecosys- tems, the Millenium Ecosystem Assessment (2005) repre- sented it as benefits from ecosystems contributing to hu- man's quality of life. Putting these concepts together, eco- system services can be defined as a status manifested in functions that provide human benefits resulting from not only biological ecosystem circulation movement in nature but non-biological existence.
The demand for value assessment has increased as part
of quantitative evaluation for rational decision making for ecosystem services. The ecosystem services valuation re- search has conducted comprehensive value evaluation along with various types and functions as described in Costanza et al. (1998) and Millenium Ecosystem Assessment (2003) (State of New Jersey 2007; Jeon et al. 2013). TEEB (2010) categorizes ecosystem services into provisioning, regulat- ing, habitat, and cultural services, where ‘habitat’ is repre- sented by a role as living space of biological organisms.1)
Approximately 1.75 million species were observed world- wide including microorganisms and most of them consists of small insect species. The number of species is estimated ranging from three million to one hundred million but gen- erally 13 million species are estimated (CBD 2000). Accor- ding to OECD (2011), it is expected that biodiversity would likely be decreasing by about 10 percent in 2030 due to climate change, pollution, and anthropogenic activities.
Furthermore, IUCN (http:www.iucn.org) announced that 80 percent of habitats of birds, mammals, and amphibians is being threatened and six million of primeval forests serv- ing as wildlife habitat have been lost since 2000. Up until now, about 48,000 species are listed in IUCN's red list.
The Aichi Target 20 established in Biological Diversity Convention suggested that 17% of terrestrial areas and 10%
of coastal and marine areas need to be extended as con- servation areas by 2020 in order to maintain and enhance biodiversity.
The number of species in Korea was estimated about 0.1 million and currently there are 30,000 species in the coun- try including 16,027 species listed in the Korea Biological Resources Portal (as of December, 2014). The endangered species include 51 species for Class I and 195 species for Class II, totaling 246 species. There are 20 endangered mammals including 11 species for Class I (e.g., Goral) and 9 species for Class II (e.g., Marten). Those 11 endangered mammals at Class I are considered in the category of the IUCN’s Red List (http:www.iucnredlist.org): five least concern (LC) species (wolf, sika deer, lynx, red bat, fox), two near threatened (NT) species (European otter, leop- ard), three vulnerable (VU) species (goat, Asiatic black bear, musk deer), and one endangered (EN) species (tiger).
1) In the evaluation of ecosystem services, we used “support” in- stead of using “habitat” for inclusive application.
Since the relatively large amount of forests have allowed multipurpose development activities, 6,120 ha of forested areas in Korea are annually in decline from 2000 to 2010.
Accordingly, wildlife habitats have been on the decrease and even the habitats of endemic species that are gaining atten- tion around the world are being threatened.
Most of the valuation research focusing on animal spe- cies calculated the conservation values using contingent valuation method (CVM) (Hegeman 1985; Samples and Hollyer 1990; Olsen et al. 1991; Stevens et al. 1991; Loomis and Larson 1994; Kotchen and Reiling 2000; Kristin and Andrew 2001; Tisdell et al. 2005). Likewise, some of the domestic research addressed habitats or wildlife in a given areas through contingent valuation method (CVM) (Youn and Jang 1994; Han and Choi 1998; Lee 2002; Yeo and Bang 2007; Yeo and Jang 2007; Han 2008; Yu and Kim 2008).
Since existing valuation research tends to yield economic values only for the existence of species in a particular area, they are hardly utilized as general information for cost esti- mation of regional development. In order to have realistic measures and financial support for habitat provision service of forest ecosystem, it is significant to make spatially differ- entiated evaluation for the entire area.
Meanwhile, the research regarding habitat field survey and prediction model have been conducted in the area of animal ecology. In Korea, field survey for a particular spe- cies began in earnest around 2000 (Han 1998; Yang 1999;
Son 2000; Cha 2001), which made a basis for further re- search on species distribution model (Choi 2002; Joo 2002;
Lee and Song 2008; Kwon et al. 2012). Seo et al. (2008) found that Artificial Neural Network is the most appro- priate by comparing and analyzing four models of GLM (Generalized Linear Model), GAM (Generalized Addic- tive Model), CART (Classification and Regression Tree), and ANN (Artificial Neural Network). Kim et al. (2012) indicated that Maxent (Maximum Entropy Model) has advantages compared to GAM (Generalized Additive Model) from a comprehensive perspective.
The goal of this study is to estimate the area-based values of forest ecosystem endangered mammals using species dis- tribution model.
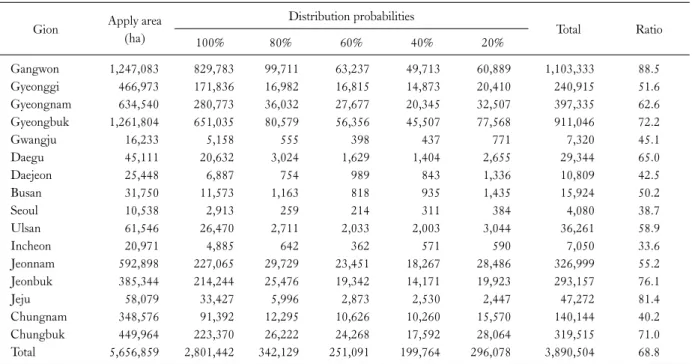
Table 1. Distribution probabilities endangered mammals in the forest Gion Apply area
(ha)
Distribution probabilities
Total Ratio
100% 80% 60% 40% 20%
Gangwon 1,247,083 829,783 99,711 63,237 49,713 60,889 1,103,333 88.5
Gyeonggi 466,973 171,836 16,982 16,815 14,873 20,410 240,915 51.6
Gyeongnam 634,540 280,773 36,032 27,677 20,345 32,507 397,335 62.6
Gyeongbuk 1,261,804 651,035 80,579 56,356 45,507 77,568 911,046 72.2
Gwangju 16,233 5,158 555 398 437 771 7,320 45.1
Daegu 45,111 20,632 3,024 1,629 1,404 2,655 29,344 65.0
Daejeon 25,448 6,887 754 989 843 1,336 10,809 42.5
Busan 31,750 11,573 1,163 818 935 1,435 15,924 50.2
Seoul 10,538 2,913 259 214 311 384 4,080 38.7
Ulsan 61,546 26,470 2,711 2,033 2,003 3,044 36,261 58.9
Incheon 20,971 4,885 642 362 571 590 7,050 33.6
Jeonnam 592,898 227,065 29,729 23,451 18,267 28,486 326,999 55.2
Jeonbuk 385,344 214,244 25,476 19,342 14,171 19,923 293,157 76.1
Jeju 58,079 33,427 5,996 2,873 2,530 2,447 47,272 81.4
Chungnam 348,576 91,392 12,295 10,626 10,260 15,570 140,144 40.2
Chungbuk 449,964 223,370 26,222 24,268 17,592 28,064 319,515 71.0
Total 5,656,859 2,801,442 342,129 251,091 199,764 296,078 3,890,504 68.8
Materials and Methods
Species distribution probability was developed based on the third National Ecological Survey data and using the es- timated outcomes from Maxent (Jeon et al. 2014) based on topography, land cover, and forest type. The point-estimate technique, one of the benefit transfer method was applied for the values for endangered mammal species.
Previous literature focused on habitat valuation using the benefit transfer for endangered mammal species includes a research that estimates unit values (won/year/household) of maximum willingness to pay per average household for Asiatic black bears in Jirisan National Park (Han and Choi 1998) and mountain goats inhabited in Woraksan National Park (Han 2008). The values were generalized based on the premise that the target species of mountain goats and Asiatic black bears would likely to be considered nationally significant endangered mammals rather than the conser- vation values of a particular species to the general survey respondents.
In the cost-benefit analysis for large-scale national proj- ect, it is common to use the discount rate of 5.5% (KDI, 2008). However, Kim (2013) asserts that the proper social discount rate should be 2.9-4.9%. With a baseline of 2014,
this study conducted the cost-benefit analysis with a mini- mum discount rate of 3.0% and a maximum rate of 5.5%
which is common in national public work investment analysis. The values (won/year/household) from previous research were converted to areal unit values (won/year/ha) using the discount rate and the number of households.
⋅ ⋅
: unit area value (won/year/ha) in year
: unit area value (won/year/household) in year
: discount rate
: evaluation year
: baseline year
: number of households in year ts
: distribution probability
: forest area (ha) with 100% of distribution proba- bility
Results
As a result of overlaying Land Cover revised in 2009 with the fourth Forest Type map, the forested areas are
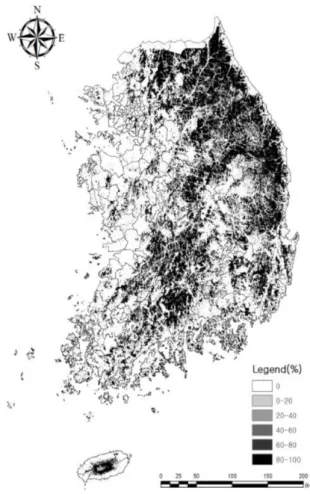
Fig. 1. Distribution probabilities of endangered mammals.
5,657 thousand ha.2) As a species distribution probability method, Maxent model analyzed presence (1) versus non- presence (0) data with the basis of “Maximum training sen- sitivity plus specificity” values that minimizes the average of the observed values and estimated values. Target species in- clude four endangered mammal species such as mountain goats (Class I), martens (Class II), wildcats (Class II), fly- ing squirrels (Class II). To reduce uncertainty, five repeti- tive analysis was performed for each species and the proba- bility of most frequency appearance was considered to in- dicate the distribution ratios (1/5-5/5) for each area (Table 1).
The most potential region per unit area where target spe- cies would likely to be present indicated Gangwon Province (88.5%) followed by Jeju island and Gyeongbuk. Incheon appeared to have the least likelihood of the species presence.
The space where endangered mammals can inhabit (higher than 20% of distribution probability) appeared to be 68.8%
of the entire area. Nearly 50% of the entire area demon- strated 100% of distribution probability, while 10% to 20%
of the entire area showed the distribution probability rang- ing from 20% to 80%. Fig. 1 shows the estimated distri- bution map on which higher probability areas are con- centrated along the Baekdudaegan.3) Especially, the hot spots are located in Soraksan, Taebaeksan, Jirisan.
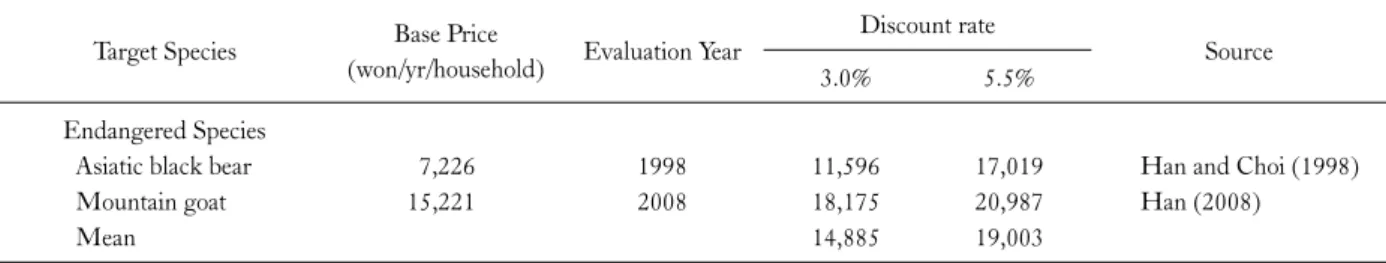
The information for per-unit values were converted into 2014 base price by applying for social discount rates with minimum 3.0% and maximum 5.5% based on previous studies focused on mountain goats and Asiatic black bears (Table 2).
Since the unit of the base price is won/year/household, we applied 18,457,628 of the estimated number of house- holds in the baseline year 2014 and converted the original values to unit area values with the assumption of 100% hab- itation probability. The total values of endangered mam-
2) This is the results of the forested areas (6,196,184 ha) in Land Cover map including coniferous, deciduous, and mixed forest superimposed on the layers of the forested and other areas (bamboo grove and unstocked land) of the Fourth Forest Type map (6,163,224 ha).
3) The Baekdudaegan is a mountain range and watershed-crest- line which runs through most of the length of the Korea Peninsula, from Baekdusan in the north to Jirisan in the south (from Wikipedia)
mals were divided by 2,801,442 ha which is 100% hab- itation probability. As a result, when habitation probability is 100% the unit-area values were 98,070 won/year/ha to 125,202 won/year/ha based on the number of households in 2014 and discount rates (3.0-5.5%). The results from the benefit transfer technique using the point estimate transfer were applied in the following equation:
The total value of habitat function for endangered mam- mal species could be estimated using the unit area value and distributed probability area as follows:
⋅⋅
: total value of habitat function (won/year)
: unit area value (won/year/ha)
Table 2. Values per unit of habitat function (in 2014) Target Species Base Price
(won/yr/household) Evaluation Year Discount rate
Source
3.0% 5.5%
Endangered Species
Asiatic black bear 7,226 1998 11,596 17,019 Han and Choi (1998)
Mountain goat 15,221 2008 18,175 20,987 Han (2008)
Mean 14,885 19,003
Table 3. Value of Endangered mammal species distribution probabilities (Unit: million ₩/yr)
Species distribution probabilities 100% 80% 60% 40% 20% Total
Apply Area (ha) 2,801,442 342,129 251,091 199,764 296,078
Discount rate
3.0% 274,737 26,842 14,775 7,836 5,807 329,998
5.5% 350,746 34,268 18,862 10,004 7,414 421,295
Table 4. Values per region of endangered mammals species Region
Total value (million won/year)
Value per area (won/year/ha)
3.0% 5.5% 3.0% 5.5%
Gangwon 96,065 122,642 77,032 98,343 Gyeonggi 20,157 25,734 43,166 55,109 Gyeongnam 33,427 42,674 52,678 67,252 Gyeongbuk 76,792 98,037 60,859 77,696
Gwangju 605 773 37,279 47,593
Daegu 2,464 3,145 54,613 69,722
Daejeon 852 1,088 33,480 42,743
Busan 1,339 1,710 42,177 53,846
Seoul 338 432 32,102 40,983
Ulsan 3,066 3,915 49,824 63,608
Incheon 585 747 27,884 35,599
Jeonnam 27,256 34,797 45,971 58,689 Jeonbuk 25,095 32,037 65,122 83,139
Jeju 4,065 5,189 69,988 89,351
Chungnam 11,261 14,376 32,305 41,242 Chungbuk 26,632 34,000 59,186 75,561 Total 329,998 421,295 58,336 74,475
: distribution possible area (ha)
: distribution probability
Based on the unit-area values and potential distribution areas, the total values of endangered mammal species were estimated as 3,300 million won (discount rate 3.0%) - 4,213
million won (discount rate 5.5%) each year (Table 3). The areas with 100% distribution probability have the values of 2,747 million won (discount rate 3.0%)-3,507 million won (discount rate 5.5%) which accounts for about 83.0% of the entire values including the rest of the probability measures.
Gangwon Province has the highest total value by regions followed by Gyeongbuk, together which accounts for 1,727 million won (3.0% discount rate)-2,207 million won (5.5%
discount rate) arriving at the half of the total values of the endangered mammals (Table 4).
In terms of the mean value per unit area which is calcu- lated the total values by region divided by forested areas, Gangwon Province was ranked top followed by Jeju island and Gyeongbuk.
Discussion
With the emergence of new analytic methods, along with the availability of various spatial data and information, anal- ysis-driven decision making has been increasingly made in related profession. Furthermore, there are growing de- mands for assessment that reflects site characteristics of study area, as the technological advancement allows more sophisticated spatial analysis for ecosystem services.
This study attempts to derive the values of the entire for- est habitat functions by generalizing the previous findings on endangered mammal species in Korea. In order to de-
cide the suitability of habitat functions depending on spatial properties, we utilized the outcomes of distribution proba- bility and thus derived spatially differentiated values.
The most likely habitable region for endangered mam- mals per unit area appeared to be Gangwon Province, fol- lowed by Jeju Island and Gyeongbuk Province. Overall, the Baekdudaegan and surrounding areas have higher po- tential for these species. The total value of the entire endan- gered mammal species in Korea was estimated as 421,300 million KRW at a given discount rate of 5.5%. The per-area mean values of endangered mammal species for the entire forest in Korea indicated 66,000 won/ha each year.
There are a total of 246 endangered species including the 20 endangered mammals considered in this study. This study has a limitation that the value estimation was only based on the endangered mammals and thus the monetary values do not represent the values of the entire potential habitats. Furthermore, there might be different views on the comprehensive analysis without differentiation for habitats between mountain goats and Asiatic black bears. However, this study presents a way of supporting decision making ecosystem services. Further research should be needed, ex- panding the scope of the research into other biological taxa such as avian and amphibian species distributed in the ter- restrial ecosystem. The research findings are expected to be utilized in forest conservation and development planning.
Acknowledgements
This research was supported by the Ministry of Enviro- nment as “Eco Innovation Project (No. 2012000210002)”.
References
Cha SM. 2001. Food habits of Eurasian Otter (Lutra lutra) in Seomjin river and Namhae area in Korea. MS Thesis.
Kyungnam University, Masan, Korea. (in Korean)
Choi TY. 2002. Establishing a Korean goral (Nemorhaedus cauda- tus raddeanus heude) reserve in Soraksan national park, Korea:
By employing habitat evaluation and minimum viable pop- ulation based on trace survey using GPS. MS Thesis. Seoul National University, Seoul, Korea. (in Korean)
Costanza R, D’Arge R, De Groot R, Farber S, Grasso M, hannon B, Limburg K, Naeem S, O’Neill RV, Paruelo J, Raskin RG, Sutton P, Van Den Belt M. 1998. The value of the world’s eco-
system services and natural capital. Nature 387: 253-260.
Daily GC. 1997. Nature's services: societal dependence on natural ecosystems. Island Press, Washington, DC, pp 392.
Hageman RK. 1985. Valuing marine mammal populations: benefit valuations in a multi-species ecosystem. (La Jolla,) CA: National Marine Fisheries Service, Southwest Fisheries Center.
Han SY. 2008. Measuring Economic Value for Endangered Korean Goral. Journal of Korean Forest Society 97: 525-529.
Han SY, Choi K. 1998. New approach to value outdoor recrea- tional benefits of forest: an application of CVM-X (Experimen- tal Contingent Valuation). Journal of Forest Recreation 2: 39-51.
(in Korean with English abstract)
Han SY. 1998. The Ecological Studies of eurasian otter (Lutra lu- tra) in South Korea. PhD thesis. Kyungnam University, Masan, Korea. (in Korean with English abstract)
Jakobsson KM, Dragun AK. 2001. The worth of a possum: valu- ing species with the contingent valuation method. Environmen- tal and Resource Economics 211-227.
Jeon SW, Kim JU, Jung HC, Lee WK, Kim JS. 2014. Species dis- tribution modeling of endangered mammals for ecosystem serv- ices valuation - focused on national ecosystem survey data -. The Korea Society For Environmental Restoration And Revegeta- tion Technology 17: 111-122. (in Korean with English abstract) Joo WY. 2002. Eurasian Otter (Lutra lutra) habitat suitability
modeling using GIS: A case study on Soraksan National Park.
MS thesis. Seoul National University, Seoul, Korea. (in Korean) KDI. 2008. A Study on General Guidelines for Pre-feasibility
Study. 5th ed.
Kim JY, Seo CW, Kwon HS, Ryu, JE, Kim MJ. 2012. A Study on the Species Distribution Modeling using National Ecosystem Survey Data. Korean Society of Environmental Impact Assess- ment 21: 593-607. (in Korean with English abstract)
Kim SK. 2013. The effect of social discount rate manipulation on the economic feasibility tests: focusing on the environmental public investment projects. Journal of Environmental Policy 12:
71-92. (in Korean with English abstract)
Kotchen MJ, Reiling SD. 2000. Environmental attitudes, motiva- tions, and contingent valuation of nonuse values: a case study in- volving endangered species. Ecological Economics 32: 93-107.
Kwon HS, Seo C W, Park CH. 2012. Development of species dis- tribution models and evaluation of species richness in Jirisan region. Journal of the Korean Society for Geo-Spatial Inforam- tion System 20: 11-18. (in Korean with English abstract) Lee DK, Song WK. 2008. A Study on the Analytic Unit of habitat
Suitability Assessment and Selection in Conservation Areas for Leopard Cat (Prionailurus bengalensis) - Focus on Chungche- nong Province Area. Journal of Korean Institute of Landscape Architecture 36: 64-72. (in Korean with English abstract) Lee HC. 2002. Valuing the nightheron resource - the dichotomous
choice contingent valuation method approach. Journal of Tourism Sciences 25: 127-142. (in Korean with English ab- stract)
Loomis JB, Larson DM. 1994. Total economic values of increasing gray whale populations: Results from a contingent valuation sur- vey of visitors and households. Marine Resource Economics 9:
275-286.
Millennium Ecosystem Assessment. 2003. Ecosystems and Human Well-being: A Framework for Assessment. Washington DC, Island Press.
OECD. 2011. Recent OECD work on Biodiversity.
Olsen D, Richards J, Scott RD. 1991. Existence of sport values for doubling the size of Columbia River Basin Salmon and Steel- head runs. Rivers 2: 44-56.
Samples K, Hollyer J. 1990. Contingent valuation of wildlife re- sources in the presence of substitutes and complements. In:
Economic valuation of natural resources: issues, theory, and ap- plication (Johnson R, Johnson G, eds). Westview Press, Boulder, CO.
Seo CW, Choi TY, Choi YS, Kim DY. 2008. A study on wildlife habitat suitability modeling for goral (Nemorhaedus caudatus raddeanus) in Seoraksan National Park. The Korea Society For Environmental Restoration And Revegetation Technology 11:
28-38. (in Korean with English abstract)
Son JI. 2000. Distribution and habitat Use of eurasian otter (Lutra lutra) in Dong River, Korea. MS thesis. Kyungnam University, Masan, Korea.
Stevens TH, Echeverria J, Glass RJ, Hager T, More TA. 1991.
Measuring the existence value of wildlife: What do CVM esti- mates really show? Land Economics 67: 390-400.
TEEB. 2010. The Economics of ecosystems and biodiversity: eco- logical and economic foundations, Earthscan, London.
Tisdell, Clem, Wilson C, Nantha HS. 2005. Policies for saving a rare australian glider: economics and ecology. Biological Con- servation 123: 237-248.
Yang DH. 1999. Food habits of eurasian otter (Lutra lutra) in Yuncho-Dam, Koje in Korea. MS thesis. Kyungnam University, Masan, Korea.
Yeo JH, Bang SW. 2007. Analysis of professionals’ willingness to pay about the Kumkang pine tree stock in Ul-Jin. Journal of Korean Institute of Forest Recreation 11: 11-23. (in Korean with English abstract)
Yeo JH, Jang WW. 2007. Estimation of biodiversity conservation value about the Heory Stock in Sun-Cheon. Journal of Korean Forest Society 96: 483-493. (in Korean with English abstract) Yu JC, Kim JE. 2008. Using one and one-half bounded dichoto-
mous choice contingent valuation methods to estimate non-mar- ket value of otters in Cheongju, Cheongwon area. Environmental and Resource Economics Review 17: 349-379.
Youn YC, Jang HC. 1994. Evaluation on conservation value for Gwangneung woodpecker. Environmental and Resource Eco- nomics Review 3: 87-105. (in Korean with English abstract)