www.cmj.ac.kr
The Relationship of Neutrophil-Lymphocyte Ratio and
Platelet-Lymphocyte Ratio with Bone Mineral Density in Korean Postmenopausal Women
San-Hui Lee1, So-Yeon Ryu2, Jong Park2, Min-Ho Shin3, Mi-Ah Han2, and Seong-Woo Choi2,*
1Department of Health Science, Graduate School of Chosun University, 2Department of Preventive Medicine, Chosun University Medical School, Gwangju, 3Department of Preventive Medicine, Chonnam National University Medical School, Hwasun, Korea
The neutrophil to lymphocyte ratio (NLR) and platelet to lymphocyte ratio (PLR) are known to be markers of the systemic inflammatory response. However, the few studies that have been done on the relationship between the NLR and PLR and osteoporosis have yielded inconsistent results. Therefore, we assessed the relationship between the NLR and PLR and bone mineral density (BMD). This study was conducted with post- menopausal patients admitted to an orthopaedic hospital. Data including BMD, NLR, PLR and covariates were obtained from the subjects’ medical records. In total, 407 post- menopausal patients were enrolled in this study. Analysis of covariance was performed to identify significant differences in BMD according to NLR and PLR. After adjusting for other covariates, a quartile of NLR was negatively associated with the mean value of lumbar BMD (p=0.040, p for trend=0.005) but not with the mean value of femur neck BMD. However, there were no significant associations among the PLR, the BMD of the lumbar and the femur neck. In conclusion, the quartile of NLR was negatively asso- ciated with the mean value of lumbar BMD in Korean postmenopausal patients.
Key Words: Neutrophils; Lymphocytes; Blood Platelets; Bone Density
This is an Open Access article distributed under the terms of the Creative Commons Attribution Non-Commercial License (http://creativecommons.org/licenses/by-nc/4.0) which permits unrestricted non-commercial use, distribution, and reproduction in any medium, provided the original work is properly cited.
Article History:
Received May 23, 2019 Revised June 14, 2019 Accepted June 25, 2019
Corresponding Author:
Seong-Woo Choi
Department of Preventive Medicine, Chosun University Medical School, 309 Pilmun-daero, Dong-gu, Gwangju 61452, Korea Tel: +82-62-230-6344 Fax: +82-62-225-8293 E-mail: [email protected]
INTRODUCTION
Globally, osteoporosis is estimated to affect 200 million women1 and 1 in 3 women over age 50 will experience osteo- porotic fractures, as will 1 in 5 men over the age of 50.2,3 In Korean people aged 50 or older using the Korea National Health and Nutrition Examination Survey (KNHANES) 2008-2011, the prevalences of osteoporosis were 7.0% in men and 40.1% in women.4 Fractures due to osteoporosis are difficult to treat, resulting in tremendous economic losses.5 Also, fractures reduce the quality of life of post- menopausal women by limiting their movement and caus- ing pressure ulcers, cardiopulmonary dysfunction, and ve- nous thrombosis.6 Therefore, prediction and, if possible, prevention, of osteoporosis are of considerable importance.
The inflammatory response protects the damaged area and maintains homeostasis.7 However, if this reaction per- sists, long-term secretion of inflammatory mediators can
induce chronic inflammatory diseases.8-10 Chronic inflam- mation is also present in vascular diseases, and is used as to predict their development.11,12 Additionally, osteogenic factors are secreted during chronic inflammation to induce osteoporosis.13,14
As with inflammatory measures, the white blood cell (WBC) count, C-reactive protein (CRP) level, and eryth- rocyte sedimentation rate (ESR) are useful in clinical prac- tice, but have low diagnostic specificity.15 Recently, the neutrophil to lymphocyte ratio (NLR) and platelet to lym- phocyte ratio (PLR) have been known as new markers of the systemic inflammatory response.16,17 Specifically, the NLR and PLRs are predictive of an inflammatory response in the vascular system17 and more accurate in this regard than the level of CRP, a predictor of myocardial infarction and mortality.18 Also, some researchers reported that the NLR and PLR are associated with a decreased BMD and osteoporosis.19,20 However, the relationship between the NLR and PLR and osteoporosis have yielded inconsistent
TABLE 1. Characteristics of subjects according to NLR quartile
Characteristic NLR
Q1 (<1.32) Q2 (1.32-1.70) Q3 (1.71-2.33) Q4 (2.34-6.53) p
N (%) 102 (25.1) 101 (24.8) 104 (25.6) 100 (24.6)
Age (years) 62.9±8.0 65.3±7.9 64.7±9.6 66.4±8.5 0.032
Height (cm) 154.5±6.3 156.0±5.4 155.7±5.2 155.4±6.4 0.846
Weight (kg) 57.7±8.7 58.5±8.6 58.5±8.4 58.7±9.1 0.286
BMI (kg/m2) 24.1±3.1 24.0±3.0 24.1±3.0 24.3±3.3 0.923
Current smoking (%) 3 (2.9) 1 (1.0) 3 (2.9) 2 (2.0) 0.756
Monthly drinking (%) 32 (31.4) 32 (31.7) 29 (27.9) 21 (21.0) 0.297
Exercise (%) 21 (20.6) 22 (21.8) 26 (25.0) 18 (18.0) 0.673
Daily coffee consumption (%) 67 (65.7) 64 (63.4) 48 (46.2) 56 (56.0) 0.020
Hypertension (%) 52 (51.0) 55 (54.5) 58 (55.8) 57 (57.0) 0.843
Diabetes (%) 30 (29.4) 39 (38.6) 36 (34.6) 46 (46.0) 0.096
Use of analgesics (%) 11 (10.8) 16 (15.8) 15 (14.4) 5 (5.0) 0.074
Use of antibiotics (%) 5 (4.9) 4 (4.0) 4 (3.8) 9 (9.0) 0.323
Use of nutritional supplements (%) 9 (8.8) 6 (5.9) 6 (5.8) 6 (6.0) 0.787
Use of steroids (%) 10 (9.8) 9 (8.9) 15 (14.4) 6 (6.0) 0.238
History of surgery (%) 58 (56.9) 52 (51.5) 61 (58.7) 61 (61.0) 0.568
WBC count (103/L) 6.1±1.7 6.0±1.4 6.6±2.0 6.9±2.0 0.001
ESR (mg/L) 12.8±9.3 12.4±7.6 13.5±10.5 14.2±10.6 0.567
CRP level (mg/L) 0.1±0.2 0.1±0.2 0.2±0.3 0.2±0.5 0.009
Lumbar BMD (g/cm2) 0.79±0.10 0.77±0.12 0.77±0.11 0.74±0.10 0.035
Femoral neck BMD (g/cm2) 0.64±0.11 0.64±0.13 0.63±0.11 0.61±0.13 0.188
PLR 87.4±23.4 99.2±23.0 110.4±33.6 141.5±48.6 <0.001
All values are given as n (%) or mean±standard deviation.
PLR: platelet lymphocyte ratio, BMI: body mass index, WBC: white blood cell count, ESR: erythrocyte sedimentation rate, CRP: C-re- active protein, BMD: bone mineral destiny, NLR: neutrophil lymphocyte ratio.
results. All this said, to the best of my knowledge, there has been no study of the association between the NLR and PLR and osteoporosis in the Korean population. Thus, we inves- tigated the relationships among the NLR, PLR, and lum- bar and femoral neck BMD in postmenopausal Korean women.
MATERIALS AND METHODS 1. Participants
This study involved postmenopausal women admitted to an orthopaedic hospital in Korea from January 2016 to August 2018. During this period, 498 postmenopausal pa- tients were able to perform the activities of daily living and to communicate. Of this group, 407 were enrolled after we excluded 91 with fractures or a history of treatment for os- teoporosis that could affect the test results. Patients who were admitted to the hospital during the study period (February 2018 to August 2018) were interviewed by the researchers and patients who had been discharged from the hospital during the study period were interviewed when they visited for outpatient treatment. This study was conducted in accordance with the Declaration of Helsinki, and the protocol was approved by the Institutional Review Board of Chosun University Hospital (no: 2018-04-015) and informed consent was obtained from all patients.
2. Measures
Experienced investigators reviewed the subjects’ medi- cal records. When the information therein was insufficient, a telephone survey was conducted to obtain information on current smoking, monthly drinking, exercise, daily coffee consumption, hypertension, diabetes, use of analgesics, use of antibiotics, use of nutritional supplements, use of steroids, and history of surgery. The current smoking sta- tus was assessed by self-report; subjects were classified as current smokers based on their current smoking habits.
Monthly drinking was assessed by exploring drinking be- haviour during the month prior to interview. Exercise was coded yes when a subject walked for >30 min more than five times per week. Hypertension and diabetes was coded yes when a subject was treating for hypertension and diabetes.
Venous blood samples were collected at the first visit to the hospital. Differential WBC counts were performed us- ing the automated ADIVA® 120 Hematology System (Bayer Corporation, Tarrytown, NY, USA). The NLR was calcu- lated by dividing the number of neutrophils by the number of lymphocytes, and the PLR was calculated by dividing the platelet count by the number of lymphocytes.
The lumbar spine and femoral neck BMD were measured by dual energy x-ray absorptiometry using a DEXXUM-T instrument (Osteosys, Inc., Seoul, Republic of Korea). The lumbar spine BMD was calculated as the mean of the val-
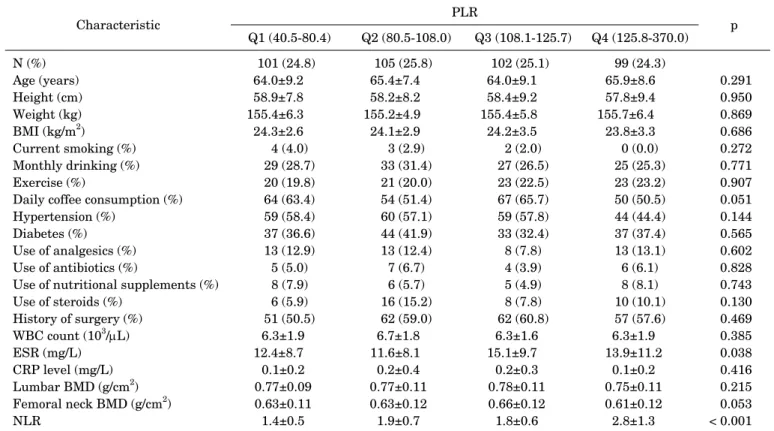
TABLE 2. Characteristics of subjects according to PLR quartile
Characteristic PLR
Q1 (40.5-80.4) Q2 (80.5-108.0) Q3 (108.1-125.7) Q4 (125.8-370.0) p
N (%) 101 (24.8) 105 (25.8) 102 (25.1) 99 (24.3)
Age (years) 64.0±9.2 65.4±7.4 64.0±9.1 65.9±8.6 0.291
Height (cm) 58.9±7.8 58.2±8.2 58.4±9.2 57.8±9.4 0.950
Weight (kg) 155.4±6.3 155.2±4.9 155.4±5.8 155.7±6.4 0.869
BMI (kg/m2) 24.3±2.6 24.1±2.9 24.2±3.5 23.8±3.3 0.686
Current smoking (%) 4 (4.0) 3 (2.9) 2 (2.0) 0 (0.0) 0.272
Monthly drinking (%) 29 (28.7) 33 (31.4) 27 (26.5) 25 (25.3) 0.771
Exercise (%) 20 (19.8) 21 (20.0) 23 (22.5) 23 (23.2) 0.907
Daily coffee consumption (%) 64 (63.4) 54 (51.4) 67 (65.7) 50 (50.5) 0.051
Hypertension (%) 59 (58.4) 60 (57.1) 59 (57.8) 44 (44.4) 0.144
Diabetes (%) 37 (36.6) 44 (41.9) 33 (32.4) 37 (37.4) 0.565
Use of analgesics (%) 13 (12.9) 13 (12.4) 8 (7.8) 13 (13.1) 0.602
Use of antibiotics (%) 5 (5.0) 7 (6.7) 4 (3.9) 6 (6.1) 0.828
Use of nutritional supplements (%) 8 (7.9) 6 (5.7) 5 (4.9) 8 (8.1) 0.743
Use of steroids (%) 6 (5.9) 16 (15.2) 8 (7.8) 10 (10.1) 0.130
History of surgery (%) 51 (50.5) 62 (59.0) 62 (60.8) 57 (57.6) 0.469
WBC count (103/L) 6.3±1.9 6.7±1.8 6.3±1.6 6.3±1.9 0.385
ESR (mg/L) 12.4±8.7 11.6±8.1 15.1±9.7 13.9±11.2 0.038
CRP level (mg/L) 0.1±0.2 0.2±0.4 0.2±0.3 0.1±0.2 0.416
Lumbar BMD (g/cm2) 0.77±0.09 0.77±0.11 0.78±0.11 0.75±0.11 0.215
Femoral neck BMD (g/cm2) 0.63±0.11 0.63±0.12 0.66±0.12 0.61±0.12 0.053
NLR 1.4±0.5 1.9±0.7 1.8±0.6 2.8±1.3 < 0.001
All values are given as n (%) or mean±standard deviation.
PLR: platelet lymphocyte ratio, BMI: body mass index, WBC: white blood cell count, ESR: erythrocyte sedimentation rate, CRP: C-re- active protein, BMD: bone mineral destiny, NLR: neutrophil lymphocyte ratio.
ues of the L1-L4 spine segments. Daily phantom scans were performed each morning for quality control purposes, and all BMD scans were conducted by trained examiners using standardized procedures according to the manufacturer’s recommended protocols. All BMD scans were reviewed by an experienced investigator to ensure that the region of in- terest was defined appropriately.
3. Statistical analysis
Statistical analysis was performed using SPSS version 22.0 (SPSS Inc.; Chicago, IL) for Windows. Data is ex- pressed as frequencies and percentages or means±stand- ard deviations. The associations of NLR and PLR quartiles with the subjects’ characteristics were evaluated. Analysis of covariance (ANCOVA) was performed to identify sig- nificant differences in the lumbar spine and femoral neck BMD according to NLR and PLR quartile. Model 1 was not adjusted, and Model 2 was adjusted for age, height, weight, current smoking, monthly drinking, exercise, and daily cof- fee consumption. Model 3 was adjusted for the Model-2 var- iables plus hypertension, diabetes, use of analgesics, use of antibiotics, use of nutritional supplements, use of ste- roids, and history of surgery. A value of p<0.05 was consid- ered indicative of statistical significance.
RESULTS
Table 1 shows the subjects’ characteristics according to NLR quartile. Age, daily coffee consumption, WBC count, CRP level, lumbar BMD, and the PLR differed significantly according to NLR quartile. Table 2 shows the character- istics of the subjects according to NLR quartile. The ESR and NLR differed significantly according to PLR quartile.
Table 3 lists the mean (95% confidence interval [CI]) lumbar and femoral neck BMD according to NLR quartile.
The lumbar BMD decreased significantly as the NLR quar- tile increased after adjusting for other covariates (Q1, 0.79 [0.77-0.81]; Q2, 0.77 [0.75-0.79]; Q3, 0.76 [0.74-0.78]; Q4, 0.74 [0.72-0.77]; p=0.040, p for trend=0.005). However, the femoral neck BMD was not associated with the NLR quartile. Table 4 lists the mean (95% CI) lumbar and femo- ral neck BMD according to PLR quartile. Neither the lum- bar BMD nor the femoral neck BMD was associated with the PLR quartile.
DISCUSSION
We investigated the relationship between BMD and the NLR and PLR in Korean postmenopausal women. After ad- justing for confounding variables, the NLR quartile was negatively associated with the mean lumbar BMD, but the
TABLE 3. Mean BMD according to NLR quartile
NLR quartile Model 1a Model 2b Model 3c
Mean (95%CI) Mean (95%CI) Mean (95%CI)
Lumbar
Q1 0.79 (0.76-0.81) 0.79 (0.77-0.81) 0.79 (0.77-0.81)
Q 0.77 (0.75-0.79) 0.77 (0.75-0.79) 0.77 (0.75-0.79)
Q 0.77 (0.75-0.79) 0.76 (0.74-0.78) 0.76 (0.74-0.78)
Q 0.74 (0.72-0.76) 0.74 (0.72-0.76) 0.74 (0.72-0.77)
p 0.035 0.052 0.040
p for trend 0.006 0.005 0.005
Femoral neck
Q1 0.64 (0.62-0.67) 0.64 (0.62-0.66) 0.64 (0.62-0.66)
Q 0.64 (0.62-0.67) 0.64 (0.62-0.67) 0.64 (0.62-0.66)
Q 0.63 (0.61-0.65) 0.63 (0.60-0.65) 0.63 (0.60-0.65)
Q 0.61 (0.59-0.63) 0.62 (0.59-0.64) 0.62 (0.59-0.64)
p 0.188 0.313 0.343
p for trend 0.044 0.085 0.092
aNon-adjusted. bAdjusted for age, height, weight, current smoking, monthly drinking, exercise, and daily coffee consumption. cAdjusted for the Model-2 variables plus hypertension, use of analgesics, use of antibiotics, use of nutritional supplements, use of steroids, and history of surgery.
TABLE 4. Mean BMD according to PLR quartile
PLR quartile Model 1a Model 2b Model 3c
Mean (95%CI) Mean (95%CI) Mean (95%CI)
Lumbar
Q1 0.77 (0.75-0.79) 0.77 (0.75-0.79) 0.77 (0.75-0.79)
Q2 0.77 (0.75-0.79) 0.77 (0.75-0.79) 0.77 (0.75-0.79)
Q3 0.78 (0.76-0.80) 0.78 (0.76-0.80) 0.78 (0.76-0.80)
Q4 0.75 (0.72-0.77) 0.75 (0.73-0.77) 0.75 (0.73-0.77)
p 0.215 0.216 0.296
p for trend 0.207 0.217 0.363
Femoral neck
Q1 0.63 (0.60-0.65) 0.63 (0.60-0.65) 0.62 (0.60-0.65)
Q2 0.63 (0.61-0.65) 0.63 (0.61-0.65) 0.63 (0.61-0.65)
Q3 0.66 (0.64-0.68) 0.66 (0.63-0.68) 0.66 (0.63-0.68)
Q4 0.61 (0.59-0.64) 0.61 (0.59-0.64) 0.61 (0.59-0.64)
p 0.053 0.058 0.069
p for trend 0.885 0.972 0.921
aNon-adjusted. bAdjusted for age, height, weight, current smoking, monthly drinking, exercise, and daily coffee consumption. cAdjusted for the Model-2 variables plus hypertension, use of analgesics, use of antibiotics, use of nutritional supplements, use of steroids, and history of surgery.
PLR was not associated with BMD.
In the present study, the lumbar spine BMD decreased significantly as the NLR increased. In a study of 1,635 pa- tients aged 65 years or older with or without osteopenia or osteoporosis, a multivariate logistic analysis showed that osteoporosis increased as the NLR increased.19 Among 233 postmenopausal women without diabetes, a multivariate logistic analysis showed that osteoporosis increased as the NLR increased.21 In a study with 438 female patients who visited a hospital, both the lumbar spine and the femoral neck BMD decreased as the NLR increased,22 which is in
agreement with our findings.
In our study, there was no significant relationship be- tween the PLR and BMD. Few previous studies have as- sessed the relationship between BMD and the PLR. One study investigated the associations among the PLR, NLR, and BMD in 211 postmenopausal women who visited a hos- pital; the PLR was negatively correlated with BMD, where- as the NLR was not.20 However, only a simple correlation analysis, not a multivariate analysis, was performed. In a study involving 4,120 patients, the level of vitamin D, which is associated with BMD, significantly decreased as
the PLR increased, but the relationship between the NLR and vitamin D was not significant.23 However, because that study did not analyze the association of the NLR and PMR with BMD, the results cannot be directly compared with our findings.
The mechanisms by which chronic inflammatory fac- tors, including the NLR and PLR, affect BMD are known.
Inflammatory cytokines act on mesenchymal stem cells and osteoclast precursors to increase osteoclast-mediated bone resorption.13 These cytokines bind to stromal cells, in- creasing the production of receptor activator of nuclear fac- tor-kappa B (NF-B) ligand (RANKL) and macrophage- colony stimulating factor and decreasing that of osteopro- tegerin (OPG); together, these effects increase the activity of osteoclasts.24 Furthermore, the reduced estrogen level in postmenopausal women induces secretion by the T cells of a variety of inflammatory cytokines, which promotes the production of factors that activate osteoclasts, leading to the development of osteoporosis.25
We found that the NLR, but not the PLR, was related to BMD. The predictive utility of the NLR and PLR differs ac- cording to the chronic inflammatory condition in question.
In patients with end stage renal disease,26 the PLR has greater predictive power than the NLR. In contrast, the NLR has greater power to predict the prognosis of patients with gastric cancer27 and is a superior indicator of mortality in patients with breast cancer.28 The different predictive utilities of the PLR and NLR are likely caused by the differ- ent actions of platelets and neutrophils. Neutrophils se- crete the receptor activator of NF-B (RANK), RANKL, and OPG,29 and their interaction with osteoclasts activates bone resorption;30 therefore, the NLR is more strongly as- sociated with BMD than is the PLR.
Several studies have evaluated the association of the CRP level with BMD. In a US study of the relationship be- tween the CRP level and BMD in 2,087 65-year-old women, a simple correlation analysis indicated a significant corre- lation between the CRP level and BMD (p<0.001), but this relationship disappeared upon multiple regression analy- sis.14 In Sweden, a cohort study of 1,044 women aged 75 years or older showed no association between the CRP level and BMD.31 However, in a study using the US 1999-2004 National Health and Nutrition Examination Survey data (n=10,475), BMD decreased significantly as the high-sen- sitivity CRP (hsCRP) level increased in both males and females.32 In our further analysis, the WBC count, ESR, and CRP level were not significantly associated with the lumbar spine BMD or the femoral neck BMD (data are not shown).
This study had the following limitations. First, its cross- sectional design precluded determination of the causality of the relationships identified. Second, we did not analyze other factors that could affect BMD, such as the levels of vitamin D and parathyroid hormones. However, for the first time, there was a meaningful investigation of the rela- tionship between NLR, PLR and BMD in Korean post- menopausal women.
In conclusion, after adjusting for confounding variables, the NLR quartile was negatively associated with the mean lumbar BMD in Korean postmenopausal women. However, the PLR was not associated with BMD.
CONFLICT OF INTEREST STATEMENT None declared.
REFERENCES
1. Johnell O, Kanis JA. An estimate of the worldwide prevalence and disability associated with osteoporotic fractures. Osteoporos Int 2006;17:1726-33.
2. Kanis JA, Johnell O, Oden A, Sembo I, Redlund-Johnell I, Dawson A, et al. Long-term risk of osteoporotic fracture in Malmö.
Osteoporos Int 2000;11:669-74.
3. Melton LJ 3rd, Atkinson EJ, O’Connor MK, O’Fallon WM, Riggs BL. Bone density and fracture risk in men. J Bone Miner Res 1998;13:1915-23.
4. Kim Y, Kim JH, Cho DS. Gender difference in osteoporosis preva- lence, awareness and treatment: based on the Korea national health and nutrition examination survey 2008-2011. J Korean Acad Nurs 2015;45:293-305.
5. Harvey N, Dennison E, Cooper C. Osteoporosis: impact on health and economics. Nat Rev Rheumatol 2010;6:99-105.
6. Lips P, van Schoor NM. Quality of life in patients with osteo- porosis. Osteoporos Int 2005;16:447-55.
7. Tizard IR. Resistance to tumors. In: Tizard IR, ed. Veterinary im- munology: an introduction. 7th ed. Philadelphia:Saunders,2004;
364-76.
8. Boscá L, Zeini M, Través PG, Hortelano S. Nitric oxide and cell viability in inflammatory cells: a role for NO in macrophage func- tion and fate. Toxicology 2005;208:249-58.
9. Nathan C. Nitric oxide as a secretory product of mammalian cells.
FASEB J 1992;6:3051-64.
10. Turini ME, DuBois RN. Cyclooxygenase-2: a therapeutic target.
Annu Rev Med 2002;53:35-57.
11. Lowenstein CJ, Snyder SH. Nitric oxide, a novel biologic mes- senger. Cell 1992;70:705-7.
12. Rocca B, FitzGerald GA. Cyclooxygenases and prostaglandins:
shaping up the immune response. Int Immunopharmacol 2002;
2:603-30.
13. Barbour KE, Boudreau R, Danielson ME, Youk AO, Wactawski- Wende J, Greep NC, et al. Inflammatory markers and the risk of hip fracture: the women’s health initiative. J Bone Miner Res 2012;27:1167-76.
14. Ganesan K, Teklehaimanot S, Tran TH, Asuncion M, Norris K.
Relationship of C-reactive protein and bone mineral density in community-dwelling elderly females. J Natl Med Assoc 2005;97:
329-33.
15. Shen H, Zhang N, Zhang X, Ji W. C-reactive protein levels after 4 types of arthroplasty. Acta Orthop 2009;80:330-3.
16. Gary T, Pichler M, Belaj K, Hafner F, Gerger A, Froehlich H, et al. Platelet-to-lymphocyte ratio: a novel marker for critical limb ischemia in peripheral arterial occlusive disease patients. PLoS One 2013;8:e67688.
17. Grau AJ, Boddy AW, Dukovic DA, Buggle F, Lichy C, Brandt T, et al.; CAPRIE Investigators. Leukocyte count as an independent predictor of recurrent ischemic events. Stroke 2004;35:1147-52.
18. Tamhane UU, Aneja S, Montgomery D, Rogers EK, Eagle KA, Gurm HS. Association between admission neutrophil to lympho- cyte ratio and outcomes in patients with acute coronary synd- rome. Am J Cardiol 2008;102:653-7.
19. Öztürk ZA, Yesil Y, Kuyumcu ME, Bilici M, Öztürk N, Yeşil NK, et al. Inverse relationship between neutrophil lymphocyte ratio (NLR) and bone mineral density (BMD) in elderly people. Arch Gerontol Geriatr 2013;57:81-5.
20. Koseoglu SB. Bone loss & platelet-to-lymphocyte ratio. Biomark Med 2017;11:5-10.
21. Huang C, Li S. Association of blood neutrophil lymphocyte ratio in the patients with postmenopausal osteoporosis. Pak J Med Sci 2016;32:762-5.
22. Yilmaz H, Uyfun M, Yilmaz TS, Namuslu M, Inan O, Taskin A, et al. Neutrophil-lymphocyte ratio may be superior to C-reactive protein for predicting the occurrence of postmenopausal osteo- porosis. Endocr Regul 2014;48:25-33.
23. Akbas EM, Gungor A, Ozcicek A, Akbas N, Askin S, Polat M.
Vitamin D and inflammation: evaluation with neutrophil-to-lym- phocyte ratio and platelet-to-lymphocyte ratio. Arch Med Sci 2016;12:721-7.
24. Ferrari SL, Ahn-Luong L, Garnero P, Humphries SE, Greenspan SL. Two promoter polymorphisms regulating interleukin-6 gene expression are associated with circulating levels of C-reactive protein and markers of bone resorption in postmenopausal women. J Clin Endocrinol Metab 2003;88:255-9.
25. Briot K, Gossec L, Kolta S, Dougados M, Roux C. Prospective as- sessment of body weight, body composition, and bone density
changes in patients with spondyloarthropathy receiving anti-tu- mor necrosis factor-alpha treatment. J Rheumatol 2008;35:
855-61.
26. Turkmen K, Erdur FM, Ozcicek F, Ozcicek A, Akbas EM, Ozbicer A, et al. Platelet-to-lymphocyte ratio better predicts inflam- mation than neutrophil-to-lymphocyte ratio in end-stage renal disease patients. Hemodial Int 2013;17:391-6.
27. Kim EY, Lee JW, Yoo HM, Park CH, Song KY. The platelet-to-lym- phocyte ratio versus neutrophil-to-lymphocyte ratio: which is bet- ter as a prognostic factor in gastric cancer? Ann Surg Oncol 2015;22:4363-70.
28. Azab B, Shah N, Radbel J, Tan P, Bhatt V, Vonfrolio S, et al.
Pretreatment neutrophil/lymphocyte ratio is superior to plate- let/lymphocyte ratio as a predictor of long-term mortality in breast cancer patients. Med Oncol 2013;30:432.
29. Poubelle PE, Chakravarti A, Fernandes MJ, Doiron K, Marceau AA. Differential expression of RANK, RANK-L, and osteoprote- gerin by synovial fluid neutrophils from patients with rheumatoid arthritis and by healthy human blood neutrophils. Arthritis Res Ther 2007;9:R25.
30. Peng YF, Cao L, Zeng YH, Zhang ZX, Chen D, Zhang Q, et al.
Platelet to lymphocyte ratio and neutrophil to lymphocyte ratio in patients with rheumatoid arthritis. Open Med (Wars) 2015;10:
249-53.
31. Berglundh S, Malmgren L, Luthman H, McGuigan F, Åkesson K.
C-reactive protein, bone loss, fracture, and mortality in elderly women: a longitudinal study in the OPRA cohort. Osteoporos Int 2015;26:727-35.
32. de Pablo P, Cooper MS, Buckley CD. Association between bone mineral density and C-reactive protein in a large population- based sample. Arthritis Rheum 2012;64:2624-31.