Optimization of Medium for Lipase Production from Zygosaccharomyces mellis SG1.2 Using Statistical Experiment Design
Marisa Dian Pramitasari and Miftahul Ilmi*
Faculty of Biology, Universitas Gadjah Mada, Jl. Teknika Selatan, Sekip Utara, Yogyakarta 55281, Indonesia
Received: June 29, 2021 / Revised: July 14, 2021 / Accepted: July 23, 2021
Introduction
Lipase (triacylglycerol acyl hydrolase, E.C. 3.1.1.3) is an enzyme that plays a role in the hydrolysis of tri- glycerides to produce fatty acids and glycerol. Lipases can also reverse reactions to synthesize triacylglycerol from free fatty acids and glycerol [1]. Lipase applications in modern industry are very wide, including the formu- lation of detergents, dairy products, paper, cosmetics,
pharmaceuticals, and biodiesel synthesis [2].
Biodiesel, a biodegradable and non-toxic biofuel has emerged as one of the most potential renewable energies to replace diesel fuel. Biodiesel can be derived from vegetable oils, animal fats, or microbial oils through transesterification or esterification [3]. The application of lipase as a biocatalyst in biodiesel synthesis has been widely reported [3, 4]. Transesterification with a base- catalyzed forms undesirable soap and water. Meanwhile, acid-catalyzed esterification requires large amounts of alcohol [3]. Lipases do not form soap and can esterify FFAs and TAGs in one step without requiring a subse- quent washing step. So that lipase is an attractive pros- Lipase (triacylglycerol lipase, EC 3.1.1.3) is an enzyme capable of hydrolyzing triacylglycerol, to produce fatty acids and glycerol and reverse the reaction of triacylglycerol synthesis from fatty acids and glycerol through transesterification. Applications of lipase are quite widespread in the industrial sector, including in the detergent, paper, dairy, and food industries, as well as for biodiesel synthesis. Lipases by yeasts have attracted industrial attention because of their fast production times and high stability. In a previous study, a lipase-producing yeast isolate was identified as Zygosaccharomyces mellis SG1.2 and had a pro- ductivity of 24.56 U/mg of biomass. This productivity value has the potential to be a new source of lipase, besides Yarrowia lypolitica which has been known as a lipase producer with a productivity of 0.758 U/mg.
Lipase production by Z. mellis SG1.2 needs to be increased by optimizing the production medium. The aims of this study were to determine the significant component of the medium for lipase production and methods to increase lipase production using the optimum medium. The two methods used for the statistical optimization of production medium were Taguchi and RSM (Response Surface Methodology). The data obtained were analyzed using Minitab 18 and SPSS 23 software. The most significant factors which affected lipase productivity were olive oil and peptones. The optimum medium composition consisted of 1.02% olive oil, 2.19% peptone, 0.05% MgSO4·7H2O, 0.05% KCl, and 0.2% K2HPO4. The optimum medium was able to increase the lipase productivity of Z. mellis SG1.2 to 1.8-fold times the productivity before optimization.
Keywords: Lipase, lipolytic yeast, Taguchi, response surface methodology (RSM)
*Corresponding author Tel.: +6281392709667 E-mail: [email protected]
pect for the industrial-scale production for the reduction of production costs [5].
The high demand for lipases for use in various fields of the biotechnology industry necessitates the isolation of lipases from new sources [6]. Microorganism lipases have gained special attention in the industrial field due to their stability, selectivity, and broad substrate speci- ficity [7]. Microorganism lipases have previously been studied, such as Yarrowia lypolitica which has produc- tivity of 0.758 U/mg, Aspergillus ibercus 0.127 ± 0.017 U/
mg and Penicillium restrictum with productivity of 0.0123 U/mg [8−10]. Zygosaccharomyces mellis SG 1.2 isolated from forest honey was able to produce lipase and had a lipase productivity of 24.56 U/mg of biomass [11]. Z. mellis SG 1.2 is a promising new source of lipase and its productivity needs to be increased by optimiza- tion.
Increasing lipase productivity during the fermentation process is very important because it can reduce produc- tion costs and minimize production time [12, 13].
Increased lipase productivity can be done by optimizing the growth media [13]. The optimization process with the experimental method is statistically considered more advantageous because it can reduce the number of experiments and the possibility of evaluating the inter- actions effects between variables [14].
Taguchi statistical model was used to predict signifi- cant experimental medium for yeast growth and lipase production [15]. Taguchi DOE mainly involves Orthogo- nal Arrays (OA) to minimize experimental errors and increasing lipase production yields with a few experi- mental trials [6]. While RSM (Response Surface Method- ology) was used further to optimize lipase production from the optimum medium. Response surface analysis is important tools to determine the optimal process condi- tions. RSM method has previously been used to study the effect of concentration of carbon and nitrogen sources on lipase production by Geotrichum sp. [16].
The aim of our research was to increase the lipase pro- duction of the Z. mellis SG 1.2 strain by growing the strain on various growth medium factors which were optimized using the Taguchi and RSM methods. The results of this study are expected to provide the opti- mum medium composition information that can improve the production of lipase from strain Z. mellis SG 1.2.
Materials and Methods
Microorganism and culture condition
Yeast strain Z. mellis SG 1.2 which is a collection of the Microbiology Laboratory, Faculty of Biology, Uni- versitas Gadjah Mada.
Yeast strain were prepared for lipase production by inoculating one loop of the yeast cell on YMEA media and incubated for 4 days at room temperature [2].
Experimental design
Screening of significant factors using Taguchi method.
Design of experiment consists of 25 medium variations according to Taguchi based on 5 levels and 5 factors.
Factors used along with the level listed in Table 1. The experiments were performed using a 250 ml shake flask containing 50 ml of production medium and incubated in an incubator shaker with agitation speed of 200 rpm and a temperature of 30℃. Lipase activity was measured after 48 h of incubation.
Optimization of significant factors using RSM method.
The most significant factor will be further optimized using the RSM method. Design of experiment consists of 13 medium variations according to CCD (Central Composite Design) in RSM based on 5 levels and 2 factors. Experimental design of RSM method were shown in Table 2. The experiments were performed using a 250 ml shake flask containing 50 ml of produc- tion medium and incubated in an incubator shaker with agitation speed of 200 rpm and a temperature of 30℃.
Lipase activity was measured after 48 h of incubation.
Optimum medium validation. Validation was per- formed by growing the strain Z. mellis SG 1.2 into pro- duction medium in a previous study by Palilu et al. [11]
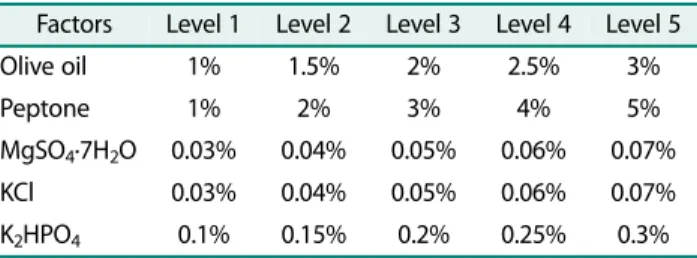
Table 1. Factors and levels on experimental design Taguchi.
Factors Level 1 Level 2 Level 3 Level 4 Level 5
Olive oil 1% 1.5% 2% 2.5% 3%
Peptone 1% 2% 3% 4% 5%
MgSO4·7H2O 0.03% 0.04% 0.05% 0.06% 0.07%
KCl 0.03% 0.04% 0.05% 0.06% 0.07%
K2HPO4 0.1% 0.15% 0.2% 0.25% 0.3%
and optimized medium using the RSM response opti- mizer. The culture growth conditions were set at pH 7, temperature 30℃ with level of agitation 200 rpm and incubation for 72 h. Lipase activity was measured at 12, 24, 36, 48, 60 and 72 h.
Measurement of lipase activity and productivity. A total of 20% of the medium was taken and centrifuged at 4000 rpm for 10 minutes. The pellets from the centrifuge were washed with distilled water and dried in an oven at 70℃. Extracellular lipase contained in the supernatant will be tested for lipase activity. Lipase activity was determined based on lipid content analysis which was carried out by measuring the free fatty acid content using colorimetry. Lipase activity of the supernatant was determined by incubating 100 µl filtrate with 1 ml isooctane containing 0.25 M oleic acid and 0.25 M ethanol for 20 min at 30℃. The amount of oleic acid at 0 min and after 20 min was determined using the cupric-acetate pyridine colorimetric assay [17]. The absorbance was measured using a spectrophotometer at a wavelength of 715 nm.
Productivity is defined as the number of units of rela- tive enzyme activity per milligram of biomass. Produc- tivity is calculated based on the following equation:
Productivity (U/mg) =
Data analysis. The data obtained will be analysed using
Taguchi and Response Surface Methodology (RSM) on Minitab software version 18 and Analysis of Variance (ANOVA) on SPSS version 23. The results of the analysis will be presented in the form of tables and graphs.
Results
Screening of significant factors using Taguchi method Screening of significant factors Taguchi method aims to determine the factors that have a significant effect on lipase production from Z. mellis SG1.2 and optimum level of these factors. Screening of significant factor was carried out by growing the strain Z. mellis SG1.2 on 25 variations of production medium and incubated in a shaker incubator at agitation speed of 200 rpm and temperature of 30℃. Lipase activity was measured after 48 h of incubation. The results of Taguchi analysis show the Mean Plot for SNR of each factor and Analysis of Variance (ANOVA) of Mean Plot for SNR, respectively, is presented in Fig. 1 and Table 3. The result showed that olive oil were significant with p < 0.05 and contribu- tion presentation of 37.64%. Peptone was considered to be a significant factor besides olive oil due to had p-value of 0.088 and the second highest contribution presenta- tion of 25.58%. These two factors can be used in a fur- ther optimization process.
Optimization of significant factors using RSM method Optimization of significant factors using RSM method aims to determine the optimum solution levels of the fac- tors examined in improving lipase production. Experi- mental design used in the method of RSM is a Central Composite Design (CCD) with 13 variations of produc- tion medium. Z. mellis SG1.2 was grown on 13 varia- tions of production medium and incubated in a shaker incubator at an agitation speed of 200 rpm and a tem- perature of 30℃. Lipase activity was measured after 48 h of incubation. Results of RSM analysis using Minitab software 18 provides output in polynomial equa- tion model as follows.
Y = 215.0 + 8.38 A + 21.20 B − 60.29 A*A − 55.69 B*B − 18,9 A*B
Y: Lipase productivity (U/mg biomass) A: Olive oil (%)
B: Peptone (%) relative enzyme activity U/ml( )
biomass mg/ml( ) --- Table 2. Experimental design of RSM method.
Running Olive oil (%) Peptone (%)
1 1 2
2 0.3 2
3 1 2
4 1 2
5 0.5 1
6 1 0.6
7 1 2
8 1.5 3
9 1.5 1
10 1.7 2
11 1 3.4
12 0.5 3
13 1 2
The suitability of the equation model with the actual situation can be seen based on the results of the ANOVA statistical analysis presented in Table 4. The equation model has a significant probability value (p < 0.05) and R-squared value that is high at 92.6%. While the value of lack of fit is not significant (p > 0.05). Correspondence between the experimental results and the predicted results can be illustrated by the graph normal probabil- ity plot (Fig. 2). The distribution of the residual point approaching a straight line. This implies that the equa- tion model proposed was reasonably accurate and ade- quate for optimization process.
Optimum level predictions for each optimization factor Table 3. ANOVA of Mean Plot for SNR.
Factors Degrees of freedom Sum of squares Contribution Mean square F-value P-value
Olive oil 4 898.71 37.64% 224.68 6.56 0.048* Significant
Peptone 4 610.68 25.58% 152.67 4.46 0.088
MgSO4·7H2O 4 313.59 13.14% 78.40 2.29 0.221
KCl 4 345.69 14.48% 86.42 2.52 0.196
K2HPO4 4 81.74 3.42% 20.43 0.60 0.685
Error 4 136.94 5.74% 34.23
Total 24 2387.34 100.00%
R-squared = 94.26%.
Fig. 1. Mean Plot for SNR (Signal to Noise Ratios) of lipase production, (A) olive oil, (B) peptone, (C) MgSO4.7H2O, (D) KCl, and (E) K2HPO4.
Fig. 2. Normal probability plot for lipase production (R- squared = 92.6%).
are shown in the contour plot graph (Fig. 3) and the sur- face plot graph (Fig. 4). Prediction of lipase productivity further to determine the optimum level of each factor was analysed using the response optimizer in Minitab which is presented in Fig. 5. As shown in Fig. 5, the maximum lipase production (y) that is predicted to be 217.0994 U/mg of biomass.
In order to verify the adequacy of the predicted value, confirmation experiments were performed. Stages of the verification carried out by repeating the experiment using the optimum conditions of the medium. Experi- mental verification data is 227.9 (U/mg biomass) which is still in the 95% CI and PI range. It can be said that the equation model developed was reasonably accurate.
Optimum medium validation
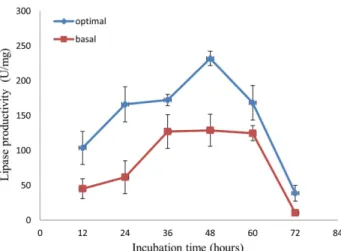
Validation of the optimum medium aimed to compare the lipase productivity profile from Zygosaccharomyces mellis SG1.2 in basal and optimum medium. Z. mellis SG1.2 was grown on both types of medium and incubated in a shaker incubator at an agitation speed of 200 rpm and a temperature of 30℃ for 72 h. Lipase activity was measured every 12 h. The lipase productivity profile of Z. mellis SG1.2 strain on both types of media is shown in Fig. 6. Lipase productivity after optimized increased by 1.8-fold of the basal medium is 128.857 ± 22.916 U/mg biomass to 231.992 ± 10.366 U/mg of biomass after 48 h of incubation.
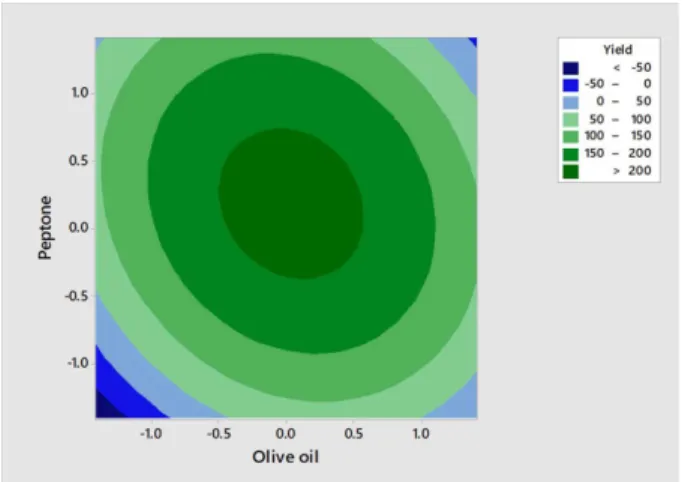
Fig. 3. Contour plot of combination of olive oil and peptone on lipase production.
Fig. 4. Surface plot of combination of olive oil and peptone on lipase production.
Fig. 5. Graph of lipase productivity predictions using response optimizer.
Discussion
Significant factor in lipase production from Z. mellis SG1.2 Olive oil was the most significant factor on lipase pro- duction from Z. mellis SG1.2 with optimum level concen- tration of 1%. Olive oil plays role as sole carbon source in production medium and an inducer for lipase produc- tion. Previous research explain that lipase is an inducible enzyme that requires a lipid substrate as an inducer.
Olive oil is the most widely used substrate to induce lipase production [18]. The optimum concentration of
olive oil was at a low level (1%) and decreased lipase pro- duction at higher concentrations. Adham and Ahmed [19] reported that enzyme activity decreased at 3% olive oil concentration. This is due to the increased concentra- tion of fatty acids accumulated from the hydrolysis of the substrate (olive oil) suppresses lipase synthesis.
Other factors had no significant effect on lipase production of Z. mellis SG1.2 with p > 0.05 (Table 3).
Peptone is the most influential factor after olive oil with a p-value of 0.088 and the second highest contribution presentation of 25.58%. This makes peptone as one of the most important factors besides olive oil in increasing lipase production, so it is used for further optimization.
The optimum level of peptone is at a concentration of 2%
(Fig. 1). Peptone in production medium acts as a nitrogen source. Organic nitrogen sources supply cells for growth factors and amino acids necessary for cell metabolism and enzyme synthesis [20]. Peptone is known as an inducer for lipase and protease production. The release of NH4+ ions from peptone affects the effectiveness of higher enzyme activity because NH4+ stimulates growth and increases the rate of enzyme production. The best results for maximum lipase production were obtained with the addition of peptone [21, 22].
Optimization of significant factor
The suitability of the equation model with the actual Fig. 6. Lipase productivity profile from Z. mellis SG1.2 on
basal and optimum medium.
Table 4. ANOVA of polynomial equation model.
Factors Degrees of
freedom (df)
Sum of squares
Mean
square F-value P-value k
Model 5 47067.1 9413.4 17.53 0.001* Significant
Linear 2 4157.3 2078.6 3.87 0.074
Olive oil 1 562.4 562.4 1.05 0.340
Peptone 1 3594.9 3594.9 6.69 0.036
Square 2 41474.2 20737.1 38.61 0.000
Olive oil*olive oil 1 25285.7 25285.7 47.08 0.000
Peptone*Peptone 1 21576.1 21576.1 40.17 0.000
2-Way Interaction 1 1435.7 1435.7 2.67 0.146
Olive oil*Peptone 1 1435.7 1435.7 2.67 0.146
Error 7 3759.5 537.1
Lack-of-Fit 3 233.7 77.9 0.09 0.963 Not significant
Pure Error 4 3525.8 881.4
Total 12 50826.5
R-squared = 92.6%.
situation can be seen based on the results of the ANOVA statistical analysis presented in Table 4. The equation model has a p < 0.05 which indicates a significant probability value. The significant model analysis with p < 0.05 means that the model can be used for optimiza- tion programs [23]. In addition, the model equation has an R-squared value that is high at 92.6%. The accuracy of the model can be evaluated through the determina- tion coefficient R-squared. A high R-squared value (92.6%) indicates a high degree of correlation between the experimental value and the predicted value by the model. The R-squared value of 92.6% indicates that only about 7.4% of the total variation cannot be explained by the polynomial model [24]. While the value of lack of fit with p > 0.05 indicates that it is not significant, which is a reliable model requirement. An insignificant lack of fit value is a requirement for an accurate model because it shows the suitability of the response data with the model [25, 26].
Correspondence between the experimental results and the predicted results can be illustrated by the graph normal probability plot (Fig. 2) shows the distribution of the residual point approaching a straight line so it can be assumed the experimental results closer to the pre- dicted value. These data points are increasingly approaching normality line indicates normal data distri- bution means that the experimental results will approach predicted results [27].
Optimum level predictions for each optimization factor are shown in the contour plot graph (Fig. 3) and the surface plot graph (Fig. 4). The two graphs show the combination of factors that influence the response value.
The optimum point for both olive oil and peptone factors is predicted to be in the code range 0 and 0.5. Code 0 is the middle level value for each factor, these were olive oil with a concentration of 1% and peptone with a concen- tration of 2%. Optimum lipase productivity is predicted to be more than 200 U/mg of biomass. Prediction of lipase productivity further to determine the optimum level of each factor was analysed using the response opti-
mizer in Minitab which is presented in Fig. 5.
Prediction graph of the response optimizer (Fig. 5) shows the maximum response (y) that is predicted to be 217.0994 U/mg of biomass. The optimum solution point for each factor and the comparison between the pre- dicted and experimental productivity values can be seen in Table 5. The desirability (d) value on the prediction graph is 0.7764. The desirability value closer to the value of 1 indicates the model's ability to produce the desired response more optimal [26, 28].
In order to verify the adequacy of the predicted value, confirmation experiments were performed. Stages of the verification carried out by repeating the experiment using the optimum conditions of the medium. The verifi- cation results are then compared with the predicted opti- mum productivity value. Experimental verification data is 227.9 (U/mg biomass) which is still in the 95% CI and PI range. If the verification results are still in the range of CI and PI, it can be concluded that the model obtained is in accordance with the predicted [29, 30]. This results show that the verification was successful, and the equa- tion was adequate to describe lipase productivity by response surface methodology.
Validation of optimum medium and lipase productivity from Z. mellis SG1.2
As shown in Fig. 6, lipase productivity profile from Z.
mellis SG1.2 in basal and optimal medium had almost similar trends, these were lipase productivity at the beginning of the incubation period (12 h) tended to be low and then continuously increased until it reached the optimum point at 48 h of incubation. Lipase productivity continued to decrease after the 48 to 72 h incubation period. This is similar to the study by Kathiravan et al.
[31] reported that the lipase production of Pseudomonas aeruginosa was detected in the late log phase and increased to its optimum production after 48 h of incuba- tion. Another study by Musa et al. [32] explained that lipase secretion was associated with growth and the enzyme concentration reached the highest level in the
Table 5. Comparison between the predicted and experimental productivity values.
Olive oil (%)
Peptone (%)
Lipase productivity (U/mg biomass)
Standard error 95% CI 95% PI
Prediction Experimental
1.02 2.19 217.1 227.9 10.3 192.7; 241.5 157.1; 277.1
late log phase or stationary phase. Decreased extracellu- lar lipase activity may be caused by nutrient depletion and/or accumulation of toxic products that can inhibit enzyme production.
Lipase productivity after optimized increased by 1.8- fold of the basal medium is 128.857 ± 22.916 U/mg bio- mass to 231.992 ± 10.366 U/mg of biomass after 48 h of incubation. The optimum composition of the medium after optimization consists of olive oil 1.02%, peptone 2.19%, MgSO4· 7H2O 0.05%, KCl 0.05% and K2HPO4 0.2%.
Olive oil concentration in the medium after optimiza- tion decreased from the initial concentration of 2% to 1.02%. Research related to the addition of olive oil in lipase production has been widely studied. Nwachukwu et al. [33] who used a variety of vegetable oils in lipase production. The results showed that 1% (v/v) olive oil gave the best results for lipase production by Serratia sp. Other studies that examine various concentrations of olive oil in the fermentation medium to produce halophilic lipase by M. litoralis SW-45 provides the highest yield in the olive oil concentration of 1% (v/v). Excessive lipid concentration leads to the formation of a biphasic system, which prevents the dispersion of oxygen and absorption of nutrients by microorganisms in the culture medium [32].
Peptone concentration in the medium after optimiza- tion decreased from the initial concentration of 3% to 2.19%. The addition of peptone as organic nitrogen sources into the production medium was able to increase lipase production by Pseudomonas sp. LSK25, Aneurini- bacillus thermoaerophilus strain HZ and Bacillus coagulans BTS-3 [34−36]. Nwachukwu et al. [33] stud- ied the effect of variations in peptone concentration (0.5− 4.5%) on Serratia marsecens lipase production and the results showed that the peptone concentration of 2% (w/v) gave the best results. Another study by Freire et al. [37]
reported that the optimum conditions for lipase produc- tion by Penicillium restrictum had a concentration of 2%
meat peptone and 1% olive oil in the fermentation medium. Mates and Sudakevitz [38] reported that increasing the concentration of bactopeptone from 1.5%
to 2%, there was an increase in lipase activity by 61% by Staphylococcus aureus after 48 h of incubation.
In conclusion, optimization of medium production for lipase production by yeast Zygosaccharomyces mellis
SG1.2 had been successfully carried out using a combi- nation of Taguchi and RSM designs. Olive oil and pep- tone were most significant factors on lipase production based on Taguchi analysis and further optimized in RSM. Optimum medium after optimization consists of olive oil 1.02%, peptone 2.19%, MgSO4·7H2O 0.05%, KCl 0.05% and K2HPO4 0.2%. Optimum medium was able to increase 1.8 fold of lipase productivity from Z. mellis SG1.2 compared using basal medium.
Acknowledgments
The experiment of this study was funded by RTA Grant year 2020 (2488/UN1.P.III/DIT-LIT/PT/2020), and the publication was funded by RTA Grant year 2021 (3143/UN1.P.III/DIT-LIT/PT/2021). Both grants were from the Universitas Gadjah Mada, Indonesia.
Conflict of Interest
The authors have no financial conflicts of interest to declare.
References
1. Rekha KSS, Lakshmi MVVC, Devi VS, Kumar MS. 2012. Production and optimization of lipase from Candida rugosa using groundnut oilcake under solid state fermentation. Int. J. Res. Eng. Technol.
1: 571-577.
2. Alami NH, Nasihah L, Umar RLA, Kuswytasari ND, Zulaika E, Shovitri M. 2017. Lipase production in lipolytic yeast from Wonorejo mangrove area. AIP Conf. Proceed. 1854: 1-11.
3. Fan X, Niehus X, Sandoval G. 2012. Lipases as biocatalyst for bio- diesel production. Method. Mol. Biol. 861: 471-483.
4. Ugur A, Sarac N, Boran R, Ayaz B, Ceylan O, Okmen G. 2014. New lipase for biodiesel production: partial purification and charac- terization of LipSB 25-4. ISRN Biochem. 2014: 1-8.
5. Fjerbaek LKV, Christensen, Norddahl B. 2009. A review of the cur- rent state of biodiesel production using enzymatic transesterifi- cation. Biotechnol. Bioeng. 102: 1298-1315.
6. Lanka S, Latha JNL. 2015. Taguchi design of experiments for the optimization of lipase production by Emericella nidulans DAOM 222012 isolated from palm oil mill effluent (pome) dump sites.
Int. J. Appl. Bio. Pharm. Technol. 6: 64-72.
7. Thakur S. 2012. Lipases, its sources, properties and applications: a review. Int. J. Sci. Eng. Res. 3: 1-29.
8. Galvagno MA, Iannone LJ, Bianchi J, Kronberg F, Rost E, Carstens MR, et al. 2011. Optimization of biomass production of mutant of Yarrowia lypolitica with an increased lipase activity using raw glycerol. Rev. Argentina de Microbiol 43: 218-225.
9. Oliveira F, Souza CE, Peclat VROL, Salgado JM, Ribeiro BD, Coelho MAZ, et al. 2017. Optimization of lipase production by Aspergillus ibericus from oil cakes and its application in esterification reac-
tion. Food Bioprod. Process 2017: 1-39.
10. Azeredo LAI, Gomes PM, SantÕAnna GL, Castilho LR, Freire DMG.
2007. Production and regulation of lipase activity from Penicillium restrictum in submerged and solid-state fermentations. Curr.
Microbiol. 54: 361-365.
11. Palilu PT, Kasiamdari RS, Ilmi M. 2019. Potential yeast from Indo- nesian wild forest honey showing ability to produce lipase for lipid transesterification. Microbiol. Biotechnol. Lett. 47: 555-564.
12. Corzo G, Revah S. 1999. Production and characteristics of the lipase from Yarrowia lipolytica 681. Bioresour. Technol. 70: 173- 180.
13. Bhosale HJ, Uzma SZ, Bismile PC. 2015. Optimization of lipase production by thermo-alkalophilic Bacillus sp. 8C. Res. J. Microbiol.
10: 523-531.
14. Colla LM, Primaz AL, Benedetti S, Loss RA, de Lima M, Reinehr CO, et al. 2016. Surface response methodology for the optimization of lipase production under submerged fermentation by filamen- tous fungi. Braz. J. Microbiol. 47: 461-467.
15. Heravi MK, Eftekhar F, Yakhchali B, Tabandeh F. 2008. Isolation and identification of a lipase producing Bacillus sp. from soil.
Pakistan J. Biol. Sci. 11: 740-745.
16. Burkert JFM, Maugeri F, Rodrigues MI. 2004. Optimization of extracellular lipase production by Geotrichum sp. using factorial design. Bioresour. Technol. 91: 77-84.
17. Kwon DY, Rhee JS. 1986. A simple and rapid colorimetric method for determination of free fatty acids for lipase assay. J. Am. Oil Chem. Soc. 63: 89-92.
18. Shukla BN, Desai PV. 2016. Isolation, characterization and optimi- zation of lipase producing Pseudomonas spp. from oil contami- nated sites. Int. J. Curr. Microbiol. Appl. Sci. 5: 902-909.
19. Adham NZ, Ahmed EM. 2009. Extracellular lipase of Aspergillus niger NRRL3: production, partial purification and properties.
Indian J. Microbiol. 49: 77-83.
20. Tan T, Zhang M, Xu J, Zhang J. 2004 Optimization of culture con- ditions and properties of lipase from Penicillium camembertii Thom PG-3. Process Biochem. 39: 1495-1502.
21. Soleymani S, Alizadeh H, Mohammadian H, Rabbani E, Moazen F, Sadeghi HMM, et al. 2017. Efficient media for high lipase produc- tion: one variable at a time approach. Avicenna J. Med. Biotechnol.
9: 82-86.
22. Kumar DJM, Rajan R, Priyadarshini S, Lawrence L, Sandhiyachitty- babu, Kalaichelvan PT. 2012. Characterization of lipase and pro- tease from Serratia marcescens DEPTK21 and its destaining capability. Asian J. Exp. Biol. Sci. 3: 621-628.
23. Trismilah P, Sarnianto, Wahjono E. 2016. Optimization of lipase production by Bacillus licheniformis F11.4 using response surface methodology. Microbiol. Indonesia 10: 139-148.
24. Alam MZ, Elgharbawy AA, Salleh HM. 2013. Optimization and characterization of Candida cylindracea lipase produced from palm kernel cake by solid-state bioconversion. AIChE Ann. Meet.
2013: 1-7.
25. Keshani S, Chuah AL, Nourouzi MM, Russly AR, Jamilah B. 2010.
Optimization of concentration process on pomelo fruit juice using response surface methodology (RSM). Int. Food Res. J. 17:
733-742.
26. Nurmiah S, Syarief R, Sukarno, Peranginangin R, Nurtama B. 2013.
Application of response surface methodology in the optimiza- tion of process conditions of alkali treated cottonii (ATC) process- ing. JPB Kelautan dan Perikanan 8: 9-22.
27. Kumari KS, Babu IS, Rao GH. 2008. Process optimization for citric acid production from raw glycerol using response surface meth- odology. Indian J. Biotech. 1: 496-501.
28. Raissi S, Farzani RE. 2009. Statistical process optimization through multi-response surface methodology. World Acad. Sci.
Eng. Technol. 1: 267-271.
29. Prabudi M, Nurtama B, Purnomo EH. 2018. Aplication of response surface methodology (RSM) using historical data on optimation burger production process. J. Mutu Pangan 5: 109- 115.
30. Noordin MY, Venkatesh VC, Sharif S, Elting S, Abdullah A. 2004.
Application of response surface methodology in describing the performance of coated carbide tools when turning AISI 1045 steel. J. Mater. Process Technol. 145: 46-58.
31. Kathiravan T, Marykala J, Sundaramanickam A, Kumaresan S, Balasubramanian T. 2012. Studies on nutritional requirements of Pseudomonas aeruginosa for lipase production. Adv. Appl. Sci. Res.
3: 591-598.
32. Musa H, Kasim FH, Gunny AAN, Gonipath SCB, Ahmad MA. 2019.
Enhanced halophilic lipase secretion by Marinobacter litoralis SW-45 and its potential fatty acid esters release. J. Basic Microbiol.
59: 87-100.
33. Nwachukwu E, Ejike EN, Ejike BU, Onyeanula EO, Chikezie-Abba RO, Okorocha NA, et al. 2017. Characterization and optimization of lipase production from soil microorganism (Serratia marcescens).
Int. J. Curr. Microbiol. App. Sci. 6: 1215-1231.
34. Salwoom L, Rahman RNZRA, Salleh AB, Shariff FM, Convey P, Pearce D, et al. 2019. Isolation, characterisation, and lipase pro- duction of a cold-adapted bacterial strain Pseudomonas sp.
LSK25 isolated from Signy Island, Antarctica. Molecules 24: 715.
35. Rahman R, Masomian M, Salleh A, Basri M. 2009. A new thermo- stable lipase by Aneurinibacillus thermoaerophilus strain HZ:
nutritional studies. Ann. Microbiol. 59: 133-139.
36. Kumar S, Kikon K, Upadhyay A, Kanwar SS, Gupta R. 2005. Pro- duction, purification, and characterization of lipase from thermo- philic and alkaliphilic Bacillus coagulans BTS-3. Protein Expr. Purif.
41: 38-44.
37. Freire DM, Teles EMF, Bon EPS, Anna GLS. 1997. Lipase produc- tion by Penicillium restrictum in a bench-scale fermenter effect of carbon and nitrogen nutrition, agitation, and aeration. Appl.
Biochem. Biotechnol. 63-65: 409-421.
38. Mates A, Sudakevitz D. 1973. Production of lipase by Staphylo- coccus aureus under various growth conditions. J. Appl. Bacteriol.
36: 219-226.