Effect of Jaeumgeonbigagamtang (JGT) on Restraint-induced Oxidative Stress in Mouse Brain
Jung-Hun Yoon, Joung-Jo An, Hyun-Kyung Jo, Chang-Gue Son, Yoon-Sik Kim, In-Chan Seol, Ho-Rhyong Yoo
11Department of Oriental Internal Medicine, CollegeofOrientalMedicine,DaejeonUniversity Original Article
⋅Received:16 August 2011 ⋅Revised:26 September 2011 ⋅Accepted:26 September 2011
⋅Correspondence to:Ho-Rhyong Yoo
1136 Dunsan-Dong, Seo-gu, Daejeon 302-830
Tel:+82-42-470-9131, Fax:+82-42-470-9005, Email:[email protected]
Objectives: This study was performed to investigate the effect of Jaeumgeonbigagamtang (JGT) onrestraint-induced oxidative stress in the mouse brain.
Methods: After treatment with JGT, CBC, ROS, MDA, TAC, SOD, activity of catalase, and total GSH content were analyzed.
Results: JGT had a strong antioxidant activity by in vitro assay as presented GEAC. JGT treatment significantly ameliorated decrease of blood WBC and increase of platelet count. JGT (50㎎/㎏) treatment significantly ameliorated increase of MDA and GSH content level in brain tissue. JGT (100㎎/㎏) treatment significantly ameliorated increase of MDA and activity of TAC level in brain tissue. JGT (200㎎/㎏) treatment significantly ameliorated increase of ROS, MDA, activity of TAC level and depletion of catalase level in brain tissue.
Conclusion: The present study demonstrated antioxidant activity in brain tissue. This result would be consistent with the long clinical efficacy of JGT, and this finding may provide a strong possibility of JGT as a drug candidate for brain-specific multiple disorders and symptoms.
Key Words : Jaeungeonbigagamtang (JGT), oxidative stress, antioxidant activity, malondialdehyde (MDA)
Introduction
With a rapidly aging society, degenerative brain diseases and brain vascular disorders such as dementia, Alzheimer's disease, Parkinson's disease, and stroke become abundant
1,2). These brain illnesses induce impairment in psychological and physical activity of their victims, and raise serious social troubles of economic cost and total dependency in their final years
3,4). So, there are urgent requirements to identify effective prevention and treatment strategies for these degenerative brain diseases.
On the other hand, oxidative stress has been thought to be linked to neurodegeneration and brain
injury
5,6). Oxidative stress represents an imbalance status between the production of reactive oxygen species (ROS) and a capacity to readily detoxify the reactive intermediates, and this condition cause toxic effects resulting in damage of all cellular components, including proteins, lipids, and DNA
7). Therefore, many studies have focused on inhibition of oxidative stress to obtain neuroprotective actions
8,9).
Many traditional herbal medicines have been also
studied for their neuroprotective effects related to the
antioxidant properties of drug candidates. Tanshinone
IIA (Tan IIA), an active compound of Salvia mil-
tiorrhiza Bunge, showed a protective effect against
cortical neuron cells via antioxidant activity
10).
Scientific name Part used Amount (g) Composition rate (%)
Gastrodia elata Rhizoma 6 13.8
Adenophora triphylla Radix 6 13.8
Atractylis japonica Rhizoma 3 6.9
Citrus unshiu Unshii 2 4.6
Pinellia ternata Rhizoma 2 4.6
Poria cocos sclerotum 2 4.6
Paeonia albiflora Radix 2 4.6
Rehmannia glutinosa Radix 2 4.6
Angelica gigas Radix 2 4.6
Liriope platyphylla Tuber 2 4.6
Zingiber officinale Rhizoma 2 4.6
Ledebouriella seseloides Radix 2 4.6
Mentha arvensis Herba 0.1 0.2
Zizyphus jujuba Fructus 2 4.6
Cnidium officinale Rhizoma 2 4.6
Schizonepeta tenuifolia Herba 2 4.6
Polygala tenuifolia Radix 1.5 3.4
Poria cocos Radix 1.5 3.4
Glycyrrhiza uralensis Fisch Radix 1.5 3.4
Total amount 43.6 100
Table 1. Composition of Jaeungeonbigagamtang (JGT)
Artemisia absinthium was demonstrated to have pharmaceutical effects on cerebral oxidative stress and damage, and behavioral disturbances induced by cerebral ischemia and reperfusion injury in rats
11).
Jaeumgeonbitang is a traditional herbal formula which is composed of fifteen herbal plants. This drug has been clinically prescribed to patients suffering from symptoms of dizziness and anxiety
12). So far, several studies have reported on the phar- maceutical effects of Jaeumgeonbitang using animal models such as sedative action and hematosis, indomethacin-induced gastritis, and learning test
13-15). Jaeumgeonbitang or modified-Jaeumgeonbitang im- proved brain circulation
16,17).
Jaeumgeonbigagamtang (JGT) is a new herbal formula composed of nineteen medicinal herbs. JGT has been prescribed for patients with various range of dizziness in Oriental Hospital of Daejeon University since 2000, and its clinical efficacy on 70 patients
with dizziness was reported
18). However, no study had been performed to study its antioxidant effect.
In order to support the underlying mechanisms of clinical effect of JGT on brain disorders, the present study investigated the antioxidant activity of JGT in brain tissue using a restraint-rat model.
Materials and Methods
1. Composition of Jaeumgeonbigagamtang (JGT)
JGT is composed of nineteen medicinal herbs
(Table 1.). The manufacturing process for JGT follows
the process given in over-the-counter Korean mono-
graphs by Hanpoong Pharmacy (Seoul, Korea). Briefly,
the nineteen herb mixture was boiled in distilled
water for 4 hours at 100℃, then filtered using a
300-mesh filter (50μM) and then condensed. We
obtained a 23% (w/w) lyophilized JGT aqueous
extractions from the dried mixture, and stored it
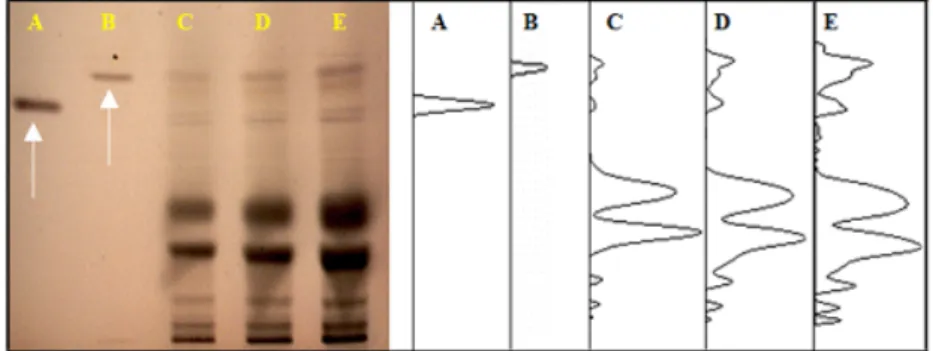
Figure 1. HP-TLC-based fingerprint of JGT.
HP-TLC analysis was performed to produce the fingerprint of JGT. 5㎍ ginsenoside Rg1 (A), ginsenoside Rg3 (B), JGT 50㎍/㎕ (C), JGT 100㎍/㎕ (D), and JGT 200㎍/㎕ (E) were subjected to HP-TLC.
under -70℃ until use.
2. High performance-thin layer chromatography (HP- TLC)-based fingerprinting
In order to produce the fingerprint of JGT, the HP-TLC procedure was adapted using the CAMAG application system (Muttenz, Switzerland). Aqueous extracts of JGT, and ginsenoside Rg1 and Rg3 as control, were dissolved in HPLC-grade methanol and applied to pre-washed 60 F
254HP-TLC plates (silica gel thickness 2㎜, from Merck, Darmstadt, Germany) with an automated applicator (Linomat IV;
CAMAG). JGT were separated (migration distance 65㎜) using HPLC-grade chloroform:ethyl acetate:
methanol:water=17:46:25:12 and then were visualized under white light after derivatization with 10%
sulfuric acid solution. Photos were taken using Reprostar 3 with a digital camera and densitograms were generated (Fig. 1.).
3. Determination of total antioxidant capacity (TAC) of JGT in vitro
TAC of JGT in vitro was determined according to the modified Kambayashi method
19). 90㎕ of 10mM phosphate-buffered saline (㏗ 7.2), 50㎕ of myoglobin solution (45μM), 20㎕ of 3mM ABTS solution, and serially diluted JGT (5㎍ to 1,000㎍/㎖) sample were
added to 96-well microplates and mixed well at 25℃.
Then 20㎕ of H
2O
2was added to each well, and incubated for 5 minutes. The absorbance was read using a plate reader at 600㎚ (Molecular Device Corp, USA). Gallic acid was used as a control and antioxidant activity was expressed as gallic acid equivalent antioxidant capacity (GEAC).
4. Animals and experimental design
Specific pathogens free six-week old BALB/c male mice were purchased from a commercial animal breeder (Coatech, Gyeongido, Korea). 35 animals were acclimated for 1 week and housed in an environment- controlled room at 22±2℃, on a 12 hours light/dark cycle, and provided commercial pellets (Samyang Feed Co., Korea) and tap water ad libitum. The experiments were designed and performed in strict accordance with the regulations for laboratory animal care (NIH publication No. 85-23, revised 1985) and were approved by the Institutional Animal Care and Use Committee of Daejeon University (animal ethical clearance number: DJUARB 2010-065).
35 animals were divided into 5 groups; normal,
induced, JGT 50, JGT 100, and JGT 200㎎/㎏ group,
with 7 mice in each group, respectively. Except the
normal group, four groups were orally administrated
with 50, 100, 200㎎/㎏ of JGT or water daily for 5
days, and then each animal was completely tied down on the wire rack for 6 hours in order for induction of severe stress. All animals were sacrificed by whole blood collection from abdominal aorta under ether anesthesia. The cerebrum was removed and frozen in a deep-freezer.
5. Observation of complete blood count (CBC) Blood was collected from the abdominal aorta of each mouse and complete blood count was analyzed by blood cell counter (HEMAVET; CDC Technologies, Irvine, CA, USA).
6. Oxidative stress-related parameters in brain tissue
1) Determination of total reactive oxygen species (ROS)
Total ROS level in brain tissue were determined according to the method of Hayashi
20). Briefly, 100㎎
of brain tissue was homogenized with RIPA buffer and centrifuged at 10,000 × g for 15 minutes at 4℃.
The supernatants fraction was removed into a clean tube and diluted with 10mM phosphate-buffered saline (㏗ 7.2). Hydrogen peroxide was used for generating the calibration curve as standard. DEPPD solution and ferrous sulfate solution (100㎍/㎖ of DEPPD and 4.37㎛ of ferrous sulfate was dissolved in the 0.1M sodium acetate buffer separately) were prepared beforehand. Five microliters of standard solution or 1:10 diluted liver homogenate supernatant were added to 140㎕ of 0.1M sodium acetate buffer (㏗
4.8) in each well of 96-well plates. After 5 minutes incubation at 37℃, 100㎕ of DEPPD and ferrous mixture solution (scale factor of 1/25 was used) were added to each well. The level of ROS was determined at 505㎜ using a spectrophotometer with catalytic capability for transition metals, and calculated as equivalent to levels of hydrogen peroxide (1 unit = 1㎎
H2O2/ℓ).
2) Determination of malondialdehyde (MDA) Lipid peroxidation levels in the brain tissue were determined using the method of thiobarbituric acid reactive substances (TBARS)
21). The concentration of TBARS was expressed as uM MDA/g tissue using 1.1.3.3-tetraethoxypropane (TEP) as a standard. Briefly, 0.2g brain tissue was homogenized in 2㎖ ice-cold 1.15% KCl, and 0.13㎖ homogenate was mixed with 0.08㎖ 1% phosphoric acid and 0.26㎖ 0.67% thiobar- bituric acid (TBA). After heating the mixture for 45 minutes in a dry oven (100℃), 1.03㎖ n-butanol was added followed by a vigorous vortexing and centrifu- gation at 3,000rpm for 15 minutes. The absorbance of upper organic layer was measured at 535 and 525㎚
with a spectrophotometer and compared with TEP standard curve.
3) Determination of total antioxidant capacity(TAC) TAC levels were determined according to the method of Kambayashi
19). Briefly, 100㎎ of brain tissue was homogenized with RIPA buffer and centrifuged at 10,000 × g for 15minutes at 4℃. The supernatants fraction was removed into a clean tube and diluted with 10mM phosphate-buffered saline (㏗ 7.2). Ninety microliters of PBS was added to 96-well micro plates and 50㎕ of myoglobin solution (45uM), 20㎕ of 3mM ABTS solution, 20㎕ of diluted homogenized samples, and gallic acid were added to 96-well microplates and mixed well at 25℃ for 3 minutes.
Then 20㎕ of H
2O
2was added to each well, and incubated for 5 minutes. The absorbance was read using a plate reader at 600㎚ (Molecular Device Corp., USA). The level of TAC was expressed as GEAC.
4) Determination of activity of superoxide dismutase (SOD)
Briefly, 100㎎ brain tissue was homogenized with
RIPA buffer and centrifuged at 10,000 × g for 15
minutes at 4℃. The supernatant fraction was transferred
into a clean tube, and used to determine the SOD
Gallicacid equivalent antioxidant capacity 400
350 300 250 200 150 100 50
0 1000 500 250 100 50 25 10 5
JGT (㎍/mL)
Fig. 2. TAC of JGT.
Antioxidant capacity of JGT was determined using in vitro assay, and expressed as GEAC.
activity. SOD activity in the brain tissue was deter- mined using an SOD assay kit (Dojindo Laboratories, Kumamoto, Japan). Bovine erythrocyte SOD (Sigma) was diluted serially from 100 to 0.001U/㎖ and used as a standard.
5) Determination of activity of catalase
Catalase activity in the brain tissue was determined using the method of Beers and Siezer
22). Briefly, 100㎎
brain tissue was homogenized with RIPA buffer and centrifuged at 10,000 × g for 15 minutes at 4℃. The supernatant fraction was transferred into a clean tube, and used to determine the catalase activity. The supernatant or standard solution (100㎕) were mixed with 2.9㎖ of substrate solution (0.0036% hydrogen peroxide), followed by measurement of the absorbance at 240㎚ after 5 minutes.
6) Determination of total glutathione (GSH) content Total GSH content was determined according to the method of Ellman
23). Briefly, 100㎎ brain tissue was homogenized with RIPA buffer and centrifuged at 10,000 × g for 15 minutes at 4℃. The supernatant fraction was transferred into a clean tube. Duplicate 50㎕ aliquots of the supernatant (or GSH standard) were combined with 80㎕ of a previously prepared DTNB/NADPH mixture (10㎕ 4mM DTNB and 70㎕
0.3mM NADPH) in a 96-well plate. Finally, 20㎕
(0.06U) of GSH reductase solution was added to each well and the absorbance was measured at 405㎚
after 5 minutes.
7. Statistic analysis
Results were expressed as the mean ± standard deviation (S.D.). Statistical analysis of the data was carried out by Student’s t-test. A difference from the respective control data at the levels of p<0.05 were regarded as statistically significant.
Results
1. Total antioxidant capacity (TAC) of JGT
In order to examine the antioxidant capacity of JGT, TAC was determined using in vitro assay. When the value was expressed as GEAC, the capacity of JGT showed a very high GEAC value from the lowest volume 5㎍ (110.6μM GEAC) to the highest volume 1,000㎍ (325.4μM GEAC) of A. capillaris respectively (Fig. 2.).
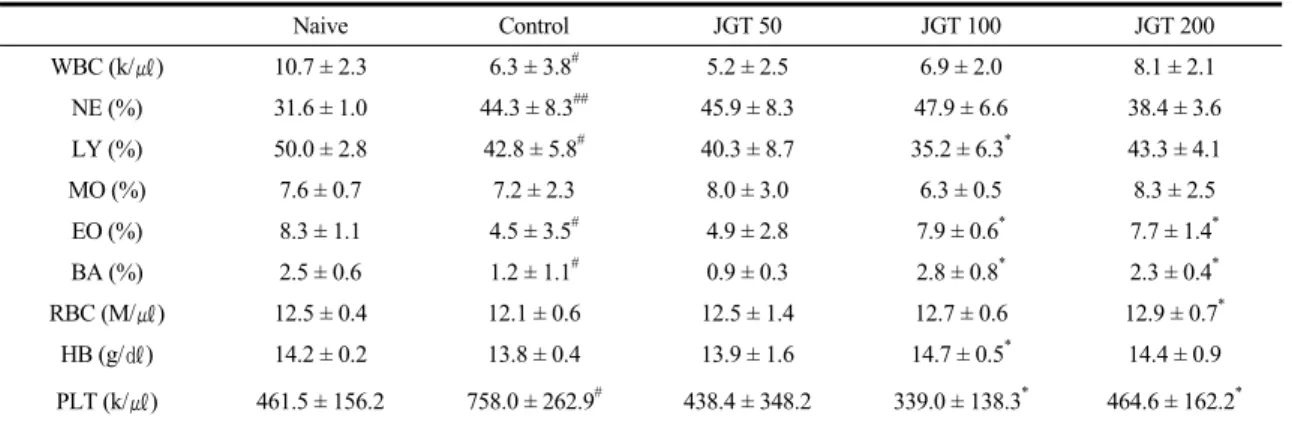
2. Change of complete blood count (CBC)
On the final day, hematological parameters were
measured (Table 2.). 6 hours of restraint stress signi-
Naive Control JGT 50 JGT 100 JGT 200
WBC (k/㎕) 10.7 ± 2.3 6.3 ± 3.8# 5.2 ± 2.5 6.9 ± 2.0 8.1 ± 2.1
NE (%) 31.6 ± 1.0 44.3 ± 8.3## 45.9 ± 8.3 47.9 ± 6.6 38.4 ± 3.6
LY (%) 50.0 ± 2.8 42.8 ± 5.8# 40.3 ± 8.7 35.2 ± 6.3* 43.3 ± 4.1
MO (%) 7.6 ± 0.7 7.2 ± 2.3 8.0 ± 3.0 6.3 ± 0.5 8.3 ± 2.5
EO (%) 8.3 ± 1.1 4.5 ± 3.5# 4.9 ± 2.8 7.9 ± 0.6* 7.7 ± 1.4*
BA (%) 2.5 ± 0.6 1.2 ± 1.1# 0.9 ± 0.3 2.8 ± 0.8* 2.3 ± 0.4*
RBC (M/㎕) 12.5 ± 0.4 12.1 ± 0.6 12.5 ± 1.4 12.7 ± 0.6 12.9 ± 0.7*
HB (g/㎗) 14.2 ± 0.2 13.8 ± 0.4 13.9 ± 1.6 14.7 ± 0.5* 14.4 ± 0.9
PLT (k/㎕) 461.5 ± 156.2 758.0 ± 262.9# 438.4 ± 348.2 339.0 ± 138.3* 464.6 ± 162.2*
Data are expressed as mean ± S.D.
##: p < 0.01 and #: p < 0.05, significant differences compared with the normal group.
**: p < 0.01 and *: p < 0.05, significant differences compared with the induced group.
Table 2. Comparison of Hematological Parameters
1500
1200
900
600
300
0
Total reactiver oxygen species
Naive Induced 50 100 200
JGT (㎍/mL) (Unit/mg)
#
Fig. 3. Brain total ROS level.
Mice were pre-treated with water, JGT (50, 100, 200㎎/㎏) before restraint stress. On the last day of the experiment, total ROS level in brain tissue was determined. Data are expressed as mean ± S.D. #: p < 0.05, significant differences compared with the naive group. *: p < 0.05, significant differences compared with the induced group.
ficantly decreased the number of total white blood cells (WBC) compared with the naive group. In the compositional ratio of 5 white blood populations, neutrophils significantly increased while lymphocyte, eosinophil, and basophil decreased compared to the naive group. The number of platelets significantly increased in the control group compared to the naive group. Pre-treatment with JGT significantly ameliorated these changes; eosinophil, basophil, and platelet counts in the 100 and 200㎎/㎏ groups.
3. Change of total reactive oxygen species (ROS) On the last day of the experiment, total ROS levels in rat brain were compared among groups. 6 hours of restraint stress significantly increased total ROS level compared to the naive group (p<0.05). Pre- treatment with JGT (200㎎/㎏) significantly ameliorated the increase of ROS compared to the control (p<
0.05, Fig. 3.).
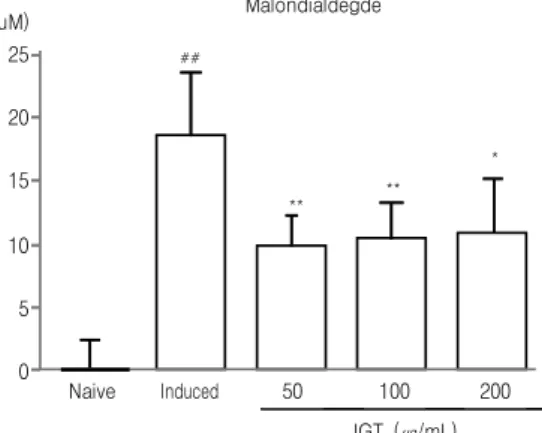
4. Change of malondialdehyde (MDA)
On the last day of the experiment, MDA levels in
25
20
15
10
5
0
Malondialdegde
Naive Induced 50 100 200
JGT (㎍/mL) (uM)
##
**
**
*
Fig. 4. Brain malondialdehyde level.
Mice were pre-treated with water, JGT (50, 100, 200㎎/㎏) before restraint stress. On the last day of the experiment, total malondialdehyde level in brain tissue was determined. Data are expressed as mean ± S.D. ##: p < 0.01, significant differences compared with the naive group. **: p < 0.01, *: p < 0.05, significant differences compared with the induced group.
250
200
150
100
50
0
Gallicacid equivalent antioxidant capacity
Naive Induced 50 100 200
JGT (㎍/mL) (uM)
Fig. 5. Brain total antioxidant capacity.
Mice were pre-treated with water, JGT (50, 100, 200㎎/㎏) before restraint stress. On the last day of the experiment, total TAC level as GEAC in brain tissue was determined. Data are expressed as mean ± S.D. *: p < 0.05, significant differences compared with the induced group.
rat brain were compared among groups. 6 hours of restraint stress drastically increased total MDA level compared to the naive group (p<0.01). Pre-treatment with JGT (50, 100, 200㎎/㎏) significantly ameliorated this increase of MDA compared to the control (p<
0.01 or 0.05, Fig. 4).
5. Change of total antioxidant capacity (TAC) On the last day of the experiment, total TAC levels in rat brain were compared among groups as
GEAC. 6 hours of restraint stress significantly didn't change total TAC level compared to the naive group.
Pre-treatment with JGT (100, 200㎎/㎏) significantly increased the TAC level compared to the control (p<0.05, Fig. 5).
6. Change of activity of superoxide dismutase (SOD)
On the last day of the experiment, SOD levels in rat brain were compared among groups. 6 hours of
*
*
200
150
100
50
0
Superoxide dismutase
Naive Induced 50 100 200
JGT (㎍/mL) (Unit/mg)
Fig. 6. Brain SOD level.
Mice were pre-treated with water, JGT (50, 100, 200㎎/㎏) before restraint stress. On the last day of the experiment, total SOD level in brain tissue was determined. Data are expressed as mean ± S.D.
25
20
15
10
5
0
Catalase
Naive Induced 50 100 200
JGT (㎍/mL) (Unit/mg)
##
*
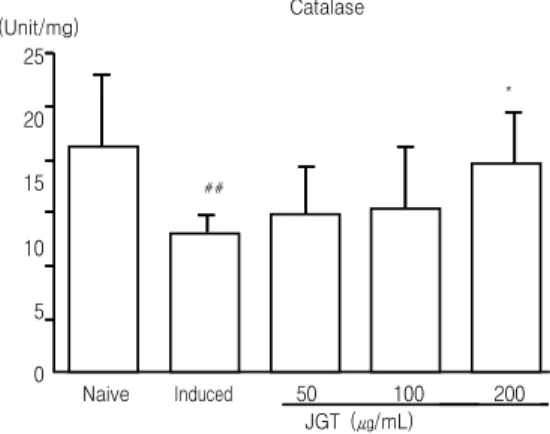
Fig. 7. Brain catalase level.
Mice were pre-treated with water, JGT (50, 100, 200㎎/㎏) before restraint stress. On the last day of the experiment, catalase level in brain tissue was determined. Data are expressed as mean ± S.D. ##: p < 0.01, significant differences compared with the naive group. *: p < 0.05, significant differences compared with the induced group.
restraint stress didn't induce any change of SOD level compared to the naive group. Pre-treatment with JGT also didn't affect the level of SOD activity in brain compared to the control (Fig. 6.).
7. Change of activity of catalase
On the last day of the experiment, catalase levels in rat brain were compared among groups. 6 hours of restraint stress significantly depleted total catalase level compared to the naive group (p<0.01). Pre- treatment with JGT (200㎎/㎏) significantly ameliorated
the decrease of catalase level compared to the control (p<0.05, Fig. 7.).
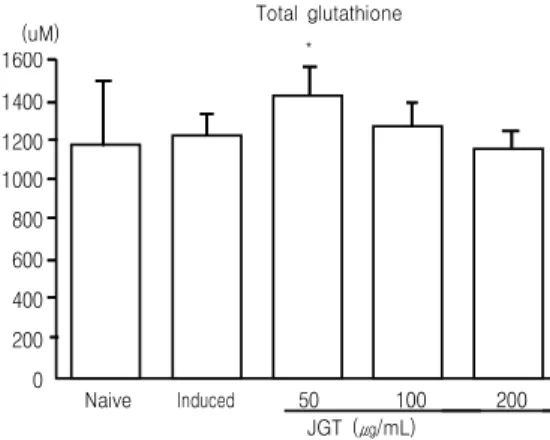
8. Change of total glutathione (GSH) content On the last day of the experiment, total GSH content levels in rat brain were compared among groups. 6 hours of restraint stress didn't affect total GSH content levels compared to the naive group.
Pre-treatment with JGT (50㎎/㎏) significantly in-
creased the GSH content levels compared to the
control (p<005.Fig. 8.).
1600 1400 1200 1000 800 600 400 200 0
Total glutathione
Naive Induced 50 100 200
JGT (㎍/mL)
(uM) *
Fig. 8. Brain total GSH level.
Mice were pre-treated with water, JGT (50, 100, 200㎎/㎏) before restraint stress. On the last day of the experiment, total GSH content level in brain tissue was determined. Data are expressed as mean ± S.D. *: p < 0.05, significant differences compared with the induced group.