Electrode Position and the Clinical Outcome after Bilateral Subthalamic Nucleus Stimulation
We compared the surgical outcome with electrode positions after bilateral subthalamic nucleus (STN) stimulation surgery for Parkinson’s disease. Fifty-seven patients treated with bilateral STN stimulations were included in this study. Electrode positions were determined in the fused images of preoperative MRI and postoperative CT taken at six months after surgery. The patients were divided into three groups: group I, both electrodes in the STN;
group II, only one electrode in the STN; group III, neither electrode in the STN. Unified Parkinson’s Disease Rating Scale (UPDRS), Hoehn and Yahr stage, and activities of daily living scores significantly improved at 6 and 12 months after STN stimulation in both group I and II. The off-time UPDRS III speech subscore significantly improved (1.6 ± 0.7 at baseline vs 1.3 ± 0.8 at 6 and 12 months, P < 0.01) with least L-dopa equivalent daily dose (LEDD) (844.6 ± 364.1 mg/day at baseline; 279.4 ± 274.6 mg/day at 6 months; and 276.0 ± 301.6 mg/day at 12 months, P < 0.001) at 6 and 12 months after STN deep brain stimulation (DBS) in the group I. Our findings suggest that the better symptom relief including speech with a reduced LEDD is expected in the patients whose electrodes are accurately positioned in both STN.
Key Words: Parkinson Disease; Bilateral STN Stimulation; Clinical Outcome; Electrode Position; Fused Images
Sun Ha Paek1,2,5,6,7, Jee-Young Lee1,3, Han-Joon Kim1,3, Daehee Kang4, Yong Hoon Lim1, Mi Ryoung Kim1, Cheolyoung Kim8, Beom Seok Jeon1,3,5 and Dong Gyu Kim1,2
1Movement Disorder Center and Clinical Research Institute, Seoul National University Hospital, Seoul;
Departments of 2Neurosurgery and 3Neurology, Seoul National University Hospital, Seoul;
4Department of Preventive Medicine, Seoul National University College of Medicine, Seoul;
5Neuroscience Research Institute, 6Ischemia Hypoxia Disease Institute and 7Cancer Research Institute, Seoul National University College of Medicine, Seoul; 83D Medical Imaging Lab, CyberMed, Seoul, Korea
Received: 21 March 2011 Accepted: 29 August 2011 Address for Correspondence:
Beom Seok Jeon, MD
BK21, Seoul National University College of Medicine, Department of Neurology, Seoul National University Hospital, 101 Daehak-ro, Jongno-gu, Seoul 110-744, Korea Tel: +82.2-2072-2876, Fax: +82.2-3672-7553 E-mail: brain@snu.ac.kr
This work was supported by a grant of the Korea Healthcare technology R&D Project, Ministry for Health, Welfare and Family Affairs, Republic of Korea (A092052-0911-0000100).
http://dx.doi.org/10.3346/jkms.2011.26.10.1344 • J Korean Med Sci 2011; 26: 1344-1355 Neuroscience
INTRODUCTION
The subthalamic nucleus (STN) stimulation has become the preferred treatment for the patients with advanced Parkinson’s disease (PD) who have intolerable drug-induced side effects or motor complications following the long-term use of dopaminer- gic drugs (1, 2). The precise positioning of the electrodes into the STN is important for the good clinical outcome after surgery (2). Many approaches including image fusion of CT-MRI, MRI- MRI, and MRI-brain atlas as well as intraoperative microelec- trode recording and stimulation have been practiced for the pre- cise targeting of electrodes (3-7).
However, not all the patients have their electrodes positioned exactly in the STN after surgery. Therefore clinical outcome may differ according to the electrode positions. Possible brain shift due to cerebrospinal fluid (CSF) leakage (8-10), electrode arti- facts in the MRI (11), and possible electrode bending during the
surgery may make it difficult to precisely localize the center of the electrodes at a short-term period after surgery (8-11). Thus it is reasonable to estimate the electrode positions at a stable period after surgery. However, little has been written in the lit- erature on the clinical outcome and the electrode position esti- mated at a stable period after surgery.
Previously we compared the clinical outcomes at 3 and 6
months after bilateral STN stimulation with the electrode posi-
tions estimated by the fused images of the pre- and post-opera-
tive MRI taken at 6 months by using mutual information tech-
nique (12). During the study period we noted that the center of
the electrode’s MRI artifact in the postoperative MRI was differ-
ent from the center of electrode estimated by the postoperative
CT. Therefore we compared the outcomes at 6 and 12 months
after bilateral STN stimulation depending on electrode positions
identified in the fused images of the preoperative MRI and the
postoperative CT taken at six months after surgery.
MATERIALS AND METHODS
PatientsFifty-seven patients with advanced PD who had been treated with bilateral STN stimulation between March 2005 and Octo- ber 2006 and followed up more than one-year at the Movement Disorder Center of Seoul National University Hospital (SNUH) were enrolled in this study. The indications of bilateral STN stim- ulation were advanced PD with at least two cardinal features of parkinsonism, a good response to levodopa, drug-induced side effects such as dyskinesia, or motor fluctuation, and the unsat- isfactory management with medication. Patients with severe cognitive impairment, ongoing psychiatric problems, an unsat- isfactory general condition for surgery, or an inability to comply with the study protocol, were excluded.
Clinical evaluation
The patients were evaluated with the use of the Unified Parkin- son Disease Rating Scale (UPDRS), Hoehn and Yahr (H&Y) Stage, Schwab and England Activities of Daily Living (SEADL), the Short Form-36 Health Survey (SF-36), and neuropsychological tests (the detailed items were described elsewhere) (13). Evalu- ations were performed before surgery, at 6 and 12 months after surgery, and then every year. The neurological evaluations were performed by two neurologists. Patients were assessed in two conditions; off- (12-hr medication off) and on-medication (1 to 3 hr after usual morning dose) conditions. The daily levodopa equivalent dose (LEDD) was computed as described elsewhere (12). The clinical information of the 57 patients is summarized in Table 1.
Surgical procedure
In all cases, a stereotactic Leksell
®-G frame (Elekta Instruments AB, Stockholm, Sweden) was mounted on the head of a patient under local anesthesia. Brain images were acquired on a 1.5-T Signa system (General Electric Medical System, Milwaukee, WI, USA). The STNs were localized by a combination of direct visu- alization by MRI, microelectrode recording (MER), and stimu- lation technique as previously described elsewhere (12). The quadripolar chronic electrodes (DBS 3389, Medtronic, Minne- apolis, MN, USA) were indwelled under the local anesthesia and the implantable pulse generators (IPG) were then implanted sub- cutaneously under the general anesthesia in a single session.
Electrical stimulation was started one day after surgery. The stimulation parameters and medications were progressively ad- justed using an N’vision
®programmer (Medtronic) (12).
Adjustment after bilateral STN stimulation
An examination of the effectiveness and side effects of the four contacts of the electrodes was performed using an N’vision
®pro- grammer (Medtronic) in all patients to select the best contact of
the electrodes and electrical settings for chronic stimulation by neurologists. After turning on the minimal stimulation starting at the lowest level around 1.0 volts, the medication and stimula- tion parameter were optimized to the demand for the best status of motor functions in harmony with the DBS programming.
Image fusion of preoperative MRI and postoperative CT
Three-dimensional (3-D) spiral stereotactic CT scans (64-chan- nel Brilliance CT, Philips, Eindhoven, Netherlands) with a 1 mm slice thickness were taken 6 months after bilateral STN stimula- tion to localize the electrodes by image fusion with preoperative MRI by using mutual information techniques (Fig. 1) (12, 14-18).
With CT-MRI image fusion, the electrodes positions were plotted on the human brain atlas of Schaltenbrand and Wahren (19). In brief, the lateral distance from the midline and the antero-pos- terior distance from the mid-commissural line to each electrode were measured in the reformatted axial images (Fig. 1A). The lateral angles of the electrode trajectory from the midline, and the antero-posterior angle of the electrode trajectory from the line perpendicular to the anterior (AC) - posterior commissural (PC) line and the depth of the electrodes are also measured in the reformatted coronal (Fig. 1B) and sagittal images (Fig. 1C), respectively.
Based on the plotted electrode position on the axial view at the level of 3.5 mm below the AC-PC line, we categorized the electrode positions into three groups: 1) group I, both electrodes in the STN (n = 36); 2) group II, only one electrode in the STN (n = 16); 3) group III, neither electrode in the STN (n = 5) (Fig. 2).
The clinical information of the patients in each group is summa- rized in Table 1.
Statistical analysis
The primary outcome measures were the total scores and part III scores of the UPDRS; the H&Y stage; the SEADL; the dyskine- sia subscores on part IV of the UPDRS; the LEDD; the SF-36; and neuropsychological tests. The secondary measures were the sub- scores on the part III of the UPDRS. The data for those variables were presented as the mean ± standard deviation. Repeated mea- sured ANOVAs were performed to observe the within-factor ef- fect of 3 times measured at the baseline before surgery and 6 and 12 months after surgery and the between-factor effect of 3 groups (group I, II, and III) classified by the electrode positions in STN on the averages of clinical outcomes with scores.
For the baseline characteristics of the 57 patients, one-way
ANOVA and chi-square or Fisher’s exact test were conducted to
find the 3-group differences in the distribution of continuous
variables and in the frequency of discrete variables, such as gen-
der. To adjust for multiple comparisons within each outcome,
we computed P values on Bonferroni correction of each out-
come. All statistical analyses were used in SAS version 9.1 (SAS
institute, Cary, NC, USA).
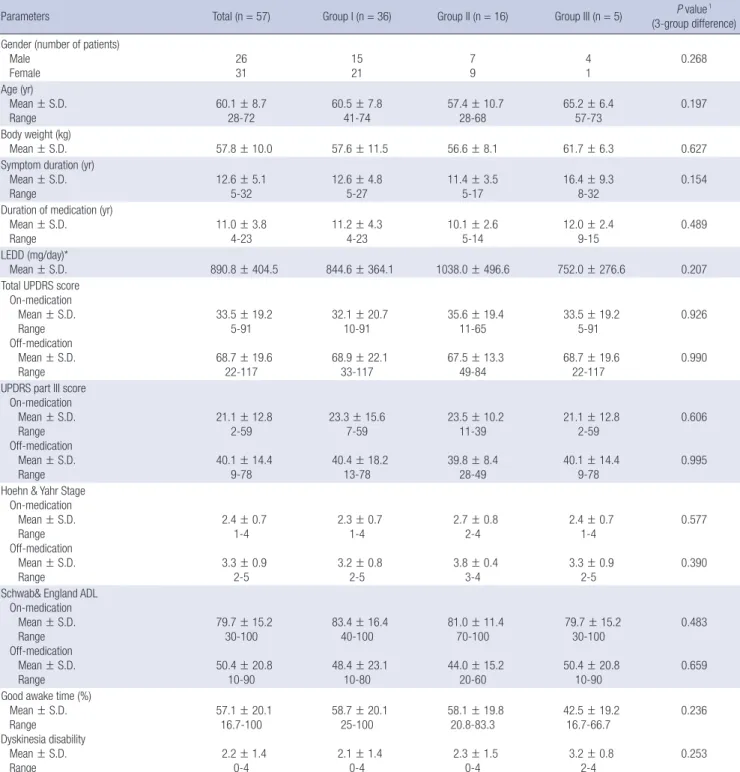
Table 1. Baseline characteristics of the 57 patients
Parameters Total (n = 57) Group I (n = 36) Group II (n = 16) Group III (n = 5) P value1
(3-group difference) Gender (number of patients)
Male
Female 26
31 15
21 7
9 4
1 0.268
Age (yr) Mean ± S.D.
Range 60.1 ± 8.7
28-72 60.5 ± 7.8
41-74
57.4 ± 10.7
28-68
65.2 ± 6.4
57-73
0.197 Body weight (kg)
Mean ± S.D. 57.8 ± 10.0 57.6 ± 11.5 56.6 ± 8.1 61.7 ± 6.3 0.627
Symptom duration (yr) Mean ± S.D.
Range
12.6 ± 5.1 5-32
12.6 ± 4.8 5-27
11.4 ± 3.5 5-17
16.4 ± 9.3 8-32
0.154 Duration of medication (yr)
Mean ± S.D.
Range
11.0 ± 3.8 4-23
11.2 ± 4.3 4-23
10.1 ± 2.6 5-14
12.0 ± 2.4 9-15
0.489 LEDD (mg/day)*
Mean ± S.D.
890.8 ± 404.5
844.6 ± 364.1
1038.0 ± 496.6
752.0 ± 276.6
0.207 Total UPDRS score
On-medication Mean ± S.D.
Range Off-medication Mean ± S.D.
Range
33.5 ± 19.2
5-91 68.7 ± 19.6
22-117
32.1 ± 20.7 10-91 68.9 ± 22.1
33-117
35.6 ± 19.4 11-65 67.5 ± 13.3
49-84
33.5 ± 19.2 5-91 68.7 ± 19.6
22-117
0.926
0.990 UPDRS part III score
On-medication Mean ± S.D.
Range Off-medication Mean ± S.D.
Range
21.1 ± 12.8 2-59 40.1 ± 14.4
9-78
23.3 ± 15.6 7-59 40.4 ± 18.2
13-78
23.5 ± 10.2 11-39 39.8 ± 8.4
28-49
21.1 ± 12.8
2-59 40.1 ± 14.4
9-78
0.606
0.995 Hoehn & Yahr Stage
On-medication Mean ± S.D.
Range Off-medication Mean ± S.D.
Range
2.4 ± 0.7 1-4 3.3 ± 0.9
2-5
2.3 ± 0.7
1-4 3.2 ± 0.8
2-5
2.7 ± 0.8 2-4 3.8 ± 0.4
3-4
2.4 ± 0.7
1-4 3.3 ± 0.9
2-5
0.577
0.390 Schwab& England ADL
On-medication Mean ± S.D.
Range Off-medication Mean ± S.D.
Range
79.7 ± 15.2 30-100 50.4 ± 20.8
10-90
83.4 ± 16.4 40-100 48.4 ± 23.1
10-80
81.0 ± 11.4 70-100 44.0 ± 15.2
20-60
79.7 ± 15.2 30-100 50.4 ± 20.8
10-90
0.483
0.659 Good awake time (%)
Mean ± S.D.
Range Dyskinesia disability Mean ± S.D.
Range
57.1 ± 20.1 16.7-100 2.2 ± 1.4
0-4
58.7 ± 20.1 25-100 2.1 ± 1.4
0-4
58.1 ± 19.8 20.8-83.3 2.3 ± 1.5
0-4
42.5 ± 19.2 16.7-66.7 3.2 ± 0.8
2-4
0.236
0.253
1For gender (discrete scale), the P value was estimated by chi-square test; For other variables (continuous scale), the P value was estimated by ANOVA (Analysis of Variances).
*Daily levodopa equivalent dose (LEDD) was calculated for each antiparkinsonian medication by multiplying the total daily dosage of each drug by its potency relative to a stan- dard levodopa preparation assigned at the value of 1. The following conversion factors were used: levodopa controlled release = 0.77, bromocriptine = 10, ropinirole = 20, pramipexole = 100, and pergolide = 100. One patient had a cardiac pacemaker for the sick sinus syndrome prior to STN DBS. Two patients had previous thalamotomy. ADL, Activities of Daily Life; LEDD, Daily levodopa equivalent dose; UPDRS, Unified Parkinson’s Disease Rating Scale.
Ethical statement
The institutional review board of SNUH approved this study (IRB number:H-0711-023-225). This study is exempted from receiv- ing patient consents due to retrospective review of medical re- cords.
RESULTS
Primary outcome after bilateral STN stimulation
The outcomes were compared between preoperative and post-
operative status at 6 and 12 months after bilateral STN stimula-
tion (Table 2). Significant improvement in off-time scores of to- tal UPDRS, UPDRS III, H&Y scores, SEADL, and dyskinesia dis- ability with decreased LEDD was observed at 6 and 12 months after surgery in the group I and II or as a whole group. The LEDD tended to be low in the patients of group I at 6 and 12 months after surgery (844.6 ± 364.1 at baseline; 279.4 ± 274.6 at 6 months;
and 276.0 ± 301.6 at 12 months; P-interaction = 0.023).
Regarding the eight sub-scales of the SF-36, the scores of bodi- ly pain and summary scores of physical health improved at 6 and 12 months after surgery in the patients as a whole group.
From the neuropsychological evaluation, the verbal memory test using Rey-Kim memory battery showed the decline in rec-
ognition at 6-month follow up in the patients as a whole group (P = 0.002), whereas nonverbal memory showed no meaning- ful change. In frontal lobe function tests, the Stroop test (Stroop- a, P = 0.006; Stroop-b, P = 0.004; Stroop-c, P = 0.034) and the fluency test (P = 0.013) tended to aggravate at 6 and 12 months after the surgery, especially in the group III (P = 0.046 for Stroop- a; P = 0.053 for fluency), but lacked statistical significance after a Bonferroni correction. Other tests including Boston Naming test, Grooved Pegboard test, Mini-Mental state examination, Trail-Making test, Beck Depression Inventory, and Wisconsin Card Sorting test, did not show significant changes.
The average stimulation parameters of the patients as a whole
A B C
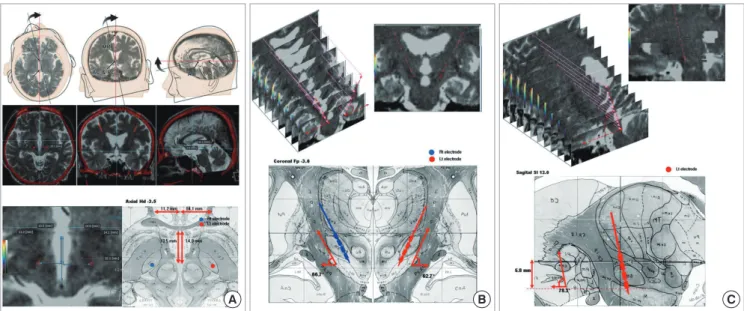
Fig. 1. Fused images of the preoperative MRI and postoperative CT. The T2-weighted axial images of brain MRI taken before surgery are fused with 3-D spiral CT scan images at the data set of 1-mm thickness reformatted images, aligned to anterior commissure - posterior commissure (AC-PC) line. The midline of reformatted coronal images also in- tersect the midsagittal plane for the correction of head-rotation error. The length of AC-PC line and width of the third ventricle are taken into consideration for the proportional localization of the electrodes position in the human brain atlas of Schaltenbrad and Wahren. In the reformatted axial images the lateral distance from the midline and the antero- posterior distance from the mid-commissural line to each electrode are measured (A). In the reformatted coronal images in which the electrode trajectory is best visualized, the lateral angles of the electrode trajectory from the midline are measured for each electrode in every patient (B). In the reformatted sagittal images in which the electrode trajec- tory is best shown, the antero-posterior angle of the electrode trajectory from the line perpendicular to the AC-PC line and the depth of the electrodes are also measured for each electrode in every patient (C).
A B C
Fig. 2. Plotting of electrode positions in the human brain atlas. With the information from the fused images of preoperative MRI and postoperative CT taken at 6 months after surgery as shown in Fig. 1, the electrode positions are plotted on the human brain atlas of Schaltenbrand and Wahren in each patient. Representative illustration of the elec- trode positions (A-C) are plotted in the axial, sagittal, and coronal planes. Based on the axial view at the level of 3.5 mm below the AC-PC line in the atlas, electrode positions (in blue and red colors) are categorized into three groups: 1) group I, both electrodes in the STN (n = 36) (A); 2) group II, only one electrode in the STN (n = 16) (B); 3) group III, neither electrode in the STN (n = 5) (C).
group are 2.6 V (± 0.6 V) in amplitude, 60.6 µsec (± 4.4 µsec) in pulse width, and 139.1 Hz (± 15.7 Hz) in frequency. The average stimulation parameters of the patients in group I are 2.6 V (± 0.6 V) in amplitude, 60.5 µsec (± 3.8 µsec) in pulse width, and 137.6 Hz (± 15.2 Hz) in frequency. The average stimulation parame- ters of the patients in group II are 2.6 V (± 0.6 V) in amplitude, 61.3 µsec (± 6.1 µsec) in pulse width, and 142.0 Hz (± 17.0 Hz) in frequency. The average stimulation parameters of the patients in group III are 2.2 V (± 0.9 V) in amplitude, 60.0 µsec (± 6.0 µsec) in pulse width, and 140.5 Hz (± 16.2 Hz) in frequency.
UPDRS part III subscores after bilateral STN stimulation
The subscores of UPDRS III were compared between preopera- tive and postoperative status at 6 and 12 months after bilateral STN stimulation (Table 3). The off- and on-time tremor and ri- gidity, the off-time bradykinesia, the off-time gait and postural stability subscores significantly improved at 6 months and 12 months after surgery in the group I and II or as a whole group.
The off-time UPDRS III spe ech subscore significantly im- proved at 6 and 12 months after STN DBS in the group I (1.6 ± 0.7 at baseline vs 1.3 ± 0.8 at 6 and 12 months; P < 0.01 by paired t-tests) (P-interaction = 0.008). But no significant improvement was observed in other groups. We further confirmed the speech improvement by comparing the sum of the speech subscores of UPDRS-II and UPDRS-III between preoperative and postoper- ative status at 12 month after STN DBS in three groups (P for trend = 0.003) (Table 4).
Outcomes of 13 patients with nil LEDD after bilateral STN stimulation
Among 57 patients, the LEDD of 13 patients was zero at their last follow up. Their preoperative characteristics were not different from the other patients. Their total UPDRS scores, H&Y Stage, SEADL, and dyskinesia disability scores dramatically improved at 12 months after STN DBS (Table 5). Their off-time UPDRS part III subscores including speech were significantly improved at
Table 2. The clinical outcomes of 57 patients after bilateral subthalamic nucleus stimulationMedi- cation
Total subjects Subjects according to each group
Baseline 6 months1 12 months1 P value2 Group Baseline 6 months1 12 months1
P value2 for within-
factor P value3
for group-
factor P value4
for interac-
tion Total UPDRS On
Off
33.5 ± 19.2
68.7 ± 19.6†
29.3 ± 13.7
46.7 ± 18.3
29.4 ± 14.0
42.6 ± 17.0 0.079
< 0.001*
I II III I II III
33.9 ± 19.1 32.1 ± 20.7 35.6 ± 19.4 68.8 ± 19.7† 68.9 ± 22.1† 67.5 ± 13.3
28.3 ± 14.8 30.4 ± 10.9 32.9 ± 15.0 44.4 ± 18.7 50.5 ± 18.0 51.2 ± 17.4
28.1 ± 14.6 29.8 ± 11.9 37.0 ± 15.6 39.5 ± 17.9 43.4 ± 12.0 62.5 ± 11.2†
0.717
< 0.001*
0.421
0.368 0.840
0.063
UPDRS III On
Off
21.1 ± 12.8†
40.1 ± 14.4†
16.0 ± 9.2
23.7 ± 12.4
16.1 ± 8.2
21.3 ± 9.3
0.003*
< 0.001*
I II III I II III
19.8 ± 11.9 23.3 ± 15.6 23.5 ± 10.2 40.0 ± 13.6† 40.4 ± 18.2† 39.8 ± 8.4
16.2 ± 9.9 15.4 ± 7.9 16.9 ± 8.3† 23.1 ± 12.9 24.1 ± 11.7 26.4 ± 13.3
15.3 ± 9.2 16.4 ± 5.4 20.6 ± 7.2 20.1 ± 10.0 21.6 ± 7.2 28.5 ± 8.1
0.016*
< 0.001*
0.578
0.703 0.601
0.746
Hoehn &
Yahr Stage On Off
2.4 ± 0.7
3.3 ± 0.9†
2.3 ± 0.7
2.6 ± 0.7
2.4 ± 0.7
2.6 ± 0.6
0.815
< 0.001*
I II III I II III
2.4 ± 0.7 2.4 ± 0.7 2.7 ± 0.8 3.3 ± 0.9† 3.3 ± 0.9† 3.8 ± 0.4
2.3 ± 0.6 2.2 ± 0.7 2.6 ± 1.1 2.6 ± 0.7 2.5 ± 0.7 3.1 ± 1.1
2.3 ± 0.7 2.3 ± 0.4 3.1 ± 0.5† 2.5 ± 0.5 2.5 ± 0.5 3.3 ± 1.0†
0.431
< 0.001*
0.146
0.088 0.522
0.792
Schwab &
England ADL On Off
79.7 ± 15.2
50.4 ± 20.8†
82.0 ± 15.3
66.4 ± 18.6
83.0 ± 13.5
71.2 ± 18.7 0.325
< 0.001*
I II III I II III
77.9 ± 15.2† 83.8 ± 16.0 81.0 ± 11.4 52.1 ± 20.7† 45.6 ± 25.2† 40.0 ± 15.2
84.4 ± 11.3 78.7 ± 16.4 74.0 ± 31.3 68.3 ± 16.6 64.7 ± 21.3 58.0 ± 24.9
84.4 ± 11.1 84.4 ± 8.9 68.0 ± 29.5† 73.9 ± 18.9 72.5 ± 12.4 48.0 ± 21.9†
0.769 0.003*
0.320
0.061 0.036*
0.493
Dyskinesia
disability 2.2 ± 1.4† 0.8 ± 1.2 1.0 ± 1.4 < 0.001* I II III
2.1 ± 1.4† 2.3 ± 1.5† 3.2 ± 0.8
0.8 ± 1.2 0.5 ± 1.2 1.2 ± 1.8
0.9 ± 1.3 1.1 ± 1.5 1.4 ± 1.9
< 0.001* 0.306 0.718
LEDD (mg/day) 890.8 ± 404.5†344.3 ± 317.8340.0 ± 322.6 < 0.001* I II III
844.6 ± 364.1† 1038.0 ± 496.6† 750.0 ± 276.6
279.4 ± 274.6 373.5 ± 269.8 724.0 ± 502.9†
276.0 ± 301.6 396.1 ± 241.1 691.3 ± 574.0†
< 0.001* 0.149 0.023*
All data was expressed as a mean ± standard deviation. *P < 0.05. The bold-faced P values were statistically significant (P < 0.005) after Bonferroni multiple comparison cor- rection of 10 clinical outcomes; †significant different group among three groups or three repeated measured outcomes in the repeated measures ANOVA. 1, with DBS stimula- tion; 2, P value for within-factor of three repeated measured outcomes at the baseline and 6 and 12 months after bilateral STN stimulation; 3, P value for between-group-factor of three groups: I (both electrodes in the STN), II (only 1 electrode in the STN) and III (neither electrode in the STN); 4, P value for interaction between the within-factor and be- tween-group-factor. Abbreviations as Table 1.
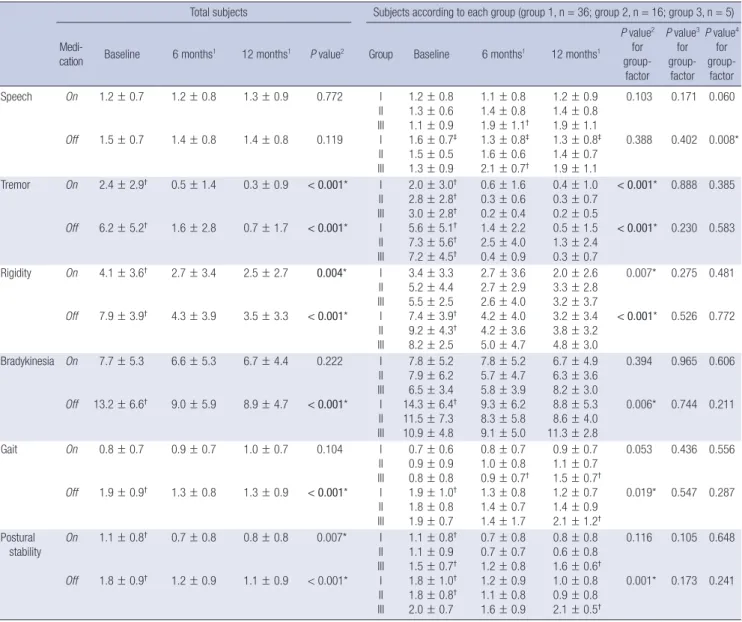
Table 3. UPDRS-III subscores of 57 patients after bilateral subthalamic nucleus stimulation
Total subjects Subjects according to each group (group 1, n = 36; group 2, n = 16; group 3, n = 5)
Medi-
cation Baseline 6 months1 12 months1 P value2 Group Baseline 6 months1 12 months1
P value2 for group- factor
P value3 for group-
factor P value4
for group-
factor
Speech On
Off
1.2 ± 0.7
1.5 ± 0.7
1.2 ± 0.8
1.4 ± 0.8
1.3 ± 0.9
1.4 ± 0.8
0.772
0.119 I II III I II III
1.2 ± 0.8 1.3 ± 0.6 1.1 ± 0.9 1.6 ± 0.7‡ 1.5 ± 0.5 1.3 ± 0.9
1.1 ± 0.8 1.4 ± 0.8 1.9 ± 1.1† 1.3 ± 0.8‡ 1.6 ± 0.6 2.1 ± 0.7†
1.2 ± 0.9 1.4 ± 0.8 1.9 ± 1.1 1.3 ± 0.8‡ 1.4 ± 0.7 1.9 ± 1.1
0.103
0.388 0.171
0.402 0.060
0.008*
Tremor On
Off
2.4 ± 2.9†
6.2 ± 5.2†
0.5 ± 1.4
1.6 ± 2.8
0.3 ± 0.9
0.7 ± 1.7
< 0.001*
< 0.001*
I II III I II III
2.0 ± 3.0† 2.8 ± 2.8† 3.0 ± 2.8† 5.6 ± 5.1† 7.3 ± 5.6† 7.2 ± 4.5†
0.6 ± 1.6 0.3 ± 0.6 0.2 ± 0.4 1.4 ± 2.2 2.5 ± 4.0 0.4 ± 0.9
0.4 ± 1.0 0.3 ± 0.7 0.2 ± 0.5 0.5 ± 1.5 1.3 ± 2.4 0.3 ± 0.7
< 0.001*
< 0.001*
0.888
0.230 0.385
0.583
Rigidity On
Off
4.1 ± 3.6†
7.9 ± 3.9†
2.7 ± 3.4
4.3 ± 3.9
2.5 ± 2.7
3.5 ± 3.3
0.004*
< 0.001*
I II III I II III
3.4 ± 3.3 5.2 ± 4.4 5.5 ± 2.5 7.4 ± 3.9† 9.2 ± 4.3† 8.2 ± 2.5
2.7 ± 3.6 2.7 ± 2.9 2.6 ± 4.0 4.2 ± 4.0 4.2 ± 3.6 5.0 ± 4.7
2.0 ± 2.6 3.3 ± 2.8 3.2 ± 3.7 3.2 ± 3.4 3.8 ± 3.2 4.8 ± 3.0
0.007*
< 0.001*
0.275
0.526 0.481
0.772
Bradykinesia On
Off
7.7 ± 5.3
13.2 ± 6.6†
6.6 ± 5.3
9.0 ± 5.9
6.7 ± 4.4
8.9 ± 4.7
0.222
< 0.001*
I II III I II III
7.8 ± 5.2 7.9 ± 6.2 6.5 ± 3.4 14.3 ± 6.4† 11.5 ± 7.3 10.9 ± 4.8
7.8 ± 5.2 5.7 ± 4.7 5.8 ± 3.9 9.3 ± 6.2 8.3 ± 5.8 9.1 ± 5.0
6.7 ± 4.9 6.3 ± 3.6 8.2 ± 3.0 8.8 ± 5.3 8.6 ± 4.0 11.3 ± 2.8
0.394
0.006*
0.965
0.744 0.606
0.211
Gait On
Off
0.8 ± 0.7
1.9 ± 0.9†
0.9 ± 0.7
1.3 ± 0.8
1.0 ± 0.7
1.3 ± 0.9
0.104
< 0.001*
I II III I II III
0.7 ± 0.6 0.9 ± 0.9 0.8 ± 0.8 1.9 ± 1.0† 1.8 ± 0.8 1.9 ± 0.7
0.8 ± 0.7 1.0 ± 0.8 0.9 ± 0.7† 1.3 ± 0.8 1.4 ± 0.7 1.4 ± 1.7
0.9 ± 0.7 1.1 ± 0.7 1.5 ± 0.7† 1.2 ± 0.7 1.4 ± 0.9 2.1 ± 1.2†
0.053
0.019*
0.436
0.547 0.556
0.287
Postural stability On
Off
1.1 ± 0.8†
1.8 ± 0.9†
0.7 ± 0.8
1.2 ± 0.9
0.8 ± 0.8
1.1 ± 0.9
0.007*
< 0.001*
I II III I II III
1.1 ± 0.8† 1.1 ± 0.9 1.5 ± 0.7† 1.8 ± 1.0† 1.8 ± 0.8† 2.0 ± 0.7
0.7 ± 0.8 0.7 ± 0.7 1.2 ± 0.8 1.2 ± 0.9 1.1 ± 0.8 1.6 ± 0.9
0.8 ± 0.8 0.6 ± 0.8 1.6 ± 0.6† 1.0 ± 0.8 0.9 ± 0.8 2.1 ± 0.5†
0.116
0.001*
0.105
0.173 0.648
0.241
All data was expressed as a mean ± standard deviation. *P < 0.05. The bold-faced p-values were statistically significant (P < 0.004) after Bonferroni multiple comparison cor- rection of 12 UPDRS III subscores. †significant different group among three groups or three repeated measured outcomes in the repeated measures ANOVA with post-hoc tests.
‡The speech subscore at 6 months or at 12 months was significantly lower than that at baseline (paired t-test, P < 0.001 for 6 months vs baseline; P < 0.001 for 12 months vs baseline). 1, with DBS stimulation; 2, P value for within-factor of three repeated measured outcomes at the baseline and 6 months and 12 months after bilateral STN stimula- tion; 3, P value for between-group-factor of three groups: I (both electrodes in the STN), II (only 1 electrode in the STN) and III (neither electrode in the STN); 4, P value for inter- action between the within-factor and between-group-factor effects.
Table 4. Speech outcomes of 57 patients after bilateral subthalamic nucleus stimulation
Group I Group II Group III Total
Aggravated 13 (36%) 11 (69%) 5 (100%) 28 (49%)
Stationary 5 (14%) 1 (6%) 0 7 (12%)
Improved 18 (50%) 4 (25%) 0 22 (39%)
Total 36 16 5 57
Mantel-Haenszel chi-square test for trend, chi-square value = 8.819 (degree of free- dom = 1), P value = 0.003. Three groups were classified by the fused images of preoperative MRI and postoperative CT scans taken six months after surgery: group I, both electrodes in the STN; group II, only 1 electrode in the STN; group III; neither electrode in the STN. The assessment of speech improvement was based on the summation of the speech subscores of UPDRS part II and part III. All patients were evaluated at 12 months after bilateral STN stimulation.
12 months after surgery (Table 6). Looking into their electrode position, all patients have both electrodes mostly positioned into middle one third of the STN on axial view at the level of 3.5 mm below the AC-PC line (Fig. 3A). The x, y, z coordinates of the ac- tive contacts referenced to the AC-PC midpoint in these patients are depicted in Fig. 3B. The mean (SD) x, y, z coordinates of ac- tive contacts were 12.6 (1.5), -1.2 (1.0), and 3.6 (0.9) on the left electrodes and 12.0 (1.8), -0.5 (0.9), and 3.7 (1.1) on the right elec- trodes.
Complications
Thirteen (22.8%) of 57 patients had complications after surgery.
Transient confusion and abulia was the most common (7.0%) followed by transient dysarthria (5.3%). Two patients (3.5%) had wound infection, one in the scalp and the other in the left sub- clavicular area which was well controlled with antibiotic thera- py. Intracerebral hematomas were found in two patients (3.5%) on immediate postoperative CT scans, which were asymptom- atic. Other complications were seizure (1.8%), transient hypo- phonia (1.8%), transient restless leg syndrome (1.8%) and per- manent personality change (1.8%).
DISCUSSION
Most studies in the literature correlated the clinical improve- ment with the localization of the electrodes determined by the fused images of preoperative and postoperative brain CT or MRI taken at the immediate postoperative period (5, 15, 20-26). But the immediate postoperative imaging make it difficult to pre- cisely localize the center of electrodes in relation to the STN be- cause of brain shift due to CSF leakage at the immediate post- operative period or the electrode artifacts caused by the elec-
Table 5. Clinical outcomes of nil-LEDD patients after bilateral subthalamic nucleus stimulationMedi-
cation Group† Baseline
On -DBS stimulation Off -DBS stimulation Baseline vs On
-DBS stimulation Baseline vs Off -DBS stimulation
6 months 12 months 6 months 12 months
P value1 for within-
factor P value2
for group-
factor P value3
for interac-
tion
P value1 for within-
factor P value2
for group- factor
P value3 for interac-
tion Total UPDRS On
Off
nil-LEDD Others
nil-LEDD Others
42.8 ± 24.5 30.9 ±
16.8 74.3 ±
25.3† 67.0 ±
17.6†
29.6 ± 15.4 29.2 ±
13.4 42.7 ±
18.4 47.9 ±
18.3
32.9 ± 13.8 28.3 ±
14.0 39.1 ±
18.6 43.6 ±
16.6
0.016*
< 0.001*
0.171
0.853 0.105
0.051
UPDRS III On
Off
nil-LEDD Others
nil-LEDD Others
21.5 ± 17.1 20.9 ±
11.5† 41.9 ±
18.3† 39.5 ±
13.2†
16.8 ± 10.5 15.8 ±
8.9 21.6 ±
12.7 24.3 ±
12.4
16.6 ± 10.9 15.9 ±
7.3 19.2 ±
11.0 21.9 ±
8.7
29.4 ± 12.0 29.6 ±
15.9 35.3 ±
15.5 35.8 ±
15.5
33.8 ± 17.2 27.8 ±
11.3 37.0 ±
17.2 34.1 ±
11.9
0.017*
< 0.001*
0.798
0.724 0.961
0.364
< 0.001*
0.012*
0.553
0.702 0.346
0.679
Hoehn &
Yahr Stage On
Off
nil-LEDD Others
nil-LEDD Others
2.2 ± 0.8 2.4 ±
0.7 3.1 ±
1.1 3.4 ±
0.8†
2.3 ± 0.6 2.3 ±
0.7 2.6 ±
0.7 2.6 ±
0.7
2.4 ± 0.6 2.3 ±
0.7 2.4 ±
0.6 2.6 ±
0.6
3.2 ± 1.1 2.8 ±
0.9 3.5 ±
1.2 3.1 ±
1.0
3.1 ± 1.2 2.7 ±
0.7 3.2 ±
1.2 2.9 ±
0.8
0.884
< 0.001*
0.778
0.320 0.354
0.410
< 0.001*
0.177 0.346
0.704 0.062
0.038
Schwab &
England ADL On
Off
nil-LEDD Others
nil-LEDD Others
70.8 ± 19.8 82.4 ±
12.7 51.7 ±
24.4† 50.0 ±
20.0†
80.8 ± 13.2 82.3 ±
16.0 66.5 ±
19.0 66.5 ±
19.0
80.8 ± 11.9 83.6 ±
14.0 77.7 ±
15.4 69.3 ±
19.3
0.072
< 0.001*
0.128
0.343 0.122
0.565
Dyskinesia disability
LEDD (mg/
day)
nil-LEDD Others
nil-LEDD Others
1.9 ± 1.7† 2.3 ±
1.3† 860.3 ±
448.4 899.8 ±
395.8
0.5 ± 1.1 0.8 ±
1.3 106.9 ±
174.8 416.1 ±
317.5
0.6 ± 1.3 1.1 ±
1.4 66.9 ±
130.9 422.5 ±
318.3
< 0.001*
< 0.001*
0.172
0.011*
0.903
0.023*
All data was expressed as a mean ± standard deviation. *P < 0.05. The bold-faced P values were statistically significant after Bonferroni multiple comparison correction (P <
0.005 for comparison between Baseline and On-DBS stimulation for 10 clinical outcomes; P < 0.01 for comparison between Baseline and Off-DBS stimulation for 4 clinical outcomes); †13 patients are in nil-LEDD and 44 patients are in the other group. 1, P value for within-factor of three repeated measured outcomes at the baseline and 6 months and 12 months after bilateral STN stimulation; 2, P value for between-group-factor of three groups: I (both electrodes in the STN), II (only 1 electrode in the STN) and III (neither electrode in the STN); 3, P value for interaction between the within-factor and between-group-factor. Abbreviations as Table 1.
trode-induced magnetic inhomogeneity (8, 9-11). Miyagi et al.
confirmed the significant contralateral brain shift in the unilat- eral procedure and posterior shift in the bilateral procedure by comparing the three-dimensional coordinated of the AC and
PC on MRIs before and after implantation of the electrodes (10).
Khan et al. (9) reported a shift of deep brain structures up to 4 mm after the surgery. Halpern et al. (8) reported posterior shift of the deep brains structures had impacted the number of mi-
Table 6. UPDRS-III subscores of nil-LEDD patients after bilateral subthalamic nucleus stimulationMedi-
cation Group† Baseline
On -DBS stimulation Off -DBS stimulation Baseline vs On -DBS
stimulation Baseline vs Off -DBS stimulation
6 months 12 months 6 months 12 months
P value1 for within-
factor P value2
for group-
factor P value3
for interac-
tion
P value1 for within-
factor P value2
for group-
factor P value3
for interac-
tion
Speech On
Off
nil-LEDD Others
nil-LEDD Others
1.3 ± 0.6 1.2 ±
0.8 1.7 ±
0.6† 1.5 ±
0.7
1.0 ± 0.5 1.3 ±
0.9 1.1 ±
0.5 1.5 ±
0.8
1.0 ± 0.6 1.4 ±
1.0 1.4 ±
0.7 1.4 ±
0.8
1.2 ± 0.4 1.5 ±
0.8 1.3 ±
0.4 1.6 ±
0.8
1.3 ± 0.7 1.3 ±
0.9 1.4 ±
0.7 1.5 ±
0.8
0.460
0.003*
0.326
0.317 0.086
0.007*
0.818
0.313 0.811
0.605 0.310
0.050
Tremor On
Off
nil-LEDD Others
nil-LEDD Others
2.7 ± 4.1 2.3 ±
2.5† 5.7 ±
5.1† 6.4 ±
5.2†
1.0 ± 2.4 0.3 ±
0.8 1.6 ±
2.9 1.6 ±
2.7
0.4 ± 0.9 0.3 ±
0.9 0.5 ±
1.0 0.7 ±
1.9
1.8 ± 3.7 2.1 ±
3.5 2.9 ±
4.3 3.3 ±
4.0
2.8 ± 4.0 1.9 ±
3.1 3.2 ±
3.9 2.5 ±
3.7
< 0.001*
< 0.001*
0.363
0.657 0.721
0.721
0.598
< 0.001*
0.677
0.863 0.542
0.498
Rigidity On
Off
nil-LEDD Others
nil-LEDD Others
3.9 ± 4.4 4.2 ±
3.4† 8.0 ±
4.2† 7.9 ±
3.9†
3.2 ± 2.6 2.6 ±
3.6 3.8 ±
2.9 4.4 ±
4.1
3.0 ± 3.5 2.3 ±
2.5 3.7 ±
3.6 3.4 ±
3.2
6.1 ± 3.9 5.9 ±
4.5 7.5 ±
3.7 7.0 ±
4.5
7.3 ± 4.2 6.1 ±
3.9 7.9 ±
4.4 7.2 ±
4.1
0.058
< 0.001*
0.647
0.963 0.633
0.816
<0.001*
0.592 0.693
0.644 0.510
0.890
Bradykinesia On
Off
nil-LEDD Others
nil-LEDD Others
8.7 ± 6.9 7.4 ±
4.8 15.3 ±
9.0† 12.6 ±
5.7†
7.2 ± 5.7 6.4 ±
5.2 9.0 ±
6.5 9.0 ±
5.8
6.8 ± 5.0 6.7 ±
4.3 8.2 ±
5.2 9.1 ±
4.7
12.7 ± 6.0 11.6 ±
7.1 13.9 ±
6.3 13.6 ±
7.2
13.0 ± 7.8 11.0 ±
5.4 14.3 ±
5.2 13.5 ±
5.4
0.235
< 0.001*
0.582
0.732 0.781
0.124
< 0.001*
0.966 0.388
0.505 0.911
0.408
Gait On
Off
nil-LEDD Others
nil-LEDD Others
0.7 ± 0.8 0.8 ±
0.7 1.9 ±
1.3† 1.9 ±
0.8†
0.7 ± 0.6 1.0 ±
0.7 1.0 ±
0.7 1.4 ±
0.8
1.1 ± 0.7 1.0 ±
0.8 1.2 ±
0.8 1.4 ±
0.9
1.7 ± 1.2 1.6 ±
1.0 2.0 ±
1.2 1.9 ±
1.0
2.0 ± 1.2 1.5 ±
0.8 2.2 ±
1.1 1.8 ±
0.9
0.059
< 0.001*
0.668
0.406 0.264
0.255
< 0.001*
0.806 0.418
0.434 0.208
0.503
Postural stability
On
Off
nil-LEDD Others
nil-LEDD Others
0.8 ± 0.9 1.2 ±
0.8† 1.6 ±
1.4 1.9 ±
0.7
0.7 ± 0.8 0.7 ±
0.8 1.2 ±
0.9 1.2 ±
0.9
0.9 ± 0.9 0.8 ±
0.8 0.9 ±
0.9 1.1 ±
0.9
1.2 ± 0.8 1.2 ±
1.0 1.7 ±
1.1 1.5 ±
1.0
1.5 ± 1.1 1.1 ±
0.9 1.6 ±
1.2 1.4 ±
0.9
0.158
< 0.001*
0.627
0.538 0.195
0.546
0.283
0.162 0.913
0.816 0.053
0.121
All data was expressed as a mean ± standard deviation. †13 patients are in nil-LEDD and 44 patients are in the other group. *P < 0.05. The bold-faced p-values were statisti- cally significant (P < 0.004) after Bonferroni multiple comparison correction of 12 UPDRS III subscores. 1, P value for within-factor of three repeated measured outcomes at the baseline and 6 months and 24 months after bilateral STN stimulation; 2, P value for between-group-factor of three groups: I (both electrodes in the STN), II (only 1 electrode in the STN) and III (neither electrode in the STN); 3, P value for interaction between the within-factor and between-group-factor. Abbreviations as Table 1.
A
B
Fig. 3. Electrode positions of 13 patients without medication after surgery. (A) The location of the electrodes are plotted based on the fused images of the 13 patients showing significant clinical improvement in UPDRS part III including speech with nil LEDD (in red color) and of the remaining 44 patients (in black color) at the last follow-up period of more than one year after surgery. Most electrodes of these 13 patients are positioned in the middle one third of the subthalamic nucleus in the axial view at the level of 3.5 mm below the AC-PC line (upper left), and also positioned in the subthalamic nucleus in the coronal view at the level of 3.0 mm posterior to midcommissural point (upper right) and in the sagittal view at the level of 12 mm lateral to the midline (lower). (B) The x, y, z coordinates of the active contacts referenced to the AC-PC midpoints in the 13 patients with nil LEDD.
B A
D C
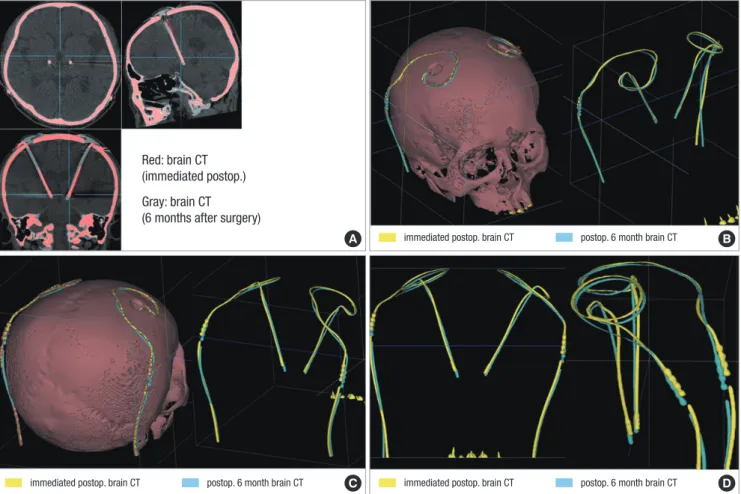
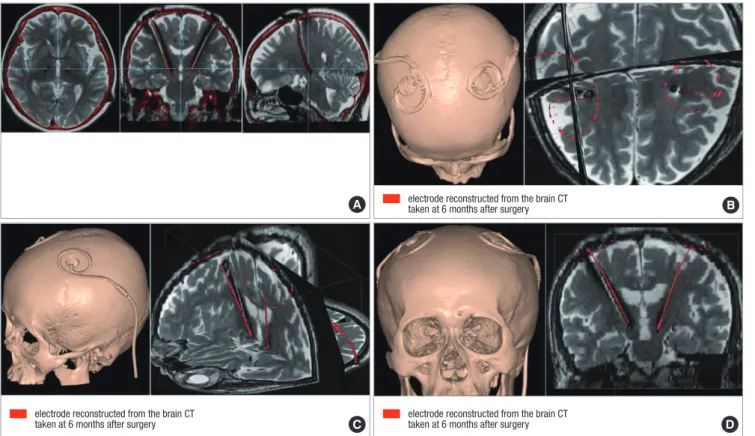
Fig. 4. Fused images of two brain CT scans taken after surgery. The fused images obtained from the CT scans taken at the immediate postoperative day and six months after surgery are aligned along the AC-PC line at the level of AC and PC in axial, sagittal, and coronal plane. The red represents the electrode extracted from the images of brain CT taken immediately after surgery and the gray represents the electrode extracted from the images of the brain CT taken at six months after surgery. The red and the gray elec- trodes do not fit into each other with significant discrepancy of their position in the axial and coronal planes (A). With the adjustment of window level and width of the fused im- ages, only the shadow of both electrodes is extracted in 3-D reconstructive rendering image of right superior oblique view (B), right posterior oblique view (C), and AP and later- al view (D). The yellow represents the electrode extracted from the images of brain CT taken immediately after surgery and the sky-blue represents the electrode extracted from the images of the brain CT taken at six months after surgery. Significant discrepancy of the electrode position between the two CT scans is remarkable.
Red: brain CT (immediated postop.) Gray: brain CT (6 months after surgery)
immediated postop. brain CT postop. 6 month brain CT immediated postop. brain CT postop. 6 month brain CT
immediated postop. brain CT postop. 6 month brain CT
croelectrode tracks to optimize STN targeting.
Kim et al. (27) found that there was a significant discrepancy in the implanted electrode positions between the immediate postoperative period and six months after DBS surgery in 53 pa- tients with Parkinson’s disease. The considerable discrepancy of electrode position between the immediate postoperative CT scan and the brain CT taken at 6 months after surgery makes it difficult to precisely localize the center of the electrode with the fused images of preoperative MRI and the immediate postop- erative CT scans (Fig. 4).
Martinez-Santiesteban et al. (11) found that image artifacts in 2.0 Tesla MRI produced by microelectrodes were highly depen- dent not only on the magnetic susceptibility of the materials used but also on the size, shape and orientation of the electrodes with respect to main magnetic field. Lee et al. (28) compared the X-, Y-, Z- coordinates of the center of the electrodes estimated by MRI and CT in 61 patients who had taken both MRI and CT at least six months after bilateral STN DBS to validate the accuracy of MRI in electrode localization in comparison with CT scan.
They found that the electrode location evaluated by postopera- tive MRI had significant discrepancy with the location estimat-
ed by brain CT scan. The artifacts caused by the electrode inter- ference of local magnetic field makes it difficult to precisely lo- calize the center of the electrodes in MRI (Fig. 5).
As in the previous studies (12), we observed that the improve- ment of symptoms, the LEDD, the neuropsychological changes other than speech and stimulation side effects did not vary sig- nificantly between the patients of group I and group II in this series. Although the number of the patients was too small to get a statistical significance, there was a good deal of symptomatic improvements after surgery even in the patients of group III. This suggested that there is a significant target volume in the region of the STN that provides equivalent clinical efficacy, which is comparable with the report that McClelland et al. (26) had de- scribed. They suggested that a DBS electrode placed anywhere within 6-mm-diameter cylinder centered at the presumed mid- dle of the STN might result in similar clinical efficacy.
In this study the best symptom relief including speech with a reduced LEDD was observed in the patients whose electrodes were accurately positioned in both STN. There are debates re- garding the surgical outcome of speech after bilateral STN stim- ulation (1, 29, 30). In this study, patients of group II or III had
B A
C D
Fig. 5. Fused images of brain CT and MRI taken after surgery. Fused images of the brain CT and the brain MRI both taken at 6 months after bilateral subthalamic stimulation are illustrated. The fused images obtained from the brain MRI and the brain CT taken at 6 months after bilateral subthalamic stimulation are aligned along the AC-PC line at the level of AC and PC in axial, sagittal, and coronal plane. The red represents the electrode extracted from the images of brain CT taken at six months after surgery and the gray represents the electrode extracted from the images of the brain MRI taken at six months after surgery. The center of red and gray one representing the center of electrodes ex- tracted from brain CT and brain MRI do not fit into each other with significant discrepancy of their position in the axial, coronal, and sagittal plane of the fused images (A). With the adjustment of window level and width of the fused images, only the electrodes in red color are superimposed in 3-D reconstructive rendering brain MR images of superior anterior view (B), left anterior superior oblique view (C), and anterior posterior view (D). The discrepancy of the electrode position extracted from brain CT and the center of elec- trode artifact from brain MRI taken at 6 months after surgery is remarkable in all three axial, sagittal, and coronal planes.
electrode reconstructed from the brain CT taken at 6 months after surgery
electrode reconstructed from the brain CT taken at 6 months after surgery electrode reconstructed from the brain CT
taken at 6 months after surgery
speech deterioration after bilateral STN stimulation more com- monly than those of group I. Such speech deterioration was re- versible when turning off the stimulation. The patients whose electrodes were positioned medial to the STN experienced speech deterioration more frequently.
The average LEDD at 6 and 12 months after STN stimulation was lower in the group I than in the group II or III in this study.
The LEDD was zero at their last follow up in a subgroup of 13 (36%) patients in 36 patients of group I. This subgroup of 13 pa- tients had significant clinical improvement in sub-scores of UP- DRS part III including speech at the last follow-up more than one year after surgery. These 13 patients had their stimulation electrodes mostly positioned within the middle one third of both STN on the axial view at 3.5 mm from the AC-PC line (Fig. 3).
This study has several limitations. First, we categorized the electrode positions into three groups based on the plotted elec- trode position on the axial view at the level of 3.5 mm below the AC-PC line in the human brain atlas of Schaltenbrand and Wahren (19). We assumed that the patient’s brain would con- form to the atlas with adjustment of the length of AC-PC line and size of the third ventricle. However, there might be a discrep- ancy between the real location of the electrodes in the individ- ual brain and the location of the electrodes plotted in the human brain atlas confirmed to the patients. Second, we did not take the depth and trajectory of the electrodes into consideration to assess the thorough information of all four contacts in relation of the STN. We need further studies to assess four contacts of DBS electrodes in relation to the STN to recognize the best ana- tomical structures such as dorsal STN or zona incerta for the modulation of each specific motor symptom. Third, it needs fur- ther long-term follow-up in the estimation of clinical outcome in correlation with electrode positions identified on the CT-MR fused images.
So far little has been reported in the literature regarding the clinical outcome up to one year according to the electrode po- sitions estimated at a stable period after bilateral STN stimula- tion as in this study. The patients of group I, especially whose electrodes were located in the middle one third of both STN at 3.5 mm below the anterior-posterior commissural line, had bet- ter outcome in speech with least LEDD than two other groups.
Our findings suggest that the better symptom relief including speech with a reduced LEDD is expected in the patients whose electrodes are accurately positioned in both STN.
REFERENCES
1. Krack P, Batir A, Van Blercom N, Chabardes S, Fraix V, Ardouin C, Koudsie A, Limousin PD, Benazzouz A, LeBas JF, Benabid AL, Pollak P. Five-year follow-up of bilateral stimulation of the subthalamic nucleus in advanced Parkinson’s disease. N Engl J Med 2003; 349: 1925-34.
2. Limousin P, Krack P, Pollak P, Benazzouz A, Ardouin C, Hoffmann D,
Benabid AL. Electrical stimulation of the subthalamic nucleus in advanced Parkinson’s disease. N Engl J Med 1998; 339: 1105-11.
3. Bejjani BP, Dormont D, Pidoux B, Yelnik J, Damier P, Arnulf I, Bonnet AM, Marsault C, Agid Y, Philippon J, Cornu P. Bilateral subthalamic stim- ulation for Parkinson’s disease by using three-dimensional stereotactic magnetic resonance imaging and electrophysiological guidance. J Neu- rosurg 2000; 92: 615-25.
4. Godinho F, Thobois S, Magnin M, Guenot M, Polo G, Benatru I, Xie J, Salvetti A, Garcia-Larrea L, Broussolle E, Mertens P. Subthalamic nu- cleus stimulation in Parkinson’s disease: anatomical and electrophysio- logical localization of active contacts. J Neurol 2006; 253: 1347-55.
5. Lanotte MM, Rizzone M, Bergamasco B, Faccani G, Melcarne A, Lopia- no L. Deep brain stimulation of the subthalamic nucleus: anatomical and neurophysiological and outcome correlations with the effects of stim- ulation. J Neurol Neurosurg Psychiatry 2002; 72: 53-8.
6. Saint-Cyr JA, Hoque T, Pereira LC, Dostrovsky JO, Hutchison WD, Mi- kulis DJ, Abosch A, Sime E, Lang AE, Lozano AM. Localization of clini- cally effective stimulating electrodes in the human subthalamic nucleus on magnetic resonance imaging. J Neurosurg 2002; 97: 1152-66.
7. Yelnik J, Damier P, Demeret S, Gervais D, Bardinet E, Bejjani BP, Fran- çois C, Houeto JL, Arnule I, Dormont D, Galanaud D, Pidoux B, Cornu P, Agid Y. Localization of stimulating electrodes in patients with Parkin- son disease by using a three-dimensional atlas-magnetic resonance im- aging coregistration method. J Neurosurg 2003; 99: 89-99.
8. Halpern CH, Danish SF, Baltuch GH, Jaggi JL. Brain shift during deep brain stimulation surgery for Parkinson’s disease. Stereotact Funct Neu- rosurg 2008; 86: 37-43.
9. Khan MF, Mewes K, Gross RE, Skrinjar O. Assessment of brain shift re- lated to deep brain stimulation surgery. Stereotact Funct Neurosurg 2008;
86: 44-53.
10. Miyagi Y, Shima F, Sasaki T. Brain shift: an error factor during implanta- tion of deep brain stimulation electrodes. J Neurosurg 2007; 107: 989-97.
11. Martinez-Santiesteban FM, Swanson SD, Noll DC, Anderson DJ. Mag- netic field perturbation of neural recording and stimulating microelec- trodes. Phys Med Biol 2007; 52: 2073-88.
12. Paek SH, Han JH, Lee JY, Kim C, Jeon BS, Kim DG. Electrode position determined by fused images of preoperative and postoperative magnetic resonance imaging and surgical outcome after subthalamic nucleus deep brain stimulation. Neurosurgery 2008; 63: 925-36.
13. Heo JH, Lee KM, Paek SH, Kim MJ, Lee JY, Kim JY, Cho SY, Lim YH, Kim MR, Jeong SY, Jeon BS. The effects of bilateral subthalamic nucleus deep brain stimulation (STN DBS) on cognition in Parkinson disease. J Neurol Sci 2008; 273: 19-24.
14. Christensen GE, Joshi SC, Miller MI. Volumetric transformation of brain anatomy. IEEE Trans Med Imaging 1997; 16: 864-77.
15. Ferroli P, Franzini A, Marras C, Maccagnano E, D’Incerti L, Broggi G. A simple method to assess accuracy of deep brain stimulation electrode placement: pre-operative stereotactic CT+ postoperative MR image fu- sion. Stereotact Funct Neurosurg 2004; 82: 14-9.
16. Ken S, Di Gennaro G, Giulietti G, Sebastiano F, De Carli D, Garreffa G, Colonnese C, Passariello R, Lotterie JA, Maraviglia B. Quantitative eval- uation for brain CT/MRI coregistration based on maximization of mu- tual information in patients with focal epilepsy investigated with subdu- ral electrodes. Magn Reson Imaging 2007; 25: 883-8.
17. Kim HJ, Paek SH, Kim JY, Lee JY, Lim YH, Kim DG, Jeon BS. Two-year
follow-up on the effect of unilateral subthalamic deep brain stimulation in highly asymmetric Parkinson’s disease. Mov Disord 2009; 24: 329-35.
18. Pluim JP, Maintz JB, Viergever MA. Mutual-information-based registra- tion of medical images: a survey. IEEE Trans Med Imaging 2003; 22: 986- 1004.
19. Schaltenbrand G, Wahren W. Atlas for stereotaxy of the human brain.
2nd ed. Stuttgart∙New York: Thieme, 1977.
20. Herzog J, Volkmann J, Krack P, Kopper F, Pötter M, Lorenz D, Steinbach M, Klebe S, Hamel W, Schrader B, Weinert D, Müller D, Mehdorn HM, Deuschl G. Two-year follow-up of subthalamic deep brain stimulation in Parkinson’s disease. Mov Disord 2003; 18: 1332-7.
21. Coyne T, Silburn P, Cook R, Silberstein P, Mellick G, Sinclair F, Fracchia G, Wasson D, Stanwell P. Rapid subthalamic nucleus deep brain stimu- lation lead placement utilising CT/MRI fusion, microelectrode recording and test stimulation. Acta Neurochir Suppl 2006; 99: 49-50.
22. Duffner F, Schiffbauer H, Breit S, Friese S, Freudenstein D. Relevance of image fusion for target point determination in functional neurosurgery.
Acta Neurochir (Wien) 2002; 144: 445-51.
23. Hamel W, Fietzek U, Morsnowski A, Schrader B, Herzog J, Weinert D, Pfister G, Müller D, Volkmann J, Deuschl G, Mehdorn HM. Deep brain stimulation of the subthalamic nucleus in Parkinson’s disease: evalua- tion of active electrode contacts. J Neurol Neurosurg Psychiatry 2003; 74:
1036-46.
24. Plaha P, Ben-Shlomo Y, Patel NK, Gill SS. Stimulation of the caudal zona
incerta is superior to stimulation of the subthatlamic nucleus in improv- ing contralateral parkinsonism. Brain 2006; 129: 1732-47.
25. Voges J, Volkmann J, Allert N, Lehrke R, Koulousakis A, Freund HJ, Sturm V. Bilateral high-frequency stimulation in the subthalamic nucleus for the treatment of Parkinson disease: correlation of therapeutic effect with anatomical electrode position. J Neurosurg 2002; 96: 269-79.
26. McClelland S 3rd, Ford B, Senatus PB, Winfield LM, Du YE, Pullman SL, Yu Q, Frucht SJ, McKhann GM 2nd, Goodman RR. Subthalamic stimu- lation for Parkinson disease: determination of electrode location neces- sary for clinical efficacy. Neurosurg Focus 2005; 19: E12.
27. Kim YH, Kim HJ, Kim C, Kim DG, Jeon BS, Paek SH. Comparison of elec- trode location between immediate postoperative day and 6 months after bilateral subthalamic nucleus deep brain stimulation. Acta Neurochir (Wien) 2010; 152: 2037-45.
28. Lee JY, Kim JW, Lee JY, Lim YH, Kim C, Kim DG, Jeon BS, Paek SH. Is MRI a reliable tool to locate the electrode after deep brain stimulation surgery?
Comparison study of CT and MRI for the localization of electrodes after DBS. Acta Neurochir (Wien) 2010; 152: 2029-36.
29. Benabid AL, Chabardès S, Seigneuret E. Deep brain stimulation in Par- kinson’s disease: long-term efficacy and safety - What happened this year?
Curr Opin Neurol 2005; 18: 623-30.
30. Pinto S, Thobois S, Costes N, Le Bars D, Benabid AL, Broussolle E, Pol- lak P, Gentil M. Subthalamic nucleus stimulation and dysarthria in Par- kinson’s disease: a PET study. Brain 2004; 127: 602-15.
AUTHOR SUMMARY
Electrode Position and the Clinical Outcome after Bilateral Subthalamic Nucleus Stimulation
Sun Ha Paek, Jee-Young Lee, Han-Joon Kim, Daehee Kang, Yong Hoon Lim, Mi Ryoung Kim, Cheolyoung Kim, Beom Seok Jeon and Dong Gyu Kim