Journal of the Korean Chemical Society 2014, Vol. 58, No. 5
Printed in the Republic of Korea
http://dx.doi.org/10.5012/jkcs.2014.58.5.500
-500-
단신
(Notes)
Size Effect on Transport Properties of Liquid Argon:
A Molecular Dynamics Simulation Study
Song Hi Lee*
Department of Chemistry, Kyungsung University, Busan 608-736, Korea.
*E-mail: [email protected]
(Received June 23, 2014; Accepted August 26, 2014)
Key words: Molecular dynamics simulation, Liquid argon, Green-Kubo formula, Transport properties
There are various theories of transport properties in gases and liquids: the elementary kinetic theory of gases and molecular collisions, the macroscopic equations of con- tinuum mechanics or hydrodynamics such as the conti- nuity equation, the momentum balance equation, and the energy balance equation, the concept of phase space and Liouville equation which result in the reduced distribu- tion function and BBGKY hierarchy for fluid distribution function, the Boltzmann equation and Chapman-Enskog method which are respectively the central equation of the rigorous kinetic theory of gases and the standard method for solving this Boltzmann integrodifferential equation, and finally the time-correlation function method (Green- Kubo (GK) relation) which is probably the most success- ful theory for the transport properties of liquids.
Green and Kubo1 showed that the phenomenological coefficients describing many transport processes and time- dependent phenomena in general could be written as inte- grals over a certain type of function called a time-correlation function. These time-correlation functions play a somewhat similar role in non-equilibrium statistical mechanics that the partition function plays in equilibrium statistical mechanics.
The analogy breaks down in one respect. Since the state of thermal equilibrium is unique, a single partition function gives all the thermodynamic properties, but since there are many different kinds of non-equilibrium states, a differ- ent time-correlation function for each type of transport process is needed. Determining the appropriate time-cor- relation function to use for a particular transport process of interest is very important.
The GK relations (section II) are the formal expressions for hydrodynamic field variables and some of the thermody- namic properties in terms of the microscopic variables of an N-particle system. The identification of microscopic expressions for macroscopic variables is made by a process of comparison of the conservation equations of hydrody-
namics with the microscopic equations of change for con- served densities. The importance of these relations is three-fold: they provide an obvious method for calculating transport coefficients using computer simulations, a con- venient starting point for constructing analytic theories for non-equilibrium processes, and an essential information for designing non-equilibrium molecular dynamics (NEMD) algorithms.
In practice of performing an equilibrium molecular dynamics (EMD) simulation of an N-particle system to calculate transport coefficients directly from the GK relations, it is found that since the time-correlation decay in a slow alge- braic fashion (t−d/2 in d dimensions),2 a large portion of the transport coefficient is determined by the long time tail of the correlation functions. This is probably the most difficult part of the correlation function to calculate. Another prob- lem relating to the calculation of the correlation function is the size of simulation box. If one wishes to calculate a time correlation over a time span t, one must ensure that the system simulated is sufficiently large for a sound wave not to be able to traverse the system in a time less than t. If this condition is not fulfilled the periodic image convention used in simulation means that the damping of the sound wave will be modified as an image sound wave propa- gates across the system.3
In a recent study, we have examined the Green-Kubo formula for the calculation of transport properties (diffu- sion coefficient, viscosity, and thermal conductivity) of liquid Argon by carrying out a series of equilibrium molecular dynamics (EMD) simulations for the system of N = 1728 at 94.4 K and 1.374 g/cc and the error estimates, (XMD− XExp)/XExp, were reported as −0.4, 54.3, and −43.4% for X
= D, η, and λ of liquid argon, respectively.4 While the agreement between the MD results and the experimental measure for D is excellent, those for η and λ are accept- able but rather unsatisfied. In this note, we perform EMD
MD Simulation of Liquid Argon 501
2014, Vol. 58, No. 5
simulations for liquid argon of the systems of N = 1728, 6912, 13824, 27648 and 110592 at 94.4 K and 1.374 g/cc.
The primary goal of this study is to examine the size effect on the transport properties (D, η, and λ) of liquid argon.
Green-Kubo Formulas and Molecular Dynamics Sim- ulation
The diffusion coefficient is obtained through two routes:
the Green-Kubo formula from velocity auto-correlation (VAC) function:
, (1)
and the Einstein formula from mean square displacement (MSD):
. (2)
The shear viscosity is given by a modified Green-Kubo formula for better statistical accuracy:4
, (3)
where
. (4)
with αβ = xy, xz, yx, yz, zx, and zy. Similarly the thermal conductivity is given by4
, (5)
where iα is the heat flux:
, (6)
with α = x, y, and z. The energy of molecule i is given by
, (7)
where φ [rij(t)] is the potential energy between particles i and j at time t.
We have chosen argon systems of N = 1728, 6912, 13824, 27648 and 110592 to carry out MD simulations at T = 94.4 and ρ = 1.374 g/cc. The length of cubic simulation box of each system is given in Table 1. The usual Lennard-Jones (LJ) 12-6 potential for the interaction between liquid argon is used with the LJ parameters,5σ = 0.3405 nm and ε/kB = 119.8 K, where kB is the Boltzmann constant. The inter- atomic potential is truncated at 1.0 nm, which is the cut- off distance used in many other simulations. Long-range corrections are applied to the energy, pressure, etc. due to the potential truncation.6 The equations of motion were solved a velocity Verlet algorithm7 with a time step of l0−14 second for NVT MD simulations with the determined vol- umes from the system density. The configurations of argon molecules were stored every time step for further analysis.
The systems were fully equilibrated and the equilibrium properties are averaged over 10 blocks of 5,000 time steps (50 ps).
RESULTS AND DISCUSSION
The mean square displacement (MSD) and the velocity auto-correlation (VAC) function of liquid argon show a normal behavior (not shown) as Rahman depicted them first time in 1964.8 The MSD of liquid argon shows a lin- ear behavior within 3 ps with the initial dent within 0.3 ps,8 and the VAC of liquid argon decays rapidly to 0 within 0.5 ps, has a negative value due to the collision with the neigh- boring particle, and fluctuates near zero after 1.5 ps.8
Table 1 lists diffusion coefficients of the liquid argon for
D 1
3--- dt
0
∫
∞ 〈vi( ) v0 ⋅ i( )t 〉=
D 1
6--- d dt----
t ∞→
lim 〈[ri( ) rt – i( )0 ]2〉
=
η V
kT--- dt
0
∫
∞∑
i 〈Piαβ( ) P0 ⋅ iαβ( )t 〉=
Piαβ( )t 1
V--- mviα( ) vt ⋅ iβ( )t 1
2--- rijα( )t
j i≠
∑
⋅fijβ( )t+
=
λ V
3kT2 --- dt
0
∫
∞ 〈q·iα( ) q·0 ⋅ iα( )t 〉∑
i=
q·
q·iα( )t 1
V--- εi( ) vt ⋅ iα( )t 1
2--- rijα( )t
j i≠
∑
⋅[vi( ) ft ⋅ ij( )t ]+
=
εi( )t mivi( )t 2 ---2 1
2--- φ r[ ij( )t ]
j i≠
∑
+
=
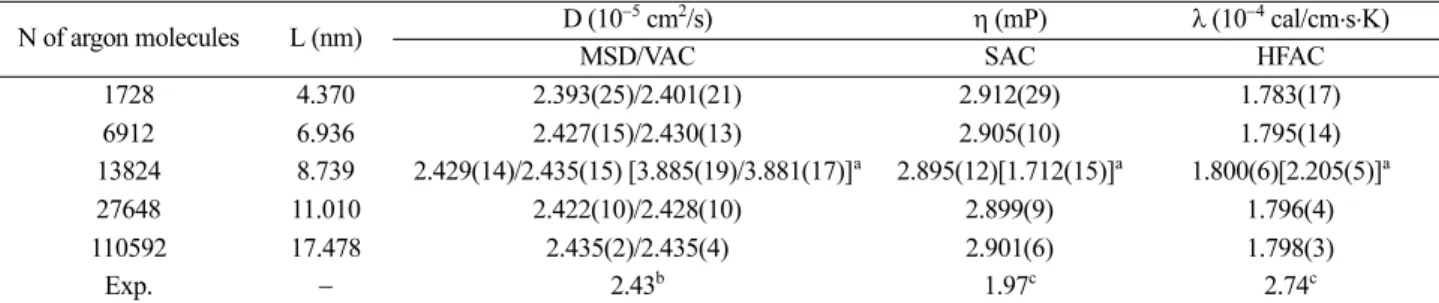
Table 1. Comparison of diffusion coefficients, viscosities, and thermal conductivities of liquid argon at 94.4 K and 1.374 g/cc in NVT MD simulations with experiment. L is the length of cubic simulation box
N of argon molecules L (nm) D (10−5 cm2/s) η (mP) λ (10−4 cal/cm⋅s⋅K)
MSD/VAC SAC HFAC
1728 4.370 2.393(25)/2.401(21) 2.912(29) 1.783(17)
6912 6.936 2.427(15)/2.430(13) 2.905(10) 1.795(14)
13824 8.739 2.429(14)/2.435(15) [3.885(19)/3.881(17)]a 2.895(12)[1.712(15)]a 1.800(6)[2.205(5)]a
27648 11.010 2.422(10)/2.428(10) 2.899(9) 1.796(4)
110592 17.478 2.435(2)/2.435(4) 2.901(6) 1.798(3)
Exp. − 2.43b 1.97c 2.74c
aUsing other LJ parameters: σ = 0.3268 nm and ε/kB = 119.8 K. bAt 90 K and 1.374 g/cc.9 cObtained from Lagrange interpolation of experi- mental results at 94.4 K and saturated vapor pressure.12
Journal of the Korean Chemical Society
502 Song Hi Lee
N = 1728, 6912, 13824, 27648 and 110592 at 94.4 K and 1.374 g/cc obtained from MSD’s using Eq. (1) and VAC’s using Eq. (2) which are in good agreement with the exper- imental measures (2.43×10⁻⁵ cm2/s at 90 K and 1.374 g/cc).9 As the number of argon molecules increases, D obtained from MSD approaches the experimental measure (2.393 2.427 → 2.429 → 2.422 → 2.435) and D obtained from VAC also shows a good accuracy (2.401 → 2.403 → 2.435 → 2.428
→ 2.435). The previously reported results for D of liquid argon at the same state were 2.44,10 2.48,11 and 2.42×10⁻⁵ cm2/s4 by EMD, and 4.02×10⁻⁵ cm2/s by NEMD.10 The results using other LJ parameters [σ = 0.3268 nm and ε/kB
= 119.8 K] for N = 13824 are much poorer than those using the original LJ parameters [σ= 0.3405 nm and ε/kB = 119.8 K] as shown in Table 1. Obviously, the larger diffusion coeffi- cients (D) are attributed to the smaller size LJ parameter (σ).
Stress auto-correlation (SAC) and heat-flux auto-correlation (HFAC) functions of the liquid argon for N = 1728, 13824, and 110592 at 94.4 K and 1.374 g/cc are plotted in Figs. 1 and 2. Both correlation functions are fluctuating near zero after 5 ps. In the inset of Fig. 1, we plot the detailed SAC functions in the very narrow y-axis around the zero cor- relation. For N = 1728, the fluctuation of the SAC func- tion is very high, but it lowered with increasing number of argon molecules. The SAC function for N = 13824 is accept- able and that for N = 110592 is more perfect.
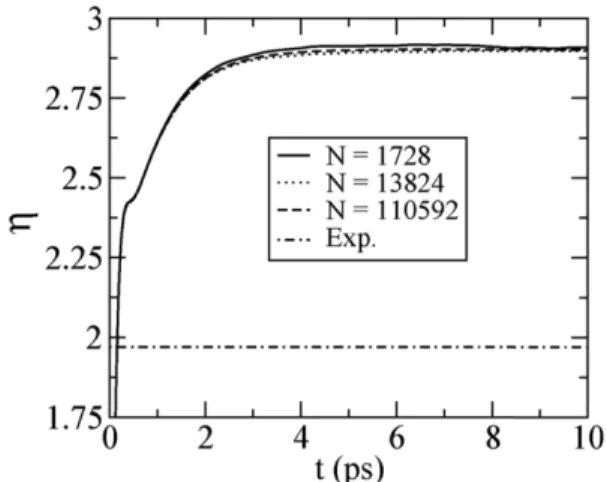
Running integrals for η(t) of liquid argon for N = 1728, 13824, and 110592 at 94.4 K and 1.374 g/cc are plotted as a function of time in Fig. 3. All the running integrals for viscosity clearly show plateaus which signify that the cor- responding SAC functions have decayed to zero and are fluctuating along the horizontal time axis. As shown in the
inset of Fig. 1, all the SAC functions reach zero at about 5 ps and we report the shear viscosities for N = 1728, 6912, 13824, 27648, and 110592 at 94.4 K and 1.374 g/cc in Table 1 by averaging the running integrals for shear vis- cosity in Fig. 3 for 5~10 ps. As the number of argon mol- ecules increases, η obtained from SAC decreases to the experimental and then increases slightly.
The shear viscosities, η, obtained by MD simulations at 94.4 K and 1.374 g/cc overestimate the experimental mea- sure for all the values of N. η for N = 13824 is closer to the experimental measure12 than those for larger N’s as shown in Table 1 and Fig. 3, but the result for N = 1728 is unre- liable due to the high fluctuation of the SAC function as seen in the inset of Fig. 1. Increasing further in N makes the result slightly worse. η = 2.895 mp for N = 13824 is better than the previously reported results for η of liquid argon at Figure 1. Stress auto-correlation functions SAC = Σi<Piαβ(0)
·Piαβ(t) > (kJ/mol·K·Å·ps3) of liquid argon at 94.4 K and 1.374 g/cc. The inset shows the detailed behavior of SAC functions.
kTV ---
Figure 2. Heat-flux auto-correlation functions HFAC = Σi< iα(0)
· iα(t) > (kJ/mol·Å3) of liquid argon at 94.4 K and 1.374 g/cc.
The inset shows the detailed behavior of HFAC functions.
kTV --- q·
q·
Figure 3. Running integrals for η(t) (mP) of liquid argon at 94.4 K and 1.374 g/cc.
MD Simulation of Liquid Argon 503
2014, Vol. 58, No. 5
the same state, 3.0811 and 3.04 mp4 by EMD, but not for 2.29 mp10 by EMD and 2.13 mp by NEMD.10 η obtained for N = 13824 using other LJ parameters [σ = 0.3268 nm and ε/kB = 119.8 K] is much better than that using the original LJ parameters [σ= 0.3405 nm and ε/kB= 119.8 K] as shown in Table 1.
The situation for HFAC is very similar to that for SAC. In the inset of Fig. 2, the detailed HFAC function in the very narrow y-axis around the zero correlation shows the high fluctuation of the HFAC function for N = 1728, but it low- ered with increasing number of argon molecules. The HFAC function for N = 13824 is better than that for N = 1728, and that for N = 110592 is more reliable.
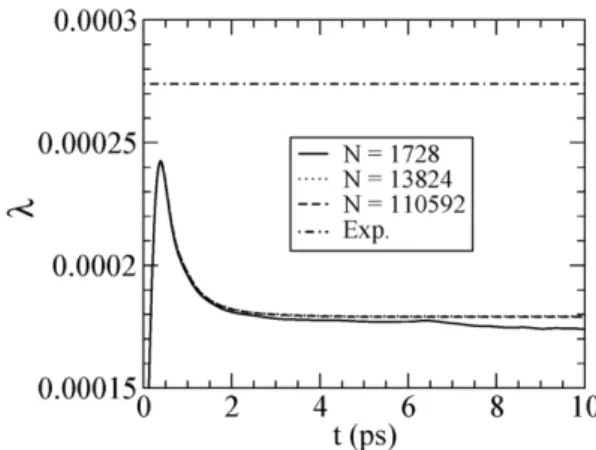
Running integrals for λ(t) of liquid argon for N = 1728, 13824, and 110592 at 94.4 K and 1.374 g/cc are plotted as a function of time in Fig. 4. All the running integrals for thermal conductivity clearly show plateaus which signify that the corresponding HFAC functions have decayed to zero and are fluctuating along the horizontal time axis. As shown in the inset of Fig. 2, all the HFAC functions reach zero at about 5 ps and we report the thermal conductivities for N = 1728, 6912, 13824, 27648, and 110592 at 94.4 K and 1.374 g/cc in Table 1 by averaging the running inte- grals for thermal conductivity in Fig. 3 for 5~10 ps.
The thermal conductivities, λ, obtained by MD simu- lations at 94.4 K and 1.374 g/cc underestimate the exper- imental measure12 for all the values of N. η for N = 13824 is the best among all the values of N in Table 1 and Fig. 4.
λ for N = 1728 is unreliable due to the high fluctuation of the HFAC function as seen in the inset of Fig. 2. λ for N = 13824 is better than λ for N = 110592 and increasing N also makes the result slightly worse. The previously reported results for λ of liquid argon at the same state were 1.84,10
3.05,11 and 1.55×10⁻⁴ cal/cm·s·K4 by EMD, and 2.31×10⁻⁴ cal/cm·s·K by NEMD.10 λ obtained for N = 13824 using other LJ parameters [σ = 0.3268 nm and ε/kB = 119.8 K] is much better than that using the original LJ parameters [σ = 0.3405 nm and ε/kB = 119.8 K] as the same for the case of η. In summary, we have carried out a series of equilibrium molecular dynamics (EMD) simulations of liquid argon at 94.4 K and 1.374 g/cc for the calculation of transport properties as a function of the number of argon molecules (N). While the diffusion coefficients (D) of gaseous argon approach the experimental values with increasing N, the viscosities (η) and thermal conductivities (λ) obtained for N = 1728 are unreliable due to the high fluctuation of the time correlation functions, but those for N = 13824 are rather acceptable. Increasing N further to 110592 brings the EMD results a slightly worse for η and λ. The EMD results for η overestimate and those for λ underestimate the experimental measurements,10 respectively, and it is not expected that further increase in N would give results closer to the experi- mental measurements. The use of the smaller size LJ parameter (σ) could improve the results for η and λ of liquid argon at 94.4 K and 1.374 g/cc but not for D. Therefore a system- atic EMD simulation using various values for LJ param- eters (σ and ε) is currently under study.
REFERENCES
1. Green, M. S. J. Chem. Phys. 1951, 19, 249; Green, M. S.
1952, 20, 1281; Green, M. S. 1954, 22, 398; Kubo, R. J.
Phys. Soc. Japan 1957, 12, 570.
2. Alder, B. J.; Wainwright, T. E. Phys. Rev. 1970, A1, 18;
Erpenbeck, J. J.; Wood, W. W. J. Stat. Phys. 1981, 24, 455.
3. Wood, W. W. Fundamental Problems in Statistical Mechanics III; ed. Cohen, E. G. D: 1975; p 331.
4. Lee, S. H. Bull. Korean Chem. Soc. 2007, 28, 1371.
5. Hirschfelder, J. O.; Curtiss, C. F.; Birds, R. B. Molecular Theory of Gases and Liquids; John Wiley: NY, 1954;
p 1212.
6. Allen, M. P.; Tildesley, D. J. Computer Simulation of Liq- uids; Oxford Univ. Press.: Oxford, 1987; p 64.
7. Allen, M. P.; Tildesley, D. J. Computer Simulation of Liq- uids; Oxford Univ. Press.: Oxford, 1987; p 81.
8. Rahman, A. Phys. Rev. 1964, 136A, 405.
9. Naghizadeh J.; Rice, S. A. J. Chem. Phys. 1962, 36, 2710.
10. Moon, C. B.; Moon, G. K.; Lee, S. H. Bull. Korean Chem.
Soc. 1991, 12, 309.
11. Lee, S. H.; Park, D. K.; Kang, D. B. Bull. Korean Chem.
Soc. 2003, 24, 178.
12. Cook, G. A. Argon, Helium and the Rare Gases; Inter- science: NY, 1961.
Figure 4. Running integrals for λ(t) (cal/cm·s·K) of liquid argon at 94.4 K and 1.374 g/cc.