eISSN 2005-372X https://doi.org/10.4041/kjod
12
0
0
전체 글
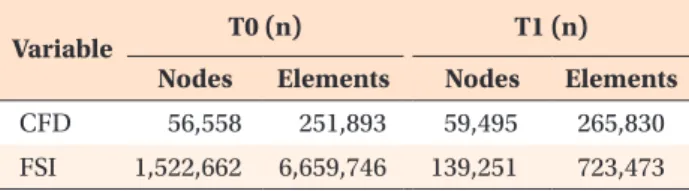
(2) Hur et al • 3D-FSI analysis for effect of MARPE on airflow. INTRODUCTION. MATERIALS AND METHODS. Obstructive sleep apnea syndrome (OSAS) is charac terized by the temporary cessation of breathing (apnea) or shallow breathing (hypopnea) with decreased he moglobin oxygen saturation.1 On the basis of the etio logy, severity, and collapse site in the upper airway (UA), various treatment modalities have been applied, such as weight reduction, continuous positive airway pressure therapy, intraoral appliance therapy, soft tissue procedures, and maxillomandibular advancement (MMA) surgery.1-3 Although conventional rapid palatal expansion (RPE) with tooth-borne anchorage has been suggested as a treatment option for OSAS, the subjects in most previous studies were children.4-6 Because conventional RPE is thought to be less effective for adult patients, use of surgery-assisted RPE (SARPE) is recommended for adult patients with OSAS.7-9 However, it has some disadvantages, including surgical invasiveness and a long retention period. Of late, miniscrew-assisted RPE (MARPE) has been receiving attention by clinicians because of increased orthopedic effects on expansion of the maxillary basal arch width when compared with conventional RPE.10 Moreover, it induces noninvasive expansion of the midpalatal suture in adult patients, as opposed to SARPE.11-13 Although MARPE is thought to be helpful for relieving the symptoms of OSAS in adult patients,14,15 scientific evidence regarding its effects is limited. Three-dimensional (3D) computational fluid dynamics (CFD) has been used to investigate airflow dynamics in patients with OSAS. 3,16-20 However, because UA, particularly the pharynx, is a deformable structure, ado ption of fluid-structure interaction (FSI), which is a computational method to simulate flow and structural changes, has been recommended. 17,21 The use of FSI simulation can overcome the limitation of the rigid wall design in CFD and provide more realistic results compared with CFD.17,21 Despite the important anatomical and physiological roles of the nasal cavity (NC) in respiration, most nu merical airflow simulation studies have omitted this structure during the fabrication of 3D airway mo dels because of the complex structure and diverse shape as well as the computational cost of airflow simulation.16-20 To investigate the effects of MARPE on the airflow dynamics in UA, NC must be included in 3D-computational modeling and FSI analysis.22,23 From these perspectives, we conducted the present study to investigate the effects of MARPE on airflow in UA of an adult patient with OSAS using 3D-CFD/FSI analysis.. Geometric modeling For the fabrication of geometric models, a male patient with OSAS aged 18 years and 7 months was selected. The patient presented with a narrow maxillary basal arch and severe crowding and refused to use an intraoral appliance or undergo MMA surgery. Accor dingly, MARPE was selected as the treatment method. Before the initiation of MARPE, he underwent an inlaboratory polysomnography study (age, 18 years and 7 months; body mass index [BMI], 25.0 kg/m2; apnea and hypopnea index [AHI], 49.5 events/hour; respiratory disturbance index [RDI], 52.2 events/hour; lowest O 2 saturation rate [LSR], 85%). After the completion of MARPE at S-plant Dental Hospital in Seoul, Korea, his signs and symptoms of OSAS significantly resolved (age, 19 years and 1 month; BMI, 24.9 kg/m2; AHI, 2.2 events/hour; RDI, 20.2 events/hour; LSR, 95%). This study was reviewed and approved by the Institutional Review Board of the School of Dentistry Seoul National University, Seoul, Korea (S-D20170001). Cone-beam computed tomography (CBCT) was performed (3D eXam; Imaging Sciences International, Hatfield, PA, USA) before (T0) and 6 months after (T1) MARPE using the following parameters: volume size, 23-cm diameter × 17-cm height; resolution, 0.3 voxel; exposure conditions, 37.1 mA and 120 kVp for 17.8 seconds. Although there is no standardized method for setting the head and tongue posture during 3D image acquisition, CBCT was performed using the natural head posture and the letter “N” tongue posture in the present study. For the letter “N” tongue posture, the patient was instructed to place the tongue on the roof of the mouth, directly behind the anterior teeth without pressing against them, and purse the lips together.24 Digital imaging and communications in medicine (DICOM) data obtained at the T0 and T1 stages were exported to ICEM-CFD (ver. 15; ANSYS Inc., Canonsburg, PA, USA) to fabricate the surface model (STL file). Then,. 354. Table 1. Numbers of nodes and elements before (T0) and 6 months after (T1) MARPE in the three-dimensional upper airway models of an adult patient with obstructive sleep apnea syndrome Variable CFD FSI. T0 (n) Nodes. T1 (n). Elements. Nodes. Elements. 56,558. 251,893. 59,495. 265,830. 1,522,662. 6,659,746. 139,251. 723,473. MARPE, Miniscrew-assisted rapid palatal expansion; CFD, computational fluid dynamics; FSI, fluid-structure interac tion.. https://doi.org/10.4041/kjod.2017.47.6.353. www.e-kjo.org.
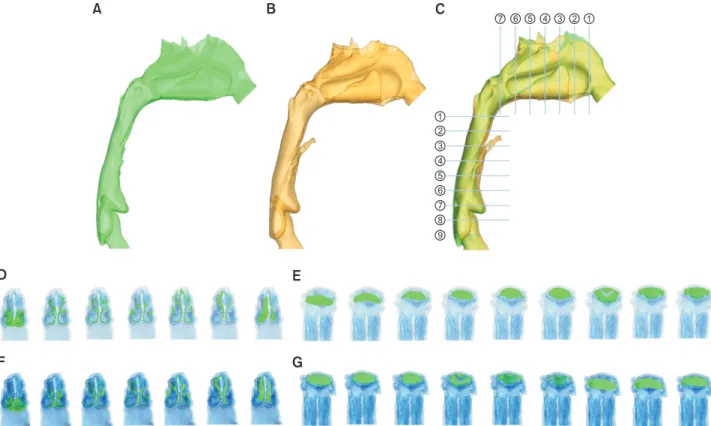
(3) Hur et al • 3D-FSI analysis for effect of MARPE on airflow. A. B. C. 7. 6. 5. 4. 3. 2. 1. 1 2 3 4 5 6 7 8 9. D. E. F. G. Figure 1. Three-dimensional models of the upper airway. T0 (A, green), T1 (B, yellow) and superimposition (C) of the models showing the locations of seven planes in the nasal cavity and nine planes in the pharynx. The superimposition was performed with the best-fit method using the anterior cranial base of T0 and T1 models, making the other structures invisible, then showing the upper airway only. Comparison of the cross sectional airway area between T0 (D and E) and T1 (F and G) at sections from ① to ⑦ in nasal cavity (D and F, from left to right) and from ① to ⑨ in Pharynx (E and G, from left to right).. 3. 3D computational models of UA, including NC and the pharynx, were constructed. The meshes were generated with tetrahedron and prism elements. The total number of nodes and elements in each model is summarized in Table 1.. Maximum inspiration 1.080 s. Airflow (L/sec). 2 1 0 Rest 1.730 s. 1 Maximum expiration 2.805 s. 2 0. 1. 2. 3. 4. 5. t. Figure 2. Respiratory cycle used for fluid-structure interaction simulation to investigate the effects of mini screw-assisted rapid palatal expansion on the upper airway airflow in an adult patient with obstructive sleep apnea syndrome. Total duration of one cycle, 5 seconds. Maximum inspiration at 1.080 seconds, rest at 1.730 seconds, and maximum expiration at 2.805 seconds.. www.e-kjo.org. https://doi.org/10.4041/kjod.2017.47.6.353. Computational FSI simulation FSI simulation of UA was performed under the following conditions: boundary conditions, atmospheric pressure for the inlet and a regular respiration pattern (quantity/time) for the outlet; material properties, Young’s modulus of 7,540 Pa and Poisson’s ratio of 0.4525; seven planes in the NC area, with an interplane distance of 10 mm from the aperture of the nostril to the beginning of the pharynx (Figure 1); and nine planes in the pharynx area, with an interplane distance of 10 mm from the beginning of the pharynx to the beginning of the larynx (Figure 1). The respiratory cycle used during simulation is described in Figure 2. For airflow simulation, the flow was assumed to be incompressible. The governing differential equations, the Reynolds-averaged Navier–Stokes equation for. 355.
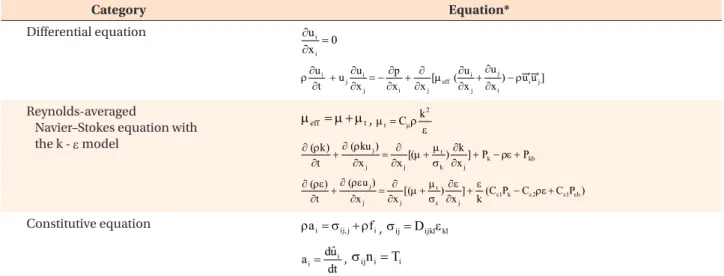
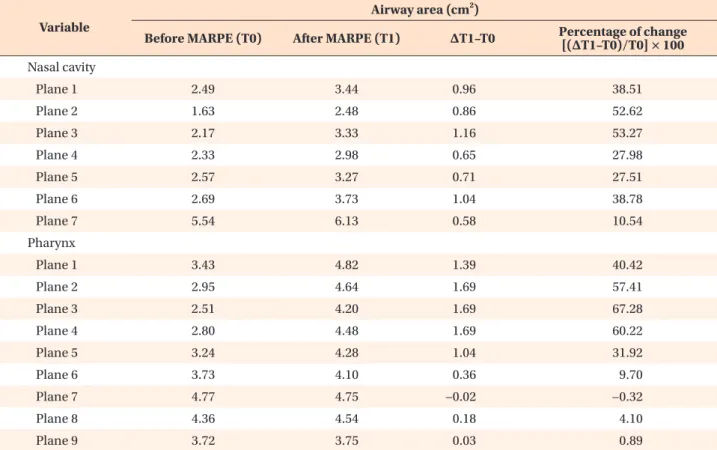
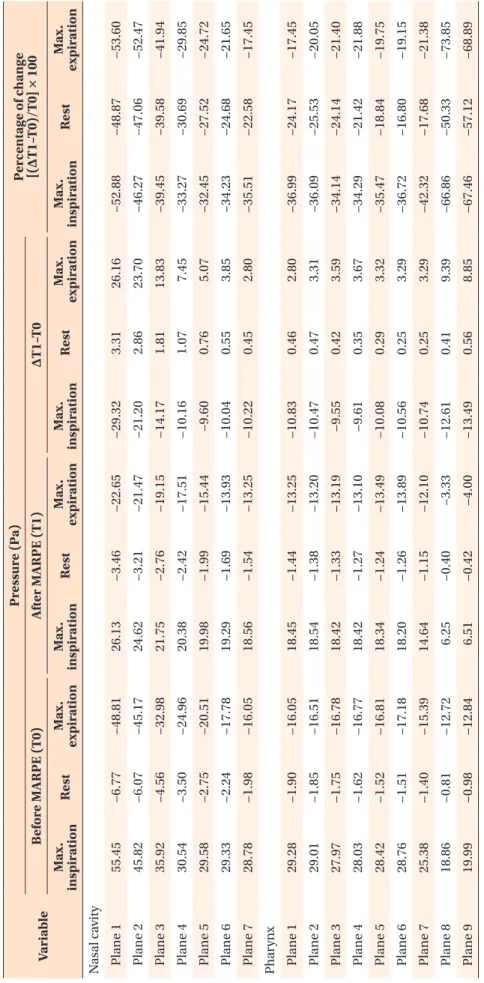
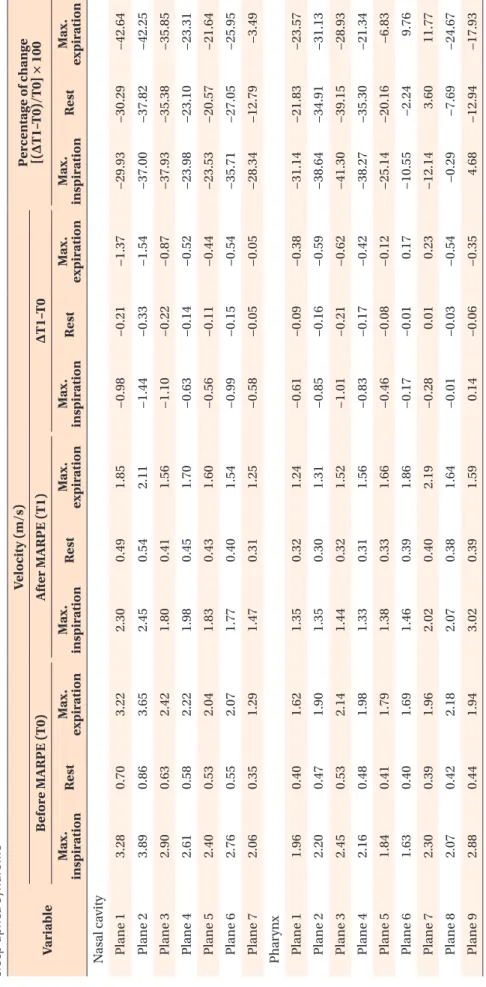
(4) Hur et al • 3D-FSI analysis for effect of MARPE on airflow. turbulence with the k - ε model, and constitutive equa tions for structure dynamics are shown in Table 2. Constant air density (1.185 kg/m3) and viscosity (1.831 × 10⁻⁵ kg/m∙s) values were assumed. No-slip wall boundary conditions were imposed on the airway walls. The cross-sectional airway area at each plane was assessed at T0 and T1. In addition, airflow pressure and velocity, node displacement in the soft tissue of the airway wall, and the average pressure, the flow rate, and the total resistance were measured at maximum inspiration (MI), rest, and maximum expiration (ME) at both time points. Changes in the total resistance of airflow were calculated on the basis of changes in each variable from T0 to T1.. RESULTS Changes in the cross-sectional airway area (Table 3) In NC, the cross-sectional area at planes 1 to 3 showed a significant increase (range of increase: 0.96 cm 2 to 1.16 cm 2, 38.5% to 53.3%) at T1 compared with that at T0, while the area at planes 4 to 6 showed a moderate increase (0.65 cm 2 to 1.04 cm 2, 27.5% to 38.8%) and the area at plane 7 showed a slight increase. In the pharynx, a strong increasing trend was observed at planes 1 to 4 (1.39 cm2 to 1.69 cm2, 40.4% to 67.3%); this trend weakened at planes 5 and disappeared at planes 6 to 9. These findings imply that MARPE primarily affected the anterior and middle parts of NC, the nasopharynx (planes 1 and 2) and the upper and middle part of the oropharynx (planes 3, 4, and 5). The amount of increase in the cross-sectional airway area was larger for the pharynx than for NC, even though the pharynx was located farther than NC from. the MARPE appliance. Changes in the pressure and velocity of airflow (Tables 4 and 5, Figures 3 and 4) At planes 1 to 7 in NC and planes 1 to 5 in the pharynx, the absolute values for airflow pressure and velocity at MI, rest, and ME were lower at T1 than at T0. In NC, airflow pressure and velocity at MI showed a significant decrease at planes 1 to 4 and planes 1, 2, 3, and 7, respectively, after MARPE (pressure: −29.3 Pa to −10.2 Pa, −52.9% to −33.3%; velocity: −0.98 m/s to −1.44 m/s; −29.9% to −37.9%). At rest, there was a slight decrease in pressure and no significant change in velocity at all seven planes. At ME, there was a decrease in pressure at planes 1 to 7 (26.2 Pa to 2.8 Pa, −53.6% to −17.5%) and a decrease in velocity at planes 1 to 3 (−0.87 m/s to −1.54 m/s; −35.9% to −42.6%). In the pharynx, at MI, there was a considerable decrease in pressure at planes 1 to 7 (−9.6 Pa to −10.8 Pa; −34.1% to −37.0%) and a significant decrease in pressure at planes 8 (−12.6 Pa, −66.9%) and 9 (−13.5 Pa, −67.5%). Velocity showed a significant decrease at planes 1 to 4 (−0.61 m/s to −1.01 m/s; −31.1% to −41.3%), a moderate decrease at planes 5 to 7, and no significant change at planes 8 and 9. At rest, there were no significant changes in pressure and velocity at any of the nine planes. At ME, there was a steady pressure drop at planes 1 to 7 and a substantial drop at planes 8 (9.4 Pa, −73.9%) and 9 (8.9 Pa, −68.9%). Velocity also decreased at planes 1 through 5.. Table 2. The governing equations for numerical turbulence model Category Differential equation. Equation* ∂u i =0 ∂x i ρ. Reynolds-averaged Navier–Stokes equation with the k - ε model. ∂u i ∂u ∂p ∂ ∂u ∂u j + + uj i = − [µ eff ( i + ) − ρu ′i u ′j ] ∂t ∂x j ∂x i ∂x j ∂x j ∂x i. µ eff = µ + µ t , µ t = Cµρ k. 2. ε. µ ∂k ∂ (ρk ) ∂ (ρku j ) ∂ [(µ + t ) ] + Pk − ρε + Pkb + = ∂t ∂x j ∂x j s k ∂x j µ ∂ε ∂ (ρε) ∂ (ρε u j ) ∂ ε + = [(µ + t ) ] + (C ε1Pk − C ε 2ρε + C ε1Pεb ) ∂t ∂x j ∂x j s ε ∂x j k. Constitutive equation. ρa i = sij, j + ρf i , sij = D ijkl ε kl ai =. duˆ i s n = T , ij i i dt. *Where t is the time on the structure domain, ni is the unit outward pointing normal on the wall surface, Ti is the surface traction vector at time t, sij is the mechanical stress tensor, Dijkl is the Lagrangian elasticity tensor, and ekl is the strain tensor.. 356. https://doi.org/10.4041/kjod.2017.47.6.353. www.e-kjo.org.
(5) Hur et al • 3D-FSI analysis for effect of MARPE on airflow. Table 3. Changes in the cross-sectional airway area in the nasal cavity and pharynx after MARPE in an adult patient with obstructive sleep apnea syndrome Airway area (cm2) Variable. ∆T1–T0. Percentage of change [(∆T1–T0)/T0] × 100. Before MARPE (T0). After MARPE (T1). Plane 1. 2.49. 3.44. 0.96. 38.51. Plane 2. 1.63. 2.48. 0.86. 52.62. Plane 3. 2.17. 3.33. 1.16. 53.27. Plane 4. 2.33. 2.98. 0.65. 27.98. Plane 5. 2.57. 3.27. 0.71. 27.51. Plane 6. 2.69. 3.73. 1.04. 38.78. Plane 7. 5.54. 6.13. 0.58. 10.54. Plane 1. 3.43. 4.82. 1.39. 40.42. Plane 2. 2.95. 4.64. 1.69. 57.41. Plane 3. 2.51. 4.20. 1.69. 67.28. Plane 4. 2.80. 4.48. 1.69. 60.22. Plane 5. 3.24. 4.28. 1.04. 31.92. Plane 6. 3.73. 4.10. 0.36. 9.70. Plane 7. 4.77. 4.75. −0.02. −0.32. Plane 8. 4.36. 4.54. 0.18. 4.10. Plane 9. 3.72. 3.75. 0.03. 0.89. Nasal cavity. Pharynx. MARPE, Miniscrew-assisted rapid palatal expansion.. Changes in node displacement in the soft tissue of the airway wall (Table 6 and Figure 5) In both NC and the pharynx, the node displacement value showed a decreasing pattern from MI to rest and an increasing pattern from rest to ME, particularly after MARPE. However, there was no clinically meaningful change in the absolute values, regardless of the res piration stage. These findings indicate that the changes in airflow pressure and velocity (Tables 4 and 5) did not affect node displacement in both NC and the pharynx (Table 6). Changes in the average pressure, flow rate, and total resistance (Table 7) Considering the significant decrease in the average pressure at MI (−55.5%), rest (−49.7%), and ME (−52.6%) from T0 to T1, the total resistance also exhibited a significant decrease at MI (−55.1%), rest (−35.9%), and ME (−33.9%).. DISCUSSION In the present study, we investigated the effects of MARPE on airflow in UA of an adult patient with OSAS. www.e-kjo.org. https://doi.org/10.4041/kjod.2017.47.6.353. using 3D-CFD/FSI analysis. The findings are discussed in detail as follows. Changes in the cross-sectional airway area The amount of increase in the cross-sectional airway area after MARPE was significantly larger in the anterior NC than in the posterior NC (Table 3). The increase extended below to the oropharynx (planes 1, 2, and 3) and the upper part of the laryngopharynx (planes 4 and 5; Table 3). Because of the anatomical continuity of NC and the pharynx, transverse expansion of the hard palate through MARPE can directly and indirectly increase the cross-sectional airway area at the NC and pharynx, respectively. These results are in agreement with those of previous studies that reported enlargement of the pharyngeal airway after conventional RPE in children26 and SARPE in adults.9 The amount of increase in the cross-sectional area was larger for the pharynx than for NC (Table 3). We believe this was because of the complex structure of NC, which primarily comprises hard tissues such as the nasal septum, conchae, and palatal bone. On the other hand, the pharynx is a relatively simple tubing system made of soft tissue.. 357.
(6) 358. 29.33. 28.78. Plane 6. Plane 7. 25.38. 18.86. 19.99. Plane 7. Plane 8. Plane 9. −0.98. −0.81. −1.40. −1.51. −1.52. −1.62. −1.75. −1.85. −1.90. −1.98. −2.24. −2.75. −3.50. −4.56. −6.07. −6.77. Rest. −12.84. −12.72. −15.39. −17.18. −16.81. −16.77. −16.78. −16.51. −16.05. −16.05. −17.78. −20.51. −24.96. −32.98. −45.17. −48.81. Max. expiration. Pressure (Pa). 6.51. 6.25. 14.64. 18.20. 18.34. 18.42. 18.42. 18.54. 18.45. 18.56. 19.29. 19.98. 20.38. 21.75. 24.62. 26.13. Max. inspiration. −0.42. −0.40. −1.15. −1.26. −1.24. −1.27. −1.33. −1.38. −1.44. −1.54. −1.69. −1.99. −2.42. −2.76. −3.21. −3.46. Rest. −4.00. −3.33. −12.10. −13.89. −13.49. −13.10. −13.19. −13.20. −13.25. −13.25. −13.93. −15.44. −17.51. −19.15. −21.47. −22.65. −13.49. −12.61. −10.74. −10.56. −10.08. −9.61. −9.55. −10.47. −10.83. −10.22. −10.04. −9.60. −10.16. −14.17. −21.20. −29.32. Max. Max. expiration inspiration. After MARPE (T1). MARPE, Miniscrew-assisted rapid palatal expansion. Maximum (Max.) inspiration, 1.080 seconds; Rest, 1.730 seconds; Max. expiration, 2.805 seconds.. 28.42. 28.76. Plane 5. 28.03. Plane 4. Plane 6. 29.01. 27.97. Plane 2. Plane 3. 29.28. Plane 1. Pharynx. 30.54. 29.58. Plane 4. 35.92. Plane 3. Plane 5. 55.45. 45.82. Plane 1. Max. inspiration. Plane 2. Nasal cavity. Variable. Before MARPE (T0). 0.56. 0.41. 0.25. 0.25. 0.29. 0.35. 0.42. 0.47. 0.46. 0.45. 0.55. 0.76. 1.07. 1.81. 2.86. 3.31. Rest. ∆T1–T0. 8.85. 9.39. 3.29. 3.29. 3.32. 3.67. 3.59. 3.31. 2.80. 2.80. 3.85. 5.07. 7.45. 13.83. 23.70. 26.16. −67.46. −66.86. −42.32. −36.72. −35.47. −34.29. −34.14. −36.09. −36.99. −35.51. −34.23. −32.45. −33.27. −39.45. −46.27. −52.88. Max. Max. expiration inspiration. −57.12. −50.33. −17.68. −16.80. −18.84. −21.42. −24.14. −25.53. −24.17. −22.58. −24.68. −27.52. −30.69. −39.58. −47.06. −48.87. Rest. −68.89. −73.85. −21.38. −19.15. −19.75. −21.88. −21.40. −20.05. −17.45. −17.45. −21.65. −24.72. −29.85. −41.94. −52.47. −53.60. Max. expiration. Percentage of change [(∆T1–T0)/T0] × 100. Table 4. Changes in airflow pressure in the nasal cavity and pharynx after MARPE in an adult patient with obstructive sleep apnea syndrome. Hur et al • 3D-FSI analysis for effect of MARPE on airflow. https://doi.org/10.4041/kjod.2017.47.6.353. www.e-kjo.org.
(7) www.e-kjo.org. https://doi.org/10.4041/kjod.2017.47.6.353. 3.89. 2.90. 2.61. 2.40. 2.76. 2.06. Plane 2. Plane 3. Plane 4. Plane 5. Plane 6. Plane 7. 2.20. 2.45. 2.16. 1.84. 1.63. 2.30. 2.07. 2.88. Plane 2. Plane 3. Plane 4. Plane 5. Plane 6. Plane 7. Plane 8. Plane 9. 0.44. 0.42. 0.39. 0.40. 0.41. 0.48. 0.53. 0.47. 0.40. 0.35. 0.55. 0.53. 0.58. 0.63. 0.86. 0.70. Rest. 1.94. 2.18. 1.96. 1.69. 1.79. 1.98. 2.14. 1.90. 1.62. 1.29. 2.07. 2.04. 2.22. 2.42. 3.65. 3.22. Max. expiration. 3.02. 2.07. 2.02. 1.46. 1.38. 1.33. 1.44. 1.35. 1.35. 1.47. 1.77. 1.83. 1.98. 1.80. 2.45. 2.30. Max. inspiration. 0.39. 0.38. 0.40. 0.39. 0.33. 0.31. 0.32. 0.30. 0.32. 0.31. 0.40. 0.43. 0.45. 0.41. 0.54. 0.49. Rest. 1.59. 1.64. 2.19. 1.86. 1.66. 1.56. 1.52. 1.31. 1.24. 1.25. 1.54. 1.60. 1.70. 1.56. 2.11. 1.85. Max. expiration. After MARPE (T1). −0.03 −0.06. 0.14. 0.01. −0.01. −0.08. −0.17. −0.21. −0.16. −0.09. −0.05. −0.15. −0.11. −0.14. −0.22. −0.33. −0.21. Rest. ∆T1–T0. −0.01. −0.28. −0.17. −0.46. −0.83. −1.01. −0.85. −0.61. −0.58. −0.99. −0.56. −0.63. −1.10. −1.44. −0.98. Max. inspiration. MARPE, Miniscrew-assisted rapid palatal expansion. Maximum (Max.) inspiration, 1.080 seconds; Rest, 1.730 seconds; Max. expiration, 2.805 seconds.. 1.96. Plane 1. Pharynx. 3.28. Max. inspiration. Plane 1. Nasal cavity. Variable. Before MARPE (T0). Velocity (m/s). −0.35. −0.54. 0.23. 0.17. −0.12. −0.42. −0.62. −0.59. −0.38. −0.05. −0.54. −0.44. −0.52. −0.87. −1.54. −1.37. Max. expiration. 4.68. −0.29. −12.14. −10.55. −25.14. −38.27. −41.30. −38.64. −31.14. −28.34. −35.71. −23.53. −23.98. −37.93. −37.00. −29.93. Max. inspiration. −12.94. −7.69. 3.60. −2.24. −20.16. −35.30. −39.15. −34.91. −21.83. −12.79. −27.05. −20.57. −23.10. −35.38. −37.82. −30.29. Rest. −17.93. −24.67. 11.77. 9.76. −6.83. −21.34. −28.93. −31.13. −23.57. −3.49. −25.95. −21.64. −23.31. −35.85. −42.25. −42.64. Max. expiration. Percentage of change [(∆T1–T0)/T0] × 100. Table 5. Changes in airflow velocity (Max. inspiration, rest, and Max. expiration) in the nasal cavity and pharynx after MARPE in an adult patient with obstructive sleep apnea syndrome. Hur et al • 3D-FSI analysis for effect of MARPE on airflow. 359.
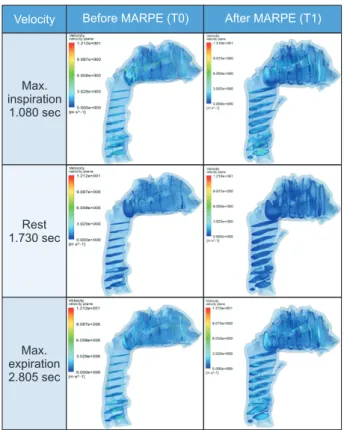
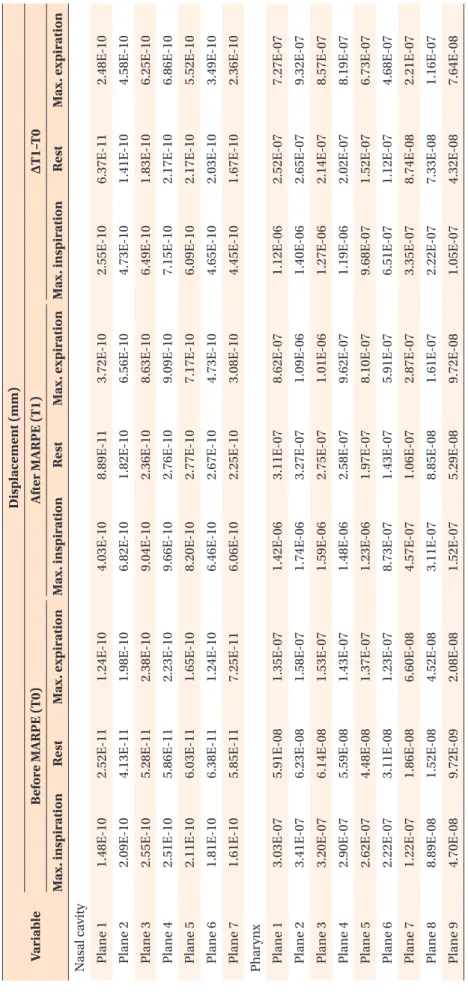
(8) Hur et al • 3D-FSI analysis for effect of MARPE on airflow. Pressure. Before MARPE (T0). After MARPE (T1). Velocity. Max. inspiration 1.080 sec. Max. inspiration 1.080 sec. Rest 1.730 sec. Rest 1.730 sec. Max. expiration 2.805 sec. Max. expiration 2.805 sec. Before MARPE (T0). After MARPE (T1). Figure 3. Changes in airflow pressure in the nasal cavity and pharynx at maximum (Max.) inspiration, rest, and Max. expiration after miniscrew-assisted rapid palatal expansion (MARPE) in an adult patient with obstructive sleep apnea syndrome.. Figure 4. Changes in airflow velocity in the nasal cavity and pharynx at maximum (Max.) inspiration, rest, and Max. expiration after miniscrew-assisted rapid palatal expansion (MARPE) in an adult patient with obstructive sleep apnea syndrome.. Changes in airflow pressure and velocity After MARPE, we found a pressure drop in NC and the pharynx at MI and ME. A decrease in airflow velocity existed primarily in the anterior NC at both ME and MI and the oropharynx (planes 1 to 3) and upper part of the laryngopharynx (planes 4 and 5) at MI (Tables 4 and 5, Figures 3 and 4). Although NC exhibited a smaller increase in the cross-sectional airway area compared with the pharynx (Table 3), the former exhibited a greater decrease in both pressure and velocity compared with the pharynx. This was probably because the anterior NC plays an important role as the main entrance and exit for airflow and decreases the airflow resistance in UA (Tables 4 and 5). The impact of NC expansion may extend to the middle part of the oropharynx (Tables 4 and 5, Figures 3 and 4). These results are in accordance with those of Iwasaki et al.22 However, their study modeled only NC; therefore, their data cannot be generalized to the entire process of respiration. Because the differences in pressure and velocity bet ween inspiration and expiration decreased after MARPE (Tables 4 and 5, Figures 3 and 4), it can be stated that MARPE smoothened the airflow gradient and improved. the respiration quality.. 360. Changes in node displacement in the soft tissue of the airway wall The amount of node displacement in both NC and the pharynx was too small to be considered clinically meaningful (Table 6 and Figure 5). This finding was not concordant with that in a previous FSI study by Zhao et al.,17 who reported that the amount of node displacement in the pharynx appeared to be significant. This difference in findings may have resulted from the fact that we included NC in our 3D airway models, whereas Zhao et al.17 excluded the same. Therefore, the findings from our study suggest that the airway wall in NC and the pharynx do not move during the respiratory cycle to the extent reported by Zhao et al.17 In other words, the amounts of node displacement in the pharynx turned into insignificant when the nasal cavity was included in FSI analysis. Changes in the average pressure, flow rate, and total resistance In the present study, MARPE significantly decreased. https://doi.org/10.4041/kjod.2017.47.6.353. www.e-kjo.org.
(9) www.e-kjo.org. https://doi.org/10.4041/kjod.2017.47.6.353. 1.61E-10. Plane 7. 8.89E-08. 4.70E-08. Plane 8. Plane 9. 9.72E-09. 1.52E-08. 1.86E-08. 3.11E-08. 4.48E-08. 5.59E-08. 6.14E-08. 6.23E-08. 5.91E-08. 5.85E-11. 6.38E-11. 6.03E-11. 5.86E-11. 5.28E-11. 4.13E-11. 2.52E-11. 2.08E-08. 4.52E-08. 6.60E-08. 1.23E-07. 1.37E-07. 1.43E-07. 1.53E-07. 1.58E-07. 1.35E-07. 7.25E-11. 1.24E-10. 1.65E-10. 2.23E-10. 2.38E-10. 1.98E-10. 1.24E-10. Max. expiration. 1.52E-07. 3.11E-07. 4.57E-07. 8.73E-07. 1.23E-06. 1.48E-06. 1.59E-06. 1.74E-06. 1.42E-06. 6.06E-10. 6.46E-10. 8.20E-10. 9.66E-10. 9.04E-10. 6.82E-10. 4.03E-10. Max. inspiration. 5.29E-08. 8.85E-08. 1.06E-07. 1.43E-07. 1.97E-07. 2.58E-07. 2.75E-07. 3.27E-07. 3.11E-07. 2.25E-10. 2.67E-10. 2.77E-10. 2.76E-10. 2.36E-10. 1.82E-10. 8.89E-11. Rest. 2.22E-07 1.05E-07. 9.72E-08. 3.35E-07. 6.51E-07. 9.68E-07. 1.19E-06. 1.27E-06. 1.40E-06. 1.12E-06. 4.45E-10. 4.65E-10. 6.09E-10. 7.15E-10. 6.49E-10. 4.73E-10. 2.55E-10. 1.61E-07. 2.87E-07. 5.91E-07. 8.10E-07. 9.62E-07. 1.01E-06. 1.09E-06. 8.62E-07. 3.08E-10. 4.73E-10. 7.17E-10. 9.09E-10. 8.63E-10. 6.56E-10. 3.72E-10. Max. expiration Max. inspiration. After MARPE (T1). MARPE, Miniscrew-assisted rapid palatal expansion. Maximum (Max.) inspiration, 1.080 seconds; Rest, 1.730 seconds; Max. expiration, 2.805 seconds.. 2.22E-07. 1.22E-07. Plane 6. 2.62E-07. Plane 5. Plane 7. 3.20E-07. 2.90E-07. Plane 3. 3.41E-07. Plane 2. Plane 4. 3.03E-07. Plane 1. Pharynx. 2.11E-10. 1.81E-10. Plane 5. 2.51E-10. Plane 4. Plane 6. 2.09E-10. 2.55E-10. Plane 2. Plane 3. 1.48E-10. Rest. Before MARPE (T0). Max. inspiration. Plane 1. Nasal cavity. Variable. Displacement (mm). 4.32E-08. 7.33E-08. 8.74E-08. 1.12E-07. 1.52E-07. 2.02E-07. 2.14E-07. 2.65E-07. 2.52E-07. 1.67E-10. 2.03E-10. 2.17E-10. 2.17E-10. 1.83E-10. 1.41E-10. 6.37E-11. Rest. ∆T1–T0. 7.64E-08. 1.16E-07. 2.21E-07. 4.68E-07. 6.73E-07. 8.19E-07. 8.57E-07. 9.32E-07. 7.27E-07. 2.36E-10. 3.49E-10. 5.52E-10. 6.86E-10. 6.25E-10. 4.58E-10. 2.48E-10. Max. expiration. Table 6. Changes in node displacement in the soft tissue of the airway wall (Max. inspiration, rest, and Max. expiration) after MARPE in an adult patient with obstructive sleep apnea syndrome. Hur et al • 3D-FSI analysis for effect of MARPE on airflow. 361.
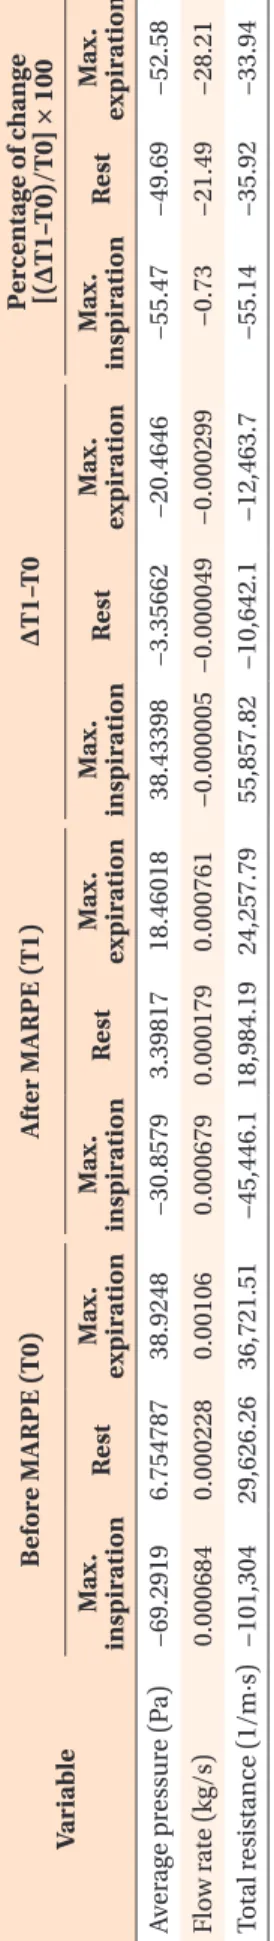
(10) 362. https://doi.org/10.4041/kjod.2017.47.6.353. MARPE, Miniscrew-assisted rapid palatal expansion. Maximum (Max.) inspiration, 1.080 seconds; Rest, 1.730 seconds; Max. expiration, 2.805 seconds. Adopting the electric current formula (R = V/I, where V is the voltage, I is the current, and R is the resistance), the resistance can be calculated using the following equation: R = P/Q, where P is the pressure, Q is the quantity of fluid current, and R is the resistance.. −33.94. −28.21 −21.49. −35.92 −55.14. −0.73 −0.000299. −12,463.7 55,857.82 −10,642.1. −0.000005 −0.000049 0.000761 0.000179. −45,446.1 18,984.19 24,257.79. 0.000679 0.00106. 29,626.26 36,721.51. 0.000228 0.000684 Flow rate (kg/s). Total resistance (1/m∙s) −101,304. −52.58 −49.69 −55.47 −20.4646 −3.35662 38.43398 18.46018. Max. expiration Rest Max. inspiration Max. expiration Rest Max. Max. expiration inspiration Rest. 3.39817 −30.8579 38.9248 6.754787 −69.2919. Three-dimensional CFD/FSI analysis with an appro priate model incorporating NC and the pharynx showed. Average pressure (Pa). CONCLUSION. Max. Max. expiration inspiration. the total resistance in UA during the entire respiratory cycle (Table 7). This finding is in accordance with that from a previous review,27 which suggested that expansion of the NC floor can benefit patients with a constricted maxillary arch and nasal airflow problem. Because we included NC in our 3D computational model and used FSI simulation, our results may reveal more realistic effects of MARPE on changes in the airflow of adult patients with OSAS compared with previous studies. 9,18,23,27 However, further studies will be needed to use CT data of OSAS patients taken in the supine position and to find more realistic values of material properties of the upper airway for better CFD/FSI model. And it should also be endeavored to investigate other treatment modalities for OSAS (e.g., intraoral appliance, soft tissue procedures, and MMA) with a large sample size.. Rest. Figure 5. Changes in node displacement in the soft tissue of the airway wall at maximum (Max.) inspiration, rest, and Max. expiration after miniscrew-assisted rapid palatal expansion (MARPE) in an adult patient with obstructive sleep apnea syndrome.. Max. inspiration. Max. expiration 2.805 sec. Variable. Rest 1.730 sec. Percentage of change [(∆T1–T0)/T0] × 100. Max. inspiration 1.080 sec. ∆T1–T0. After MARPE (T1). After MARPE (T1). Before MARPE (T0). Before MARPE (T0). Node displacement. Table 7. Changes in the average pressure, flow rate, and total resistance (Max. inspiration, rest, and Max. expiration) after MARPE in an adult patient with obstructive sleep apnea syndrome. Hur et al • 3D-FSI analysis for effect of MARPE on airflow. www.e-kjo.org.
(11) Hur et al • 3D-FSI analysis for effect of MARPE on airflow. an improvement in airflow and a decrease in resistance in UA after MARPE. MARPE can serve as an alternative treatment modality for adult patients with who have moderate to severe narrow basal arch and crowding and refuse to the intraoral appliance or MMA surgery.. REFERENCES 1. Ahn HW, Cho IS, Cho KC, Choi JY, Chung JW, Baek SH. Surgical treatment modality for facial esthetics in an obstructive sleep apnea patient with protrusive upper lip and acute nasolabial angle. Angle Orthod 2013;83:355-63. 2. Epstein LJ, Kristo D, Strollo PJ Jr, Friedman N, Malhotra A, Patil SP, et al. Clinical guideline for the evaluation, management and long-term care of obstructive sleep apnea in adults. J Clin Sleep Med 2009;5:263-76. 3. Kim T, Kim HH, Hong So, Baek SH, Kim KW, Suh SH, et al. Change in the upper airway of pati ents with obstructive sleep apnea syndrome using computational fluid dynamics analysis: Conventional maxillomandibular advancement versus modified maxillomandibular advancement with anterior segmental setback osteotomy. J Craniofac Surg 2015;26:e765-70. 4. Katyal V, Pamula Y, Daynes CN, Martin J, Dreyer CW, Kennedy D, et al. Craniofacial and upper airway morphology in pediatric sleep-disordered breathing and changes in quality of life with rapid maxillary expansion. Am J Orthod Dentofacial Orthop 2013; 144:860-71. 5. Villa MP, Rizzoli A, Rabasco J, Vitelli O, Pietropaoli N, Cecili M, et al. Rapid maxillary expansion outcomes in treatment of obstructive sleep apnea in children. Sleep Med 2015;16:709-16. 6. Taddei M, Alkhamis N, Tagariello T, D'Alessandro G, Mariucci EM, Piana G. Effects of rapid maxillary expansion and mandibular advancement on upper airways in Marfan's syndrome children: a home sleep study and cephalometric evaluation. Sleep Breath 2015;19:1213-20. 7. Pereira-Filho VA, Monnazzi MS, Gabrielli MA, Spin-Neto R, Watanabe ER, Gimenez CM, et al. Volumetric upper airway assessment in patients with transverse maxillary deficiency after surgically assisted rapid maxillary expansion. Int J Oral Maxi llofac Surg 2014;43:581-6. 8. Jaipal PR, Rachala MR, Rajan R, Jhawar DK, Ankush B. Management of adult transverse malocclusion with surgically assisted rapid palatal expansion. J Clin Diagn Res 2016y;10:ZJ10-2. 9. Vinha PP, Faria AC, Xavier SP, Christino M, de Mello-. www.e-kjo.org. https://doi.org/10.4041/kjod.2017.47.6.353. Filho FV. Enlargement of the pharynx resulting from surgically assisted rapid maxillary expansion. J Oral Maxillofac Surg 2016;74:369-79. 10. Park JJ, Park YC, Lee KJ, Cha JY, Tahk JH, Choi YJ. Skeletal and dentoalveolar changes after miniscrewassisted rapid palatal expansion in young adults: A cone-beam computed tomography study. Korean J Orthod 2017;47:77-86. 11. Wilmes B, Nienkemper M, Drescher D. Application and effectiveness of a mini-implant- and toothborne rapid palatal expansion device: the hybrid hyrax. World J Orthod 2010;11:323-30. 12. Choi SH, Shi KK, Cha JY, Park YC, Lee KJ. Non surgical miniscrew-assisted rapid maxillary expansion results in acceptable stability in young adults. Angle Orthod 2016;86:713-20. 13. Suzuki H, Moon W, Previdente LH, Suzuki SS, Garcez AS, Consolaro A. Miniscrew-assisted rapid palatal expander (MARPE): the quest for pure orthopedic movement. Dental Press J Orthod 2016;21:17-23. 14. Kabalan O, Gordon J, Heo G, Lagravère MO. Nasal airway changes in bone-borne and tooth-borne rapid maxillary expansion treatments. Int Orthod 2015;13:1-15. 15. Park JJ, Park YC, Lee KJ, Cha JY, Tahk JH, Choi YJ. Skeletal and dentoalveolar changes after miniscrewassisted rapid palatal expansion in young adults: a cone-beam computed tomography study. Korean J Orthod 2017;47:77-86. 16. Mylavarapu G, Mihaescu M, Fuchs L, Papatziamos G, Gutmark E. Planning human upper airway surgery using computational fluid dynamics. J Biomech 2013;46:1979-86. 17. Zhao M, Barber T, Cistulli PA, Sutherland K, Rosengarten G. Simulation of upper airway occlu sion without and with mandibular advancement in obstructive sleep apnea using fluid-structure inte raction. J Biomech 2013;46:2586-92. 18. Pirnar J, Dolenc-Grošelj L, Fajdiga I, Žun I. Compu tational fluid-structure interaction simulation of airflow in the human upper airway. J Biomech 2015;48:3685-91. 19. Shah DH, Kim KB, McQuilling MW, Movahed R, Shah AH, Kim YI. Computational fluid dynamics for the assessment of upper airway changes in skeletal Class III patients treated with mandibular setback surgery. Angle Orthod 2016;86:976-82. 20. Liu SY, Huon LK, Iwasaki T, Yoon A, Riley R, Powell N, et al. Efficacy of maxillomandibular advancement examined with drug-induced sleep endoscopy and computational fluid dynamics airflow modeling. Otolaryngol Head Neck Surg 2016;154:189-95. 21. Cheng GC, Koomullil RP, Ito Y, Shih AM, Sittita vornwong S, Waite PD. Assessment of surgical. 363.
(12) Hur et al • 3D-FSI analysis for effect of MARPE on airflow. effects on patients with obstructive sleep apnea syndrome using computational fluid dynamics simu lations. Math Comput Simul 2014;106:44-59. 22. Iwasaki T, Saitoh I, Takemoto Y, Inada E, Kanomi R, Hayasaki H, et al. Improvement of nasal airway ventilation after rapid maxillary expansion evaluated with computational fluid dynamics. Am J Orthod Dentofacial Orthop 2012;141:269-78. 23. Cisonni J, Lucey AD, King AJ, Islam SM, Lewis R, Goonewardene MS. Numerical simulation of pharyngeal airflow applied to obstructive sleep apnea: effect of the nasal cavity in anatomically accurate airway models. Med Biol Eng Comput 2015;53:1129-39. 24. Gurani SF, Di Carlo G, Cattaneo PM, Thorn JJ, Pinholt EM. Effect of head and tongue posture on the pharyngeal airway dimensions and morphology. 364. in three-dimensional imaging: a systematic review. J Oral Maxillofac Res 2016;7:e1. 25. Cheng S, Gandevia SC, Green M, Sinkus R, Bilston LE. Viscoelastic properties of the tongue and soft palate using MR elastography. J Biomech 2011; 44:450-4. 26. Iwasaki T, Saitoh I, Takemoto Y, Inada E, Kakuno E, Kanomi R, et al. Tongue posture improvement and pharyngeal airway enlargement as secondary effects of rapid maxillary expansion: a cone-beam computed tomography study. Am J Orthod Den tofacial Orthop 2013;143:235-45. 27. Neeley WW 2nd, Edgin WA, Gonzales DA. A review of the effects of expansion of the nasal base on nasal airflow and resistance. J Oral Maxillofac Surg 2007;65:1174-9.. https://doi.org/10.4041/kjod.2017.47.6.353. www.e-kjo.org.
(13)
수치
+6
관련 문서
[r]
따라서, 본 논문에서는 현장에 설치되어 운용중인 ESS의 성능과 안전성을 정확하게 평가하기 위해, 전력계통 상용해석 프로그램인 PSCAD/EMTDC를
기존의 스펙트럼을 이용한 극치분석을 통해 음악, 음 성을 구분하는 경우 퓨리에 변환 등을 이용해 특성치를 도출한 정보를 이용해 구분을 한다. 반면 심층 신경망은
박막을 증착하는 경우에는 원자들 간의 상호작용 에너 지에 따라 Volmer-Weber 성장모드(3D island growth), Frank-van der Merwe 성장모드(layer-by-layer
총콜레스테롤은 cholesterol reagent(Bayer, Whippany, NJ, USA)를 사용하였으며, 중성지방은 triglycerides reagent(Bayer, USA), HDL은 direct HDL
1 John Owen, Justification by Faith Alone, in The Works of John Owen, ed. John Bolt, trans. Scott Clark, "Do This and Live: Christ's Active Obedience as the
그림에서 왼쪽은 현재의 상태를 표현한 것으로 물 -에너지-식량 연관관계가 명확하게 분석되지 않아 (Unknown and unbalanced) 가용 수자원으로부터 생산을 위한 물로
Key Words: Carbon tax, labor migration, tax regime, welfare effect, fossil fuel demand, computable general equilibrium model, double dividend hypothesis..
