Fetal cardiac function by mitral and tricuspid annular plane systolic excursion using spatio-temporal image correlation M‐mode and left cardiac output in fetuses of pregestational diabetic mothers
Nathalie Jeanne Magioli Bravo-Valenzuela, PhD
1, Alberto Borges Peixoto, PhD
2,3, Rosiane Mattar, PhD
4, Edward Araujo Júnior, PhD
41Pediatric Cardiology Service, Department of Pediatrics, Federal University of Rio de Janeiro (UFRJ), Rio de Janeiro-RJ; 2Gynecology and Obstetrics Service, Mario Palmério University Hospital – University of Uberaba (UNIUBE), Uberaba-MG, 3Department of Obstetrics and Gynecology, Federal University of Triângulo Mineiro (UFTM), Uberaba-MG, 4Department of Obstetrics, Paulista School of Medicine - Federal University of São Paulo (EPM- UNIFESP), São Paulo-SP, Brazil
Objective
To assess the mitral and tricuspid annular plane systolic excursions (MAPSE and TAPSE, respectively) and cardiac output (CO) in fetuses of pregnant women with pregestational diabetes mellitus (DM) using spatio-temporal image correlation M-mode (STIC-M) and virtual organ computer-aided analysis (VOCAL).
Methods
This study was prospective and cross-sectional. It included 45 fetuses each from mothers with pregestational DM and healthy mothers, with gestation ages ranging from 20 to 36.6 weeks. The fetal cardiac volumes were obtained and analyzed by STIC and VOCAL methods. MAPSE and TAPSE were measured by STIC-M in the apical or basal four- chamber view. The values of the right (RV) and left ventricular (LV) CO were calculated by STIC and VOCAL.
Results
The median values of TAPSE were 6.1 and 6.2 mm in the diabetic and control groups (P<0.001), respectively. The median values of MAPSE were 4.6 mm in the fetuses of mothers with diabetes and 4.8 mm in fetuses of healthy mothers.
The fetal LV CO (60.4 L/min vs. 71.1 L/min; P=0.033, respectively) and RV CO (65.2 vs. 70.1 L/min; P=0.026, respectively) were lower in the pregestational DM group than in the control group. A significant effect of pregestational DM was observed in all functional parameters after adjusting, with fetal heart rate as covariant. There was moderate significant positive correlation between MAPSE and LV CO (r=0.53; P=0.0001) and between TAPSE and RV CO (r=0.46; P=0.0001).
Conclusion
Significant difference in functional parameters (TAPSE, MAPSE and LV CO) obtained by STIC and VOCAL were observed in the fetuses of the pregestational DM group compared to those of the control group.
Keywords: Fetal heart; Diabetes mellitus; Systolic heart failure; Four-dimensional echocardiography; Cardiac output
Received: 2020.09.11. Revised: 2020.12.06. Accepted: 2020.12.09.
Corresponding author: Edward Araujo Júnior, PhD
Department of Obstetrics, Paulista School of Medicine - Federal University of São Paulo (EPM-UNIFESP), Rua Belchior de Azevedo, 156 apto. 111 Torre Vitoria, São Paulo-SP, CEP 05089-030, Brazil
E-mail: [email protected], https://orcid.org/0000-0002-6145-2532
Edward Araujo Júnior has been an Editorial Board of Obstetrics & Gynecology Science; however, he was not involved in the peer reviewer selection, evaluation, or decision process of this article. Otherwise, no other potential conflicts of interest relevant to this article was reported.
Articles published in Obstet Gynecol Sci are open-access, distributed under the terms of the Creative Commons Attribution Non-Commercial License (http://creativecommons.org/
licenses/by-nc/3.0/) which permits unrestricted non-commercial use, distribution, and reproduction in any medium, provided the original work is properly cited.
Copyright © 2021 Korean Society of Obstetrics and Gynecology https://doi.org/10.5468/ogs.20274
eISSN 2287-8580
Introduction
Classically, gestational diabetes mellitus (DM) is the main cause of cardiac hypertrophy in fetuses. Pregestational DM affects structural and functional cardiogenesis, especially when the maternal blood glucose is uncontrolled [1-4]. Stud- ies have demonstrated that fetuses of diabetic mothers may present signs of cardiac dysfunction even in the absence of septal hypertrophy [5,6]. It is, therefore, important to assess the functional parameters of ultrasound/echocardiography to detect subclinical cardiac dysfunction in this population [7,8].
Traditionally, the global cardiac systolic function can be as- sessed by shortening fraction (SF) using two-dimensional (2D) ultrasound or by ejection fraction (EF) using three- (3D) and four- (4D) dimensional ultrasound with spatio-temporal im- age correlation (STIC) and virtual organ computer-aided anal- ysis (VOCAL) methods [9,10]. SF is applied to evaluate the global radial contractility by measuring the reduction of the ventricular diameter of end-diastole to end-systole [11,12].
Using advanced techniques such as 3D ultrasound, the EF reflects the percentage of blood ejected by the ventricles in each cardiac cycle and can be used to evaluate the longitudi- nal myocardial function with good reproducibility [10,13,14].
The longitudinal cardiac contractility can be assessed by measuring the maximum mitral and tricuspid annular plane systolic excursions (MAPSE and TAPSE, respectively). These parameters can be affected in the early stages of cardiac dys- function and can be obtained by means of ultrasound using conventional anatomical M-mode tracings and by STIC M- mode (STIC-M) [15]. Studies on fetal TAPSE and MAPSE have demonstrated the applicability of these parameters on risk factors for fetal heart failure, such as fetal growth restriction and maternal DM [16-18].
The aim of this study was to compare the values of fetal MAPSE, TAPSE, and cardiac output (CO) obtained by STIC-M and VOCAL in fetuses from pregnant women with DM and controls.
Materials and methods
This study was prospective and cross-sectional, performed to evaluate fetal MAPSE, TAPSE, and CO in fetuses from diabetic mothers compared with those in fetuses from low- risk pregnant women between 20 and 36.6 weeks of ges-
tation. From November 2016 to November 2018, all data underwent routine ultrasound evaluation and fetal echocar- diogram at the same time at the Fetal Cardiology Sector of the Federal University of São Paulo (UNIFESP).
The DM and control groups included fetuses of pregnant women with pregestational DM types 1, 2, or maturity- onset diabetes of the young and those of healthy mothers, respectively. The inclusion criteria were as follows: singleton pregnancies with gestational age (GA) between 20 and 36.6 weeks determined by the last menstrual period and confirmed by first trimester ultrasound. The exclusion criteria were as follows: fetuses whose mothers had other comor- bidities except pregestational DM; estimated fetal weight
<10th percentile for GA; smokers or drug/ alcohol users;
fetuses with structural cardiac and extracardiac anomalies at ultrasound examination; and fetal cardiac volumes with inad- equate quality images due to fetal movements, presence of acoustic shadows of fetal ribs or spine, and maternal breathing.
Pregnant women were assessed once. The obstetrical ultrasound and fetal echocardiogram examinations were performed on the same day using a Voluson E6 apparatus (General Electric Healthcare, Zipf, Austria) equipped with 3.0–5.0 MHz convex volumetric probe. Examinations were performed by two examiners (NJMBV and ABP) with experi- ence in both 3D ultrasound and fetal echocardiography.
First, evaluation of the fetal morphology and biometry were assessed by 2D ultrasound. Fetal cardiac volumes were ac- quired in the four-chamber view according to Gonçalves et al. [19]. The angle of the scan acquisition was standardized, ranging from 20º to 25º and from 35º to 40º in the second and third trimesters, respectively, with a speed time ranging from 7.5 to 15 seconds. One to three fetal cardiac volumes were obtained from each pregnant woman and stored in DICOM. The off-line analysis was performed by the principal investigator (NJMBV) using 4D view software version 10.0 (General Electric Medical System, Zipf, Austria). The axial plane (A) of the multiplanar mode was selected, and the fetal heart was rotated around the ‘z’ axis for the fetal spine to be at a 6 o’clock position. Image adjustments with sepia or candle colors and cineloop mode were reduced to 6%.
To measure fetal MAPSE and TAPSE, the STIC-M key was activated and the cursor was placed at the atrioventricular junction, marked by mitral and tricuspid valves, respectively.
The maximum amplitude of motion was obtained as per
the extent of displacement between end-systole and end-
diastole (measured in mm) (Fig. 1). The maximal and minimal ventricular volumes were measured at the end-diastole (just after closing of the atrioventricular valves) and end-systole (before opening of the atrioventricular valves), respectively.
Subsequently, the caliper was positioned in the atrioventricu- lar valve and in the ventricular apical region (Fig. 2). Then, the VOCAL key was activated, and this software provided the reconstruction of the 3D image of each ventricle after 6 sequential manual planes (30
0). The EF and CO for left and right ventricles were calculated using the following formulas:
EF=end diastolic ventricular volume−end systolic ventricular volume/end diastolic ventricular volume and CO=end diastol- ic ventricular volume−end systolic ventricular volume×heart rate.
The following clinical variables were also collected to ana- lyze the characteristics of the study population: maternal age, number of previous pregnancies, parity, number of miscarriages, GA at the time of ultrasound examination, es- timated fetal weight, fetal heart rate (FHR), and last serum glycated hemoglobin levels.
Data were transferred to an Excel 2010 spreadsheet (Micro- soft Corp., Redmond, WA, USA) and analyzed using PASW version 20.0 (SPSS Inc., Chicago, IL, USA) and GraphPad (ver- sion 7.0, GraphPad Software, San Diego, CA, USA). Continu- ous variables were expressed as the medians (minimum and maximum ranges). Categorical variables were expressed as percentages. The Mann-Whitney U-test was used to compare the two groups, with a critical alpha of 0.05. Spearman’s correlation test (r) was used to determine the correlation between continuous variables. Linear regression was used to analyze the influence of the FHR on fetal cardiac function parameters, the influence of MAPSE on the left ventricle (LV) CO, and the influence of TAPSE on the right ventricle (RV)
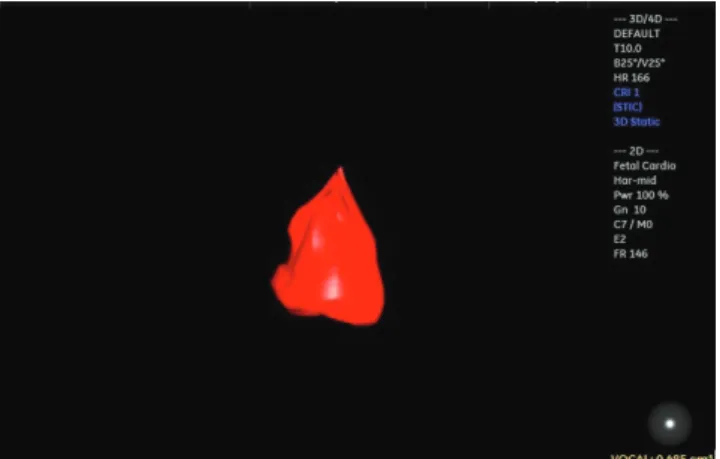
Fig. 1. Measurement of the fetal left ventricle (LV) volume usingspatio-temporal image correlation and virtual organ computer- aided analysis (VOCAL) methods in a fetus from pregestational diabetes mellitus at 22 weeks and 5 days of gestation (LV diastolic volume=0.48 cm3 and heart rate [HR]=166 bpm). The LV cardiac output (LV CO) and LV ejection fraction (LVEF) were calculated from the measurements of the ventricular volumes according to the following formulas: LV CO=(LVDv−LVSv)×HR and LVEF (LVDv−
LVSv)/LVDv. The calipers were positioned on the internal border of the mitral valve and on the ventricular endocardial border to perform the manual delimitation of the internal left ventricular volume. After 6 sequential planes, the VOCAL software provided the chamber volume and the reconstructed 3D image. LVDv, left diastolic volume; LVSv, left systolic volume.
Fig. 2. In the apical four-chamber view of the fetal heart, the spatio-temporal image correlation in M-mode image is positioned at the junction between the free ventricular wall and the atrioventricular valve for the calculation of mitral annular plane systolic excursion (MAPSE) (A) and tricuspid annular plane systolic excursion (TAPSE) (B) annular plane systolic excursions. MAPSE=5.4 mm; TAPSE=5.4 mm.
A B
CO. General linear model with FHR as covariant was used to evaluate the influence of pregestational DM on fetal cardiac parameters.
Results
We evaluated 104 pregnant women. However, 13 fetuses were excluded because of the poor quality of the fetal car- diac volume acquisition, 1 case because the estimated fetal weight was <10th percentile for GA, and 2 cases because of fetal structural anomalies. Consequently, we evaluated a total of 90 fetal cardiac volumes, which were divided in two groups (45 fetuses each from mothers with pregestational DM and healthy mothers).
There was a significant effect of pregestational diabetes on maternal age (P=0.004), number of previous pregnan- cies (P<0.01), parity (P=0.005), and number of miscarriages (P=0.001). Healthy pregnant women had higher maternal age (33.0 vs. 27.0 years, P=0.004) and lower number of
previous pregnancies (1.0 vs. 2.0, P<0.001) than pregnant women with pregestational DM (Table 1).
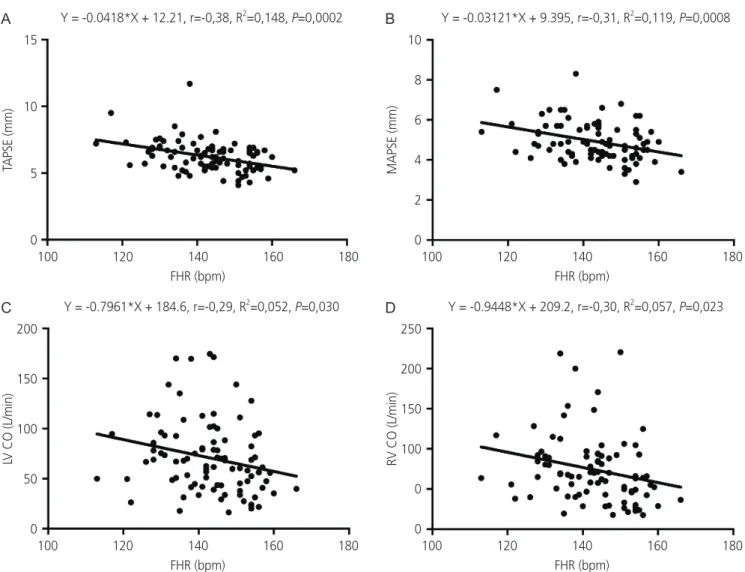
Considering all cases included in the study, there was a weak significant negative correlation between FHR and the following: TAPSE (r=−0.37, P=0.0003), MAPSE (r=−0.31,
P=0.0029), LV CO (r=−0.29, P=0.0049), and RV CO (r=−0.30, P=0.0035) (Table 2). The elevation of 1 beat per minute (bpm)in the FHR was responsible for reducing TAPSE by 0.04 mm, MAPSE 0.03 mm, LV CO 0.79 L/min, and RV CO 0.94 L/min.
According to the coefficient of determination (R
2), 15%, 12%, 5%, and 6% of the variations in TAPSE, MAPSE, LV CO, and RV CO, respectively, were linearly related to FHR, with the remaining variations resulting from other factors not considered in the model (Table 2 and Fig. 3). Considering all cases of mothers with pregestational DM, whose glycated hemoglobin (HB) (%) measurements had been performed, there was a weak significant negative correlation with TAPSE (r=−0.37, P=0.019) and MAPSE (r=−0.38, P=0.015). There was not significant correlation between glycated HB (%) and LV CO (r=0.04, P=0.783) and RV CO (r=0.03, P=0.819) (Table 3).
Table 1. Clinical characteristics of the studied population
Characteristics Control (n=45) Pregestational diabetes mellitus (n=45)
Median Min Max Median Min Max P-valuea)
Age (yr) 33.0 19.0 43.0 27.0 17.0 43.0 0.004
Previous pregnancy number 1.0 1.0 2.0 2.0 1.0 6.0 <0.001
Parity 0.0 0.0 3.0 0.0 0.0 3.0 0.005
Previous miscarriage number 0.0 0.0 1.0 0.0 0.0 5.0 0.001
GA (wk) 27.3 20.0 33.3 27.5 20.2 34.6 0.831
EFW (g) 978.0 322.0 2,137.0 1,152.0 333.0 2,689.0 0.407
FHR (bpm) 144.0 121.0 160.0 144.0 113.0 166.0 0.577
Glycate HB (%) 7.6 4.8 15.5
Min, minimum; Max, maximum; GA, gestational age; EFW, estimated fetal weight; FHR, fetal heart rate; HB, hemoglobin.
a)Mann-Whitney, P<0.05.
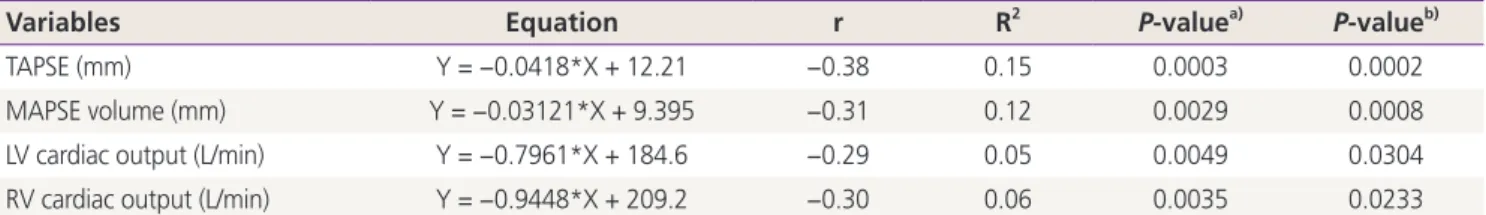
Table 2. Influence of fetal heart rate (bpm) on parameters for assessing fetal cardiac function
Variables Equation r R2 P-valuea) P-valueb)
TAPSE (mm) Y = −0.0418*X + 12.21 −0.38 0.15 0.0003 0.0002
MAPSE volume (mm) Y = −0.03121*X + 9.395 −0.31 0.12 0.0029 0.0008
LV cardiac output (L/min) Y = −0.7961*X + 184.6 −0.29 0.05 0.0049 0.0304
RV cardiac output (L/min) Y = −0.9448*X + 209.2 −0.30 0.06 0.0035 0.0233
TAPSE, tricuspid annular plane systolic excursion; MAPSE, mitral annular plane systolic excursion; LV, left ventricle; RV, right ventricle, Y, fetal cardiac function parameter; X, fetal heart rate (bpm); r, Spearman’s correlation coefficient; R2, coefficient of determination.
a)Spearman correlation test; b)Linear regression, P<0.05.
There was a significant effect of pregestational DM on TAPSE (P<0.001), MAPSE (P<0.001), LV CO (P=0.033), and RV CO (P=0.026) after adjusting, with FHR as covariant.
The median TAPSE (6.1 vs. 6.2 mm, P<0.001, respectively),
MAPSE (4.6 vs. 4.8 mm, P<0.001, respectively), LV CO (60.4 vs. 71.1 L/min, P=0.033, respectively), and RV CO (65.2 vs.
70.1 L/min, P=0.026, respectively) were lower in the preges- tational DM group than in the control group (Table 4).
Fig. 3. Scatter plot of the correlation between tricuspid annular plane systolic excursion (TAPSE) (A), mitral annular plane systolic excur- sion (MAPSE) (B), left ventricle cardiac output (LV CO) (C), right ventricle cardiac output (RV CO) (D), and fetal heart rate (FHR).
TAPSE (mm)LV CO (L/min) MAPSE (mm)RV CO (L/min)
15
10
5
0
200 150 100 50 0
10 8 6 4 2 0
250 200 150 100 0 0 Y = -0.0418*X + 12.21, r=-0,38, R2=0,148, P=0,0002
Y = -0.7961*X + 184.6, r=-0,29, R2=0,052, P=0,030
Y = -0.03121*X + 9.395, r=-0,31, R2=0,119, P=0,0008
Y = -0.9448*X + 209.2, r=-0,30, R2=0,057, P=0,023 100 120 140 160 180
FHR (bpm)
100 120 140 160 180 FHR (bpm)
100 120 140 160 180 FHR (bpm)
100 120 140 160 180 FHR (bpm)
A
C
B
D
Table 3. Influence of glycated hemoglobin on parameters for assessing fetal cardiac function
Variables Equation r R2 P-valuea) P-valueb)
TAPSE (mm) Y = −0.09602*X + 7.123 −0.37 0.053 0.019 0.250
MAPSE volume (mm) Y = −0.0818*X + 5.596 −0.38 0.043 0.015 0.204
LV cardiac output (L/min) Y = 1.402*X + 74.97 0.04 0.001 0.783 0.836
RV cardiac output (L/min) Y = 0.4514*X + 69.56 0.03 0.000 0.819 0.863
TAPSE, tricuspid annular plane systolic excursion; MAPSE, mitral annular plane systolic excursion; LV, left ventricle; RV, right ventricle, Y, fetal cardiac function parameter; X, fetal heart rate (bpm); r, Spearman’s correlation coefficient; R2, coefficient of determination.
a)Spearman correlation test; b)Linear regression, P<0.05.
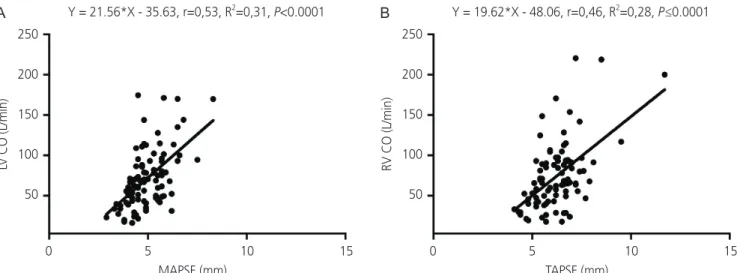
Considering all included cases, there was moderate signifi- cant positive correlation between MAPSE and LV CO (r=0.53,
P<0.0001) and TAPSE (r=0.46, P<0.0001) and RV CO (Table 5).The 1-mm increase in the excursion of LV annulus was re- sponsible for increasing the LV CO by 21.56 L/min and RV CO by 19.62 L/min. According to the R
2, 31% and 28% of the variations in LV CO and RV CO were linearly related to MAPSE and TAPSE, respectively, with the remaining variations
resulting from other factors not considered in the model (Table 5 and Fig. 4).
Discussion
TAPSE and MAPSE measurements can be obtained either by 2D ultrasound using anatomical M-mode tracings or by ad-
Table 5. Influence of tricuspid annular plane systolic excursion on RV cardiac output and influence of mitral annular plane systolic excur- sion on LV cardiac output
Variables Equation r R2 P-valuea) P-valueb)
LV cardiac output (L/min) Y = 21.56*X – 35.63 0.53 0.31 <0.0001 <0.0001
RV cardiac output (L/min) Y = 19.62*X – 48.06 0.46 0.28 <0.0001 <0.0001
RV, right ventricle; LV, left ventricle; r, Spearman’s correlation coefficient; R2, coefficient of determination; Y, LV or RV cardiac output (L/min); X, MAPSE or TAPSE (mm); MAPSE, mitral annular plane systolic excursion; TAPSE, tricuspid annular plane systolic excursion.
a)Spearman correlation test; b)Linear regression.
Fig. 4. Scatter plot of the correlation between mitral annular plane systolic excursion (MAPSE) and left ventricle cardiac output (LV CO) (A) and correlation between tricuspid annular plane systolic excursion (TAPSE) and right ventricle cardiac output (RV CO) (B).
LV CO (L/min)
250 200 150 100 50
Y = 21.56*X - 35.63, r=0,53, R2=0,31, P<0.0001
0 5 10 15
MAPSE (mm)
A
Y = 19.62*X - 48.06, r=0,46, R2=0,28, P≤0.00010 5 10 15
TAPSE (mm)
B
RV CO (L/min)
250 200 150 100 50
Table 4. Fetal cardiac functional parameters by spatio-temporal image correlation in M-mode and virtual organ computer-aided analysis Variables Control (n=45) Pregestational diabetes mellitus (n=45)
Median Min Max Median Min Max F n2 P-valuea) P-valueb)
TAPSE (mm) 6.2 4.1 8.5 6.1 4.3 11.7 7.7 0.2 0.640 <0.001
MAPSE (mm) 4.8 3.6 6.8 4.6 2.9 8.3 6.2 0.1 0.260 <0.001
LV CO (L/min) 71.1 16.3 170.1 60.4 17.7 174.5 2.8 0.1 0.111 0.033
RV CO (L/min) 70.1 17.8 220.5 65.2 17.6 200.1 3.2 0.1 0.247 0.026
Min, minimum; Max, maximum; F, F ratio; n2, Eta square; TAPSE, tricuspid annular plane systolic excursion; MAPSE, mitral annular plane sys- tolic excursion; LV CO, left ventricle cardiac output; RV CO, right ventricle cardiac output.
a)Mann-Whitney test; b)General linear model, P<0.05.