J Intell Inform Syst 2016 December: 22(4): 217~245 http://dx.doi.org/10.13088/jiis.2016.22.4.217
Reliability Analysis of VOC Data for Opinion Mining
Kim, Dongwon
Shipping Management,
Korea Maritime & Ocean University ([email protected])
Yu, Song Jin
Shipping Management,
Korea Maritime & Ocean University ([email protected])
․․․․․․․․․․․․․․․․․․․․․․․․․․․․․․․․․․․․․․․․․․․․․․․․․․․․․․․․․․․․․․․․․․․․․․․․․․․․․․․․․․․․․
The purpose of this study is to verify how 7 sentiment domains extracted through sentiment analysis from social media have an influence on business performance. It consists of three phases. In phase I, we constructed the sentiment lexicon after crawling 45,447 pieces of VOC (Voice of the Customer) on 26 auto companies from the car community and extracting the POS information and built a seven-sensitive domains. In phase II, in order to retain the reliability of experimental data, we examined auto-correlation analysis and PCA. In phase III, we investigated how 7 domains impact on the market share of three major (GM, FCA, and VOLKSWAGEN) auto companies by using linear regression analysis. The findings from the auto-correlation analysis proved auto-correlation and the sequence of the sentiments, and the results from PCA reported the 7 sentiments connected with positivity, negativity and neutrality. As a result of linear regression analysis on model 1, we indentified that the sentimental factors have a significant influence on the actual market share. In particular, not only posotive and negative sentiment domains, but neutral sentiment had significantly impacted on auto market share. As we apply the availability of data to the market, and take advantage of auto-correlation of the market-related information and the sentiment, the findings will be a huge contribution to other researches on sentiment analysis as well as actual business performances in various ways.
Key Words : Auto-correlation, PCA, Sentiment Analysis, Linear Regression Analysis
․․․․․․․․․․․․․․․․․․․․․․․․․․․․․․․․․․․․․․․․․․․․․․․․․․․․․․․․․․․․․․․․․․․․․․․․․․․․․․․․․․․․․
Received : August 17, 2016 Revised : October 18, 2016 Accepted : October 25, 2016 Publication Type : Regular Paper Corresponding Author : Yu, Song Jin
1. Introduction
In today’s challenging business world, companies want to differentiate themselves by providing a superior customer experience.
Nowadays, there is no doubt that the key to success lies in the ability to better understand and act upon customers’ requirements. Leading companies build competitive strategies based on
insights from VOC data. Voice of the customer (VOC) is a term that describes customers’
feedback about their experiences with products or services. The definition of VOC varies across authors. The definition of VOC originated with a paper in 1993 by Griffin and Hauser, who defined VOC as "a complete set of customer wants and needs; expressed in the customer’s own language;
organized the way the customer thinks about, uses
and interacts with the product and service; and prioritized by the customer in terms of both importance and performance". According to Gerald M. Katz (2001), the VOC was first used to improve product development, though eventually referencing "any type of market research with customers".
Normally, vehicle companies discover problems through vehicle tests, inspection procedures, or information gathering. They may, for instance, review warranty claims or dealership service records, or consult consolidated insurance industry data. We believe, however, there are a lot of useful and hidden vehicle quality data embedded in social media that are largely untapped into by organizations. Recently, automotive companies like Chrysler have begun to employ “Twitter teams” to reply to whining tweets; but, detecting “whispers of useful information in a howling hurricane of noise” is a huge challenge and better filters are needed to extract meaning from the “blizzard of buzz” (A. Woolridge, 2011).
As the advent of various e-community, such as social networks or websites, is actualized, the interaction among e-community users contributes to the transition and diffusion of emotions (B.
Kujawski et al, 2007). Customers regard the community as a resource to offer their opinions associated with products and services. Furthermore, it has been utilized as a medium that car companies can acquire customers' feedback. Thus, in this study, we empirically analyzed VOC sentiment from car e-community, constructed the sentiment lexicon and extracted 7 sentiment
domains by our own process.
This study consists of three phases. In phase I, we constructed the sentiment lexicon and 7 sentiment domains by analyzing sentiment of VOC on 26 auto companies. In phase II, in order to retain the reliability of sentiment VOC data for experiment, we examined using the auto-correlation analysis and PCA. We analyzed how correlated they are through the auto-correlation analysis and what predictable information is included in the emotion through the principal component analysis. Through this empirical study, we verified the reliability of sentimental data and would apply the data to the sustained study. In phase III, we investigated how 7 domains impact on the performance of organizations, which is market share of four major auto companies by using linear regression analysis.
2. VOC Analysis
2.1 Importance of VOC
The purpose of VOC management in each organization is to specifically understand customers by figuring out whether customers are satisfied with the products or services provided from the company or not. It has built the structure of VOC system in order to grasp the changing needs and expectations of them from market.
VOC provides;
․ a delicate understanding of the customer’s needs
․ a common, but useful language for the company carrying out
․ key input for the setting of appropriate specifications for the product and service
․ a practical medium for product and service innovation
VOC analysis makes organizations be able to develop products and services to continuously reflect the needs of customers that frequently change by utilizing the VOC data. That is, by integrating VOC data collected from various routes, companies collect the changing needs of the customers in accordance with situation or local, analyze them, convert them into information required for the development of products and services and provide the solutions.
As reviewing the precedent studies related to VOC, L. Venkata Subramaniam et. al. (2009) developed a system called BIVOC (Business Intelligence from Voice of Customer) where a significant portion of the VOC analysis and integation of VOC with structured information, but it has a limitation that it only dealt with the structured data. Although there were a study about how VOC with negative contents affect the interactions within an online brand community such as MyStarbucksIdea (Lee et al., 2014), it just focused on the negative sentiment. On the other hand, there is also a study that intend to induce efficient use of VOC system by utilizing the concept recognition of VOC systems, satisfaction, and the recognition of influence and analyzing the differences in recognition between the customers and employees (Choi et al., 2011). Takeuchi et al.
(2009) stressed out the necessity for business-oriented dialogue with our customers, beyond the marketing strategy, in order to improve the quality of products and services of the enterprises and the operational efficiency by using a text mining to analyze the telephone VOC data of the car rental help desk. it referred to the importance of the VOC.
However, the majority of the previous researches are dealing with the VOC importance and integrated system, even though we recognize that VOC has a significantly large impact on customer satisfaction and corporate performance.
Furthermore, a study of the contents of VOC data is even more sparse and lacking. That is why the actual VOC data have traits that it is difficult to be presented due to their attributes composed of complaints and protests. Lately, in addition, as internet and smart services are developing, although VOC warehouse a accumulate more VOC data, it is not easy to properly analyze and utilize because they consist of unstructured text data.
From this point of view, opinion mining, which is one field of text mining methods to analyze large amounts of VOC data, can be a useful alternative. Opinion Mining means a process of extracting, classifying, understanding and capitalizing the opinions that are exposed to the outside through a variety of contents such as online news and social media, and is carried out by utilizing a variety of techniques sentiment analysis (Liu, 2010). It is also easily able to be applied to determine the ranking to review data in order to enhance the search efficiency of
Domain Basic Sentimental Words
Sadness sadness, loneliness, unhappiness, depression
Shame shame, guilt, regret, embarrassment
Anger anger, irritation, disgust, rage
Fear fear, worry, anxiety, nervousness
Frustration frustration, resignation, powerlessness, despair
Delight delight, pleasure, joy, happiness
Satisfaction Satisfaction, gratification, fulfillment
<Table 1> Emotion Domain & Basic sentimental word customers' reviews for potential buyers in on-line
shopping mall (Yune et al, 2010), and evaluate a movie by analyzing positivity and negativity after summarizing the movie reviews (Zhuang, 2006).
2.2 Sentiment Analysis
Sentiment analysis (also known as opinion mining) refers to the use of natural language processing, text analysis and computational linguistics to identify and extract subjective information in source materials. A basic task in sentiment analysis is classifying the polarity of a given text at the document, sentence, or feature/aspect level―whether the expressed opinion in a document, a sentence or an entity feature/aspect is positive, negative, or neutral.
Advanced, "beyond polarity" sentiment classification looks, for instance, at emotional states such as "angry", "sad", and "happy".
"Sentiment analysis" or "Opinion Mining" is traditionally used to classify the positive or negative emotions composed of text comments and extract an object representing the writer's opinion (L. Zhuang et al, 2007 ; J. S. Lerner at al, 2000).
The study of sentiment analysis has been started from the late 1990s has been fixed in the increasingly important field of research since 2000s (M. Thelwall, 2011 ; S. Argamon, 1998 ; B.
Kessler ; E. Spertus, 1997 ; N. Li, 2010). Studies, which has been progressing until now, mainly has focused on the classification of positive or negative opinions such as movie and product purchase reviews (L. Zhuang, 2006 ; B. Pang.
2002 ; C. Whitelaw 2005). However, recent studies tend to regard feeling as precisely subdivided units overcoming a simple classification of it (J. Bollen ; M. Thelwall, 2011).
Thus, these classification methods play a crucial role in providing the research domain of sentiment analysis with deeper understandings and suggestions (T. Wilson, 2009 ; A. Esuli, 2006).
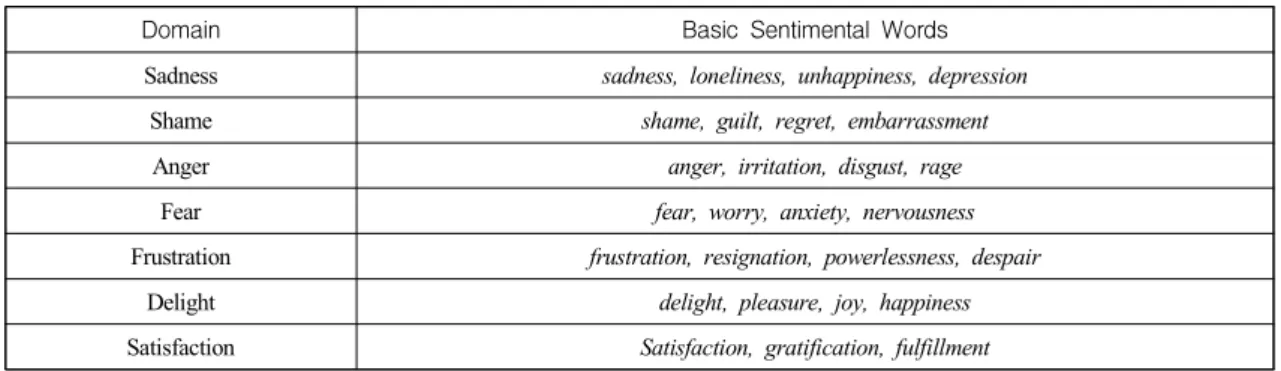
We classified emotions into 7 domains (Sadness, Shame, Anger, Fear, Frustration, Delight and Satisfaction) by using Sentiwordnet.
Table 1 shows negative and positive emotion domain and subdivided basic sentimental words, which utilize a standard for classification of emotion(E. Diener, 2006 ; B. Tronvoll, 2011).
Study Medium Domain Competitive intelligence perspective Coussement and van den Poel, 2008 Email Customer complaints Customer
Spangler and Kreulen, 2008 Email Customer complaints Customer
Romano et al., 2003 Product reviews Movie Customer
Duan, Gu, and Whinston, 2008 Product reviews Movie Product
Schumaker and Chen, 2009 News Stock Market
Tetlock et al., 2008 News Stock Market
Li and Wu, 2010 Blog Sports Market
Finch, 1999 News Power tools Product
<Table 2> Text Analysis Studies via Social Media
In the sentiment analysis literature, it is presumed that heavily negative and positive postings will be indicative of pros and cons of the product. However, whether this presumption is true for automotive sales has not been tested in prior research. There is some evidence that generic sentiment analysis fails when applied across domains. Loughran and McDonald (2011) found that sentiment-indicative words differ across domains: specifically, in the field of finance, sentiment indicators were different from sentiment marker words previously thought to be generally applicable to all fields. O'Leary (2011) found that generic positive and negative dictionaries had some limitations in describing negative behavior in the stock market, and suggested that domain specific terms be accounted for to improve the quality of the analysis. In the vehicle domain, therefore, generic sentiment polarity analysis may be insufficient. A thread poster may be more aggrieved by a malfunctioning air conditioner than
with a sticky accelerator pedal, yet the latter is almost certainly a more serious defect. For instance, to enable proper investigation, the defect must be associated with the troublesome component, so hazard analysis can be performed (P.H. Jesty et. al., 2000 ; D. Ward et.al, 2009).
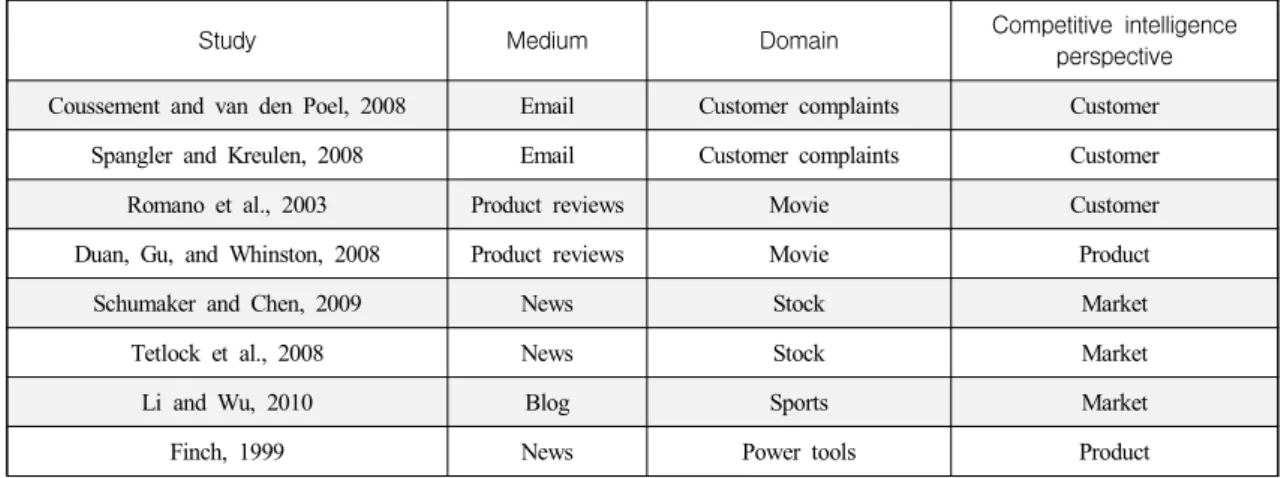
Table 2 summarizes previous research on the organizational use of text analysis of traditional internet and social media, for competitive intelligence, in various application domains. For each study, table 2 shows the medium, domain, and competitive intelligence perspective, for the study. We classified competitive intelligence perspectives using Vedder et al.,(1999). Table 2 highlights the research gap, which we aim to address in this paper: the application of text mining to vehicle market analysis in the on-line car community.
As the precedent studies on construction of sentiment lexicon, Turney P. D., and M. L.
Littman (2002) constructed semantic orientation
from a hundred-billion words using corpus. Lately, in addition to the research predicting the direction of the stock Index by utilizing a domain-specific sentiment dictionary (Yu et al., 2013), An and Kim (2015) built a Korean sentiment lexicon by using collective intelligence, and Jo and Choi (2015) established sentiment lexicon based on OAR(Opinion Antonym Rule) algorithm. Besides, the study using LP (Label Propagation) extract the sensibility dictionary through the proximity between the words. In particular, Song and Lee (2013) proposed a study, which verified that the accuracy of sentiment analysis had improved when using a specialized lexicon rather than a generic sentiment dictionary. Although this study is promoted based on the generic lexicon, we constructed the sentiment lexicon by extracting the terminologies related to vehicle in order to compensate the defect of generic lexicon.
3. Methology
3.1 Research Flow
In this study, we extract the key words of emotions in voice data that had been posted on car-related on-line community from 2013 to 2015, and intend to analyze the correlation between negative and positive keywords and contribution to market share. This study is performed following the research flowchart as figure 1. Schematic contents are as follows. We build the database, crawling customers' opinion information from the
car-related online community and identify the part of speech (POS) information about words in the customers' opinion by using a part-of-speech tagging function provided by TextAnalysisOnline.
We construct the negative and positive emotional vocabulary group; that is, sentiment lexicon. Based on the data, we measure the polarity. As we investigate the previous studies, regardless of the domestic or international, there are only a few empirical analysis about the correlation between the data on consumers' sentiment and the market on social networks because it is difficult to extract the key factors with sentiment and prediction associated with each industry. Therefore, we perform the empirical analysis on the 7 sentiment domains that have already been extracted via the previous research as a measurement tool. In case of literature research, while a few research analyzed the opinion such as customer complaints, prediction of stock index, and sales and image of the product, taking advantage of the data, in the present study, we grasped and analyzed how correlated they are through the correlation analysis and which predictable information is included in the 7 sentiment domains through the principal component analysis.
Specifically, at first, we grasped auto-correlation of 7 sentiment domains that contain sales information, and checked whether it contains information that can predict the future. At this time, the 7 domains which are the main variables are composed of a combination of words that contains the feeling of the car market. In other words, after collecting information from the car
<Figure 1> Research Flow
community, we removed the buzz data, such as unwanted spam and noise and classified 7 sentiment domains of the auto sales market (sadness, shame, anger, fear, frustration, delight and satisfaction). It is possible to forecast the actual market share, if they have the auto-correlation of sentiment, because it contains information of sale in the emotion itself.
Secondly, we checked which main factors 7 domains have by using PCA. We precisely analyzed the auto-correlation of each emotion and proposed a methodology to test the reliability of the information of the car community. In Phase III, based on the data, we built the two kinds of linear regression model and verified how the sentiments
such as positivity, negativity and neurality have an influence on the performance of organizations, which is auto market share in this paper.
3.2 The Subject of Analysis & Crawling Data
In this study, the subjects for analysis are consumers' opinions, which are extracted the VOC of companies from "CarGurus" web site (www.cargurus.com) related to brand new and used vehicles in the U.S. from 2013 to 2015. In this site, for the purpose of this present study, 45,447 pieces of customers' reviews on 26 car manufacturing companies had been collected including titles and status information. The
Company 2013 2014 2015 Total
GM 2303 2155 2203 6661
FCA 1624 1394 1666 4684
Ford 1145 1140 1484 3769
Honda 1912 1708 1835 5455
Volkswagen 964 690 656 2310
Others 7258 7546 7764 22568
Total 15206 14633 15608 45447
<Figure 2> User reviews
<Table 3> Customers' Reviews
opinions duplicated or written in other languages except for English were deleted from the sample data. Figure 2 is a example of user reviews and URL from the web site.
3.3 Extracting POS Information
It is possible that a word has a variety of meanings depending on POS (Part-of-Speech) in the text. For instance, as the word "good" when it
is used as an adjective and when used as a noun, the polarity of the respective positive or negative meaning is also altered. Therefore, it is necessary to extract the POS information in order to analyze the positive or negative polarity with respect to customers' feedbacks. In this study, we took advantage of POS tagging at "www.TextAnalysis Online.com" to extract the POS information of each word. TextAnalysis API (Application
<Figure 3> An Example of POS tagging
Programming Interface) provides customized Text Analysis or Text Mining Services like Word Tokenize, POS Tagging, Stemmer, Lemmatizer, Chunker, Parser, Key Phrase Extraction (Noun Phrase Extraction), Sentence Segmentation (Sentence Boundary Detection), Grammar Checker, Sentiment Analysis, Text Summarizer, Text Classifier and other Text Analysis Tasks. It stands on the giant shoulders of NLP Tools, such as NLTK, TextBlob, Pattern, MBSP and etc.
TextAnalysisOnline displays the extracted the POS information as a format of XML. Figure 3 shows an example of extracting a POS information from words extracted by using Antconc 3.4.1w from the opinions posted by actual customers.
S (Sentence) / NN (Noun) / W (Word) / VG (Verb Group) C represents an attribute of the part-of-speech classification. There is a 30 kind of the POS classification such as PRP (Personal Pronoun), JJ (Adjective), NNS (Noun Plural), VBN (Verb, Past, Participle). The POS information identified in this way from each customer's opinion was saved in the database.
Through this POS tagging, we could classify POS of words, and extract noun and adjective vocabulary presented NN and JJ in the midst of these words arranged.
3.4 Review Extracting POS Information
We, at first, established lexicons of negative and positive emotions based on customers' feedbacks.
By applying POS information extracted from VOC and extracting synonyms of words with WordNet, which offers the relation between words such as synonym and antonym, we expanded seed words.
As the next step, we collected the polarity of the expended seed words from SentiWordnet and computed the sentimental intensity of each word.
Thus, we could build the sentiment lexicon by selecting 4,815 negative and 2,021 positive sentiment words. Figure 4 shows how the process of the lexicon for negative and positive emotions was constructed. In this study, utilizing information related to synonyms, we expanded the seed words into lexicons as shown in table 4.
Domain Seed words Lexicon expanded Sadness sadness, loneliness, unhappiness,
depression
sad, grief, sorrowful, mournful, lonely, lonesome, lone, unhappy, depressed, blue, slump and etc.
Shame shame, guilt, regret, embarrassment humiliation, humiliated, ashamed, mortified, dishonorable, shameful, regretful and etc.
Anger anger, irritation, disgust, rage anger, fury, resentment, wrath, indignation, angry, angered, fretful, annoyance, irritating, and etc.
Fear fear, worry, anxiety, nervousness dread, dreadful, dreaded, panic, fright, affright, alarm, aversion, fearfulness, fearful, fearsome and etc.
Frustration frustration, resignation, powerlessness, despair
frustrated, frustrating, discouraged, disappointment, dejected, powerless, helpless and etc.
Delight delight, pleasure, joy, happiness pleased, pleasant, enjoyable, happy, ecstatic, enthusiastic, spirited, comfy, agile and etc.
Satisfaction satisfaction, gratification, fulfillment awesome, balanced, classy, sophisticated, stunning, sublime, refined, exquisite, impeccable and etc.
<Figure 4> Process of Lexicon for Negative & Positive Emotions
<Table 4> Expanded Lexicon of Negative& Positive Domain
Based on this sentiment lexicon, we expanded lexicon and classified negative and positive words into 7 sentiment domains; Sadness, Shame, Anger, Fear, Frustration, Delight, and Satisfaction. As we mentioned, the basic seed words including negative and positive emotions were extracted from the existing literature, but expanded the negative and positive sentiment words by applying to vehicle
related words in table 4.
Even though they are categorized into the same range of emotion, the sentimental polarity of each word is different from one another. For instance, although "irritating", " angry" and "furious" are classified into the same domain of Anger, respective sentimental polarity differs from one another. This aspect means that words can have
the intensity of a variety of emotions according to individual vocabulary, usage, context, POS, or even in the same POS. In short, a word can have multiple meanings. SentiWordNet offers the polarity information indicating the emotional intensity for each word depending on the POS and usage, and also provides an index information indicating the frequency of use (E. Diener et al., 1995). The index represents the rank in accordance with the frequency of use. In this study, we calculated the sentimental intensity more accurately and precisely taking into account the index information. For example, as the word "sad" used as an adjective is shown from SentiWordNet (Table 5), figure 5 shows classifying polarity of the word "sad" into three aspects based on the frequency of use.
Word POS Index Value Positivity Negativity
sad Adj.
1 0.125 0.75
2 0 0.25
3 0 1
<Table 5> Polarity Information of Word "Sad"
<Figure 5> Example of Polarity information from SentiWordNet
To begin with, we respectively calculated difference between positivity and negativity of each meaning, and then multiplied the reciprocal of the index values given to its meaning. The higher the index value becomes, the greater weight is assigned. Once for all, we normalized their total sums. That is, in the case of "sad", the negativity value was extracted using this example of formula (Jung, 2013).
{(0.75-0.125)*1+(-0.25)*(1/2)+(-1)*(1/3)}/{(1 + (1/2) + (1/3)}
Through text matching both the extracted negativity and positivity values and lexicon constructed by the process above, intensity of sentiment of each VOC are measured. Based on these procedure, we built the lexicon and the 7 sentiment domains. It is meaningful to construct the sentiment lexicon related to automative industry.
In this present study, we constructed the sentiment lexicon selecting 4,815 negative and 2,021 positive sentiment words. Based on this sentiment lexicon, we combined these extracted and classified negative and positive words with words related to the automobile industry, and analyzed a total of 45,447 pieces of customers' opinions of 26 car manufacturing companies had been crawled from Jan. 1. 2013 to Dec. 31. 2015.
In the middle of 45,447 threads in data set from 26 brands, we sellected three major organiztions (GM Group, FCA and VOLKSWAGEN). The threads were discussed 92 unique vehicle models about their products and sevices. The average
Variables Min. Max Aver. St. Dev
Sadness -0.7826 0.4521 0.000401 0.1115076
Shame -1.8064 1.1331 0.001240 0.1632425
Anger -0.7207 0.8998 0.001341 0.1423444
Fear -0.9557 1.1148 0.000892 0.1457385
Frustration -0.9897 0.6557 0.000902 0.1471391
Delight -0.9673 0.6099 -0.000531 0.1425756
Satisfaction -0.8895 1.3387 -0.000684 0.1916136
<Table 6> Basic Descriptive Statistics of 7 Sentiment Domains thread contained 23 sentences with a total 502
words (min 5 words; max 1,272 words). In the table 6, it demonstrates basic descriptive statistics on the amount of 1-month sentiment change during 3 years. The amount of 1-month sentiment change(Et) is measured according to this following formula (D.E. O'Leary, 2011).
Et = ln(St/St-1)
"ln" is natural logarithm. St is the frequency of this month sentiments and St-1 is the frequency of the previous month's sentiments. The reason why we use the amount of sentiment change as variable is that, basically, the distribution of sentiment shows a similar aspect (Jung and Nah, 2007). The similar distribution of emotion responds the varied change such as sales or market share. In addition, since the number of posting shows a large difference depending on product or brand, the rate of emotion, that is, the amount of sentiment change is appropriate for variable.
The average of Sadness, Shame, Anger, Fear, and Frustration, indicating the negativity of the
market, is having a positive value, while that of Delight and Satisfaction, presenting the positivity of it, has a negative value. We can ascertain that the domains of sentiment properly divided as the average of emotion of other propensity simultaneously have the opposite sign to each other.
4. Experiment & Analysis (Phase II & III)
4.1 Auto-correlation Analysis of Sentiment
In this study, we conducted the auto-correlation analysis to determine whether the sentiment of the auto sales market includes predictable information.
As dealing with time-series data, It is always likely that the continuous error terms are correlated to each other. In some particular time point, the error term at that time includes not only the impact of that time, but the influence transferred from the impact from the past. Because of these transferred influence, the impact at that time are correlated
Sadness Shame Anger Fear Frustration Delight Satisfaction Lag AC Q-stat.
AC Q-stat.
AC Q-stat.
AC Q-stat.
AC Q-stat.
AC Q-stat.
AC Q-stat.
value value value value value value value
1 -0.238 41.748 -0.212 33.226 -0.221 35.665 -0.123 11.765 -0.224 37.103 -0.182 24.174 -0.175 22.644 2 -0.127 53.697 -0.137 43.564 -0.143 50.925 -0.212 33.665 -0.147 52.769 -0.179 43.572 -0.161 41.456 3 -0.044 55.155 -0.054 49.433 -0.072 53.697 -0.084 39.736 -0.064 55.155 -0.039 47.515 -0.099 48.155 4 -0.046 56.732 -0.045 52.497 -0.066 57.732 -0.033 46.701 -0.077 56.732 0.004 61.732 -0.006 63.343 5 0.148 67.792 0.072 62.754 0.235 87.721 0.168 64.219 0.186 77.761 0.242 96.779 0.268 102.424 6 0.018 67.991 -0.013 67.098 -0.031 89.959 0.022 68.442 0.008 79.265 -0.081 107.271 0.023 104.931 7 -0.016 74.209 -0.006 72.272 -0.025 94.214 0.002 72.529 -0.046 81.233 -0.048 112.742 -0.021 124.331 8 -0.034 75.052 -0.039 75.452 -0.084 95.873 -0.054 78.108 -0.023 85.052 -0.024 115.156 -0.029 125.398 9 -0.038 75.113 -0.058 76.738 -0.011 95.298 -0.048 79.073 -0.061 87.511 -0.045 117.411 -0.041 125.882 10 -0.005 76.128 -0.075 77.309 -0.114 106.185 -0.017 79.643 -0.075 92.128 -0.062 117.612 -0.201 127.318 11 -0.005 76.147 -0.029 77.647 -0.142 108.429 0.001 88.292 -0.005 96.153 -0.012 123.761 -0.027 136.539 12 -0.068 79.566 -0.055 82.069 -0.032 109.786 -0.062 92.433 -0.048 99.426 -0.084 133.795 -0.071 139.245 13 -0.044 79.727 -0.022 83.732 -0.067 110.732 -0.041 99.749 -0.091 102.325 -0.047 137.977 -0.049 141.778 14 -0.046 79.929 -0.036 89.425 0.026 117.492 -0.006 102.11 -0.024 109.467 -0.001 139.232 -0.051 142.929 15 0.097 82.132 0.121 96.774 0.239 122.479 0.147 114.54 0.176 122.352 0.209 149.509 0.113 172.236 16 -0.002 82.821 0.003 97.672 -0.012 123.217 0.009 122.8 0.011 125.284 0.002 152.828 -0.102 178.821 17 -0.041 83.242 -0.071 103.002 -0.056 125.739 -0.052 124.4 -0.033 128.257 -0.013 158.322 -0.081 182.134 18 -0.029 83.544 -0.113 104.396 -0.042 133.692 -0.094 124.61 -0.039 128.954 -0.032 161.201 -0.089 183.418 19 -0.056 84.272 -0.042 107.465 -0.071 147.431 -0.049 128.43 -0.075 133.842 -0.055 164.423 -0.097 189.412 20 -0.102 88.798 -0.054 108.175 -0.111 168.524 -0.032 128.99 -0.009 138.751 -0.072 168.336 -0.102 192.067
<Table 7> The Result of Auto-correlation with the impact from the past and this situation
produces correlation the error terms. In this case, auto-correlation exists and auto-correlation of both positives and negative (negative) could exist. At first, we empirically analyzed whether the change of each emotion has the features of auto-correlation. If the auto-correlation is identified, it suggests that sentiment containing information about the auto sales market may actually have an influence on the market. Table 7 is presenting the result of analyzing the auto-correlation of 20 months in the midst of 36
months, the 20 months were randomly selected arranged in order of month as lags and it is a summary on the auto-correlation coefficient of 7 sentiment domains shown in the car community.
AC denotes an auto-correlation coefficient, and Q-Stat. means Ljung-box statistics. Value is the value of Ljung-box statistics can confirm accompanying P-value (Sig.). We omitted the p-value (<0.01) under Q-stat in the table 7 as it is respectively significant in the each sentiment domain (0.0000*). The Ljung-Box test (named for Greta M. Ljung and George E. P. Box) known as
the Ljung–Box Q test is a type of statistical test of whether any of a group of auto-correlations of a time series are different from zero. Instead of testing randomness at each distinct lag, it tests the
"overall" randomness based on a number of lags (G. M. Ljung, G. E. P. Box, 1978). In table 7, we can grasp from this results thar the sentiment data of VOC have a serial pattern. Although there are slight differences in respective sentiment domain, the present sentiment has a significant amount of AC (auto-correlation coefficient) on a cycle of 10 month. We also can recognize that the time difference exceeding the confidence limit(-0.05<ACF<0.05) exists in sentiment domain.
This aspect shows that the current sensibility can be used to predict the future and the relationship between the past values and the current is significant. In other words, it implies that 7 emotions on the automotive market are not meaningless values to be produced at random, but have features of information with the predictability and the period.
4.2 Principal Component Analysis of Sentiment
Principal component analysis (PCA) is a statistical procedure that uses an orthogonal transformation to convert a set of observations of possibly correlated variables into a set of values of linearly uncorrelated variables called principal components. The number of principal components is less than or equal to the number of original variables. This transformation is defined in such a
way that the first principal component has the largest possible variance (that is, accounts for as much of the variability in the data as possible), and each succeeding component in turn has the highest variance possible under the constraint that it is orthogonal to the preceding components. The resulting vectors are an uncorrelated orthogonal basis set. PCA is sensitive to the relative scaling of the original variables (Pearson, K, 1901). PCA is mostly used as a tool in exploratory data analysis and for making predictive models. PCA can be done by eigenvalue decomposition of a data covariance (or correlation) matrix or singular value decomposition of a data matrix, usually after mean centering (and normalizing or using Z-scores) the data matrix for each attribute (Abdi. H., &
Williams, L.J., 2010). PCA is performed to extract the component, which is representative of the variables. The purpose of this analysis is to extract some main factors to be able to account for most of the variance of the total of samples. As the method of component extraction, it is possible to standardize the value of more than Eigen-value 1, the sum of factor loading squared. However, in this study, we fixed the number of factors into 3 in advance in order to evaluate the sentiment on market by separating the three aspects; positivity, negativity and neutrality. As the factor rotation was conducted with Varimax 20times repeatedly to extract principal component vector, which is most commonly used in the orthogonal factor rotation system and maximizes the sum of the variances of the squared loadings (squared correlations between variables and factors).
Domain PC1 PC2 PC3
Sadness 0.672 0.294 0.223
Shame 0.197 0.742 0.049
Anger 0.781 0.382 0.012
Fear 0.645 0.227 0.307
Frustration 0.201 0.798 0.154
Delight 0.077 0.559 0.726
Satisfaction 0.059 0.329 0.851
<Table 8> Rotated Component matrix
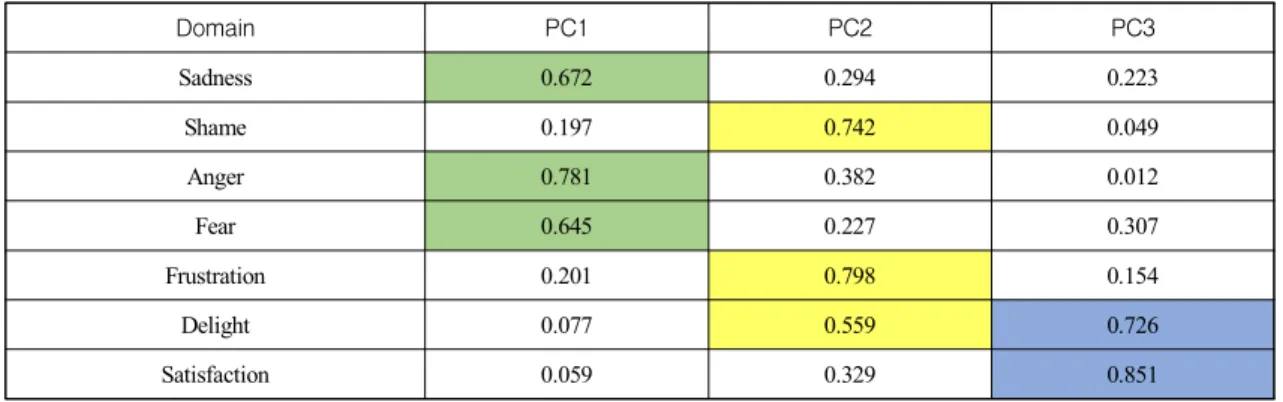
The rotated component matrix of 7 sentiment domains is shown in table 8. Sadness, Anger, and Fear has been divided into a principal component 1. Shame and Frustration has been divided into the principal component 2. Delight and Satisfaction is connected to the principal component 3. The principal component 1 represents the negativity on the auto market such as Sadness, Anger, and Fear.
The principal component 2 includes neutrality. The principal component 3 including Delight and Satisfaction mainly shows the positivty on the market. In this way, Being combined similar sentiment with the one component domain in accordance with the nature of the sentiment supports the results of auto-correlation analysis of sentiment. The market asymmetrically responds depending on customer's feedback, whether it is negative or positive. The negative and positive data on vehicles classified in this study will be able to have a different impact on the market performance. In other words, It suggests that the emotion plays a role in the information to predict the change of the car sales in the auto market
through the negativity and positivity on cars. In particular, Shame and Frustration are classified with the negative emotion in our own lexicon.
However, as a result of the PCA, Shame and Frustration have not been included in any group of the negative or the positive. Thus, it contains the neutral information or is regarded as the noise regardless of the plus (+) or minus (-) on the auto sales. In case of Delight, although it includes the neutrality and the positivity, as the main component is the positivity, it is included in the positive domain. Technically, it is difficult to extract exactly the information we want in the internet space with a lot of information through a combination of words. We reckon that it is necessary to analyze additionally the sentiment on the respective domain of Shame and Frustration mechanically classified.
Table 9 shows the total explained variance of the 3 principal components separated. The number of factors was fixed to 3 in advance and explanation power (% variance) shows how much of the total each factor describes. It means that the
Factor Initial Eigenvalues Extraction Sums of Squared
Loadings Rotation Sums of Squared
Loadings
Total % of Var. Cumul.% Total % of Var. Cumul.% Total % of Var. Cumul.%
1 4.712 52.344 52.344 4.712 52.344 52.344 2.729 29.861 29.861
2 0.921 10.249 62.593 0.921 10.249 62.593 2.209 24.613 54.474
3 0.827 9.431 72.024 0.827 9.431 72.024 1.661 17.550 72.024
<Table 9> Total Variance Explained
larger variance is, the more the factor has significantly an influence on. That is, a variable whose variance is large makes it easier to comprehensively grasp the data. In table 9, among the extracted 3 principal components, the first component explains 52.344% of the entire components. This means that the first component can be the greatest representative of overall sentiment. The second and third component respectively explains 10.249% and 9.431% of the total. According to the results, the negative factor has a significant influence on explaining the data.
4.3 Linear Regression Analysis Model
In the research model, we examined how VOC, which is consumer review on the products of the car manufacturing companies to target the online community, one of the social media channels, has an impact on the automotive market share. VOC on the products of automobile manufacturing companies is posted in a format of text. The independent variables of this study were converted to the quantified sentiment domains of texts by applying the opinion mining techniques. In the community for these products, we graphically
represent two models to explain the ups and downs of the market share on VOC digitizing sensibility by applying the opinion mining as follows.
In linear regression analysis model 1, we fixed five variables, the amounts of change the positive and the negative, as independent variables.
According to PCA, the sentiment domains inclining to the principal component of positivity are "Delight" and "Satisfaction" and those of negativity are "Sadness", "Anger", and "Fear". The amounts of the change of these two positive domains and three negative domains become independent variables (Figure 6).
<Figure 6> Linear Regression Analysis Model 1
In Model 2, we added the amounts of change of the neutral as independent variables in order to investigate what the neutrality of sentiment effects on the market share of the company. As a result of PCA, two domains, "Shame" and "Frustration", are independent variables including the neutrality.
In addition, even though the domain "Delight"
belongs to the positive domain, it simultaneously is inclined to both neutrality and positivity. It is necessary to focus on the result of analysis of
"Delight".
<Figure 7> Linear Regression Analysis Model 2
As shown in table 10, we inquired into the monthly vehicle market share from 2013 to 2015 through Automakers & ANDC, and collected 4 companies of 26 car manufacturing companies, which are presenting the meaningful changes in market share. We fixed each market share of each
company into dependent variables and their changes.
Month GM FCA VOLKSWAGEN
Jan-2013 0.187 0.113 0.041
Feb-2013 0.188 0.117 0.038
Mar-2013 0.169 0.118 0.037
Apr-2013 0.185 0.122 0.040
May-2013 0.175 0.115 0.038
Jun-2013 0.189 0.112 0.039
Jul-2013 0.178 0.107 0.040
Aug-2013 0.184 0.110 0.039
Sep-2013 0.165 0.126 0.042
Oct-2013 0.188 0.116 0.037
Nov-2013 0.170 0.114 0.039
Dec-2013 0.169 0.118 0.040
Jan-2014 0.170 0.126 0.036
Feb-2014 0.186 0.130 0.035
Mar-2014 0.167 0.126 0.036
Apr-2014 0.183 0.128 0.036
May-2014 0.177 0.121 0.033
Jun-2014 0.188 0.120 0.035
Jul-2014 0.178 0.117 0.035
Aug-2014 0.172 0.125 0.036
Sep-2014 0.179 0.136 0.036
Oct-2014 0.177 0.133 0.038
Nov-2014 0.173 0.131 0.041
Dec-2014 0.182 0.128 0.038
Jan-2015 0.176 0.126 0.034
Feb-2015 0.184 0.130 0.032
Mar-2015 0.162 0.128 0.037
Apr-2015 0.185 0.130 0.036
May-2015 0.179 0.124 0.035
Jun-2015 0.176 0.125 0.036
Jul-2015 0.180 0.118 0.036
Aug-2015 0.171 0.128 0.036
Sep-2015 0.174 0.134 0.033
Oct-2015 0.181 0.134 0.035
Nov-2015 0.173 0.131 0.041
Dec-2015 0.177 0.132 0.032
Source: Automakers & ANDC
<Table 10> Monthly Vehicle Market Share in the U.S.
Model R2 R2
Adjusted Durbin- Watson
ANOVA
Variables
Unstrdzd.
Coefficient Strdzd.
Coeffi.
T sig.
Collinearity Stat.
F P-v. B Std.
Error B VIF
1 0.363 0.357 1.560 3.416 0.015
(constant) 0.215 0.017 12.819 0.000
Sadness -0.211 0.087 -0.492 -2.425 0.022 1.937 Anger -0.004 0.010 -0.466 -2.430 0.067 1.120 Fear -0.078 0.132 -0.122 -0.593 0.258 1.985 Delight 0.181 0.324 0.159 2.557 0.058 1.820 Satisfaction 0.014 0.241 0.017 -0.059 0.353 2.667
<Table 11> The result of Model 1 (GM Group) 4.4 The Result of Linear Regression
Analysis
4.4.1 GM group
In GM's case, it had been the top auto manufacturing organization during this period (2013-2015) according to Automakers & ANDC.
Although, in March, 2013 (16.9%), September, 2013 (16.5%), March, 2014 (16.7%) and March, 2015 (16.2%), the radical fluctuations of market share were shown, it had maintained the top of market share in the US. The results of regression investigating the impact on the market share in accordance with the change of sentiment in VOC are stated as follows.
R2 means statistics, which describes how much the independent variables explain the dependent variable. In table 11, since R2 is 0.363, 5 sentiment domains can explain the market share approximately 36.3%. As adjusted R2 is 0.357, it shows similar level to R2. As Durbin-Watson (DW) value shows from 1 to 3, it is unproblematic to independency of residual. Since the DW value
is 1.56, we reason that the condition of the independency of residual is met. In ANOVA, investigating P-value (significant probability) on F-value, as P-value is 0.015, it is appropriate for the regression model 1. As the result of coefficients, generally, if VIF is less than 10, it is unproblematic to multi-collinearity. VIF represents the level between 1 and 3 in the table 11.
As the result of significancy of each variable, in domain Sadness, Anger, and Delight, P-value is shown to respectively 0.022, 0.067, and 0.058. It represents that Sadness, Anger, and Delight of 5 domains to be measured have an significant influence on the GM's performance. In addition, as we see the standardized coefficient, Sadness (-0.492) and Anger (-0.466) have negative (-) influence on market share and Delight has a positive (+) impact on the market share of GM, but it is a little meager level (0.159).
In table 12, since R2 is 0.403, 7 sentiment domains can explain the market share approximately 40.3%.
Model R2 R2
Adjusted Durbin- Watson
ANOVA
Variables
Unstrdzed.
Coefficient Strdzd.
Coeffi.
T sig.
Collinearity Stat.
F P B Std.
Error B VIF
2 0.403 0.354 1.640 2.701 0.029
(Constant) 0.222 0.021 10.433 0.000
Sadness -0.238 0.111 -0.555 -2.147 0.041 1.634
Anger 0.002 0.011 0.028 0.180 0.259 1.332
Fear -0.089 0.136 -0.139 -0.658 0.112 1.922 Delight -0.212 0.326 -0.187 -0.652 0.120 2.731 Satisfaction 0.070 0.249 0.061 0.279 0.282 2.667
Shame 0.142 0.189 0.183 0.749 0.106 2.723
Frustration -0.233 0.190 -0.204 -1.222 0.232 2.112
<Table 12> The result of Model 2 (GM Group)
As adjusted R2 is 0.354, it shows similar level to R2. Since the DW value is 1.64, we can evaluate that the condition of the independency of residual is met. In ANOVA, investigating P-value on F-value, as P-value is 0.029, it is suitable for the regression model 2. As the result of coefficients, generally, it is unproblematic to multi-collinearity as VIF represents below 10 in the table 12.
As the result of significancy of each variable, P-value of domain Sadness (0.041) has only an significant influence on the GM's performance. In addition, as we see the standardized coefficient, Sadness (-0.555) has an negative (-) influence on market share of GM. Domains Shame and Frustration, evaluated possessing neutrality by PCA, are not significant. In case of GM, we could reason that Sadness of sentiment domains on customer reviews had negatively impacted on the business performance on a significantly high level
(-0.492 in model 1 and -0.555 in model 2), compared to the market share from January, 2013 to December, 2015 (from max 18.9% to min 17.7%).
4.4.2 FCA
FCA's market share had inclined approximately 2% point from 11.3% to 13.2% during this period (2013-2015) according to Automakers & ANDC.
In the middle of 2013, it had dropped to 10.7%
(July). After that, however, it steadily had upturned and retained the range of 13% at the end of 2015. The results of regression investigating the impact on the market share in accordance with the change of sentiment in VOC are stated as follows.
In table 13, as R2 is 0.279, 5 sentiment domains can explain the market share approximately 27.9%.
DW value (1.911) meets the condition of the independency of residual. In ANOVA, P-value (0.038) measured on F-value is suitable for the
Model R2 R2
Adjusted Durbin- Watson
ANOVA
Variables
Unstrdzed.
Coefficient Strdzd.
Coeffi.
T sig.
Collinearity Stat.
F P-v. B Std.
Error B VIF
1 0.279 0.259 1.911 2.322 0.038
(constant) 0.124 0.022 5.675 0.000
Sadness -0.389 0.153 -0.255 -2.536 0.017 1.993
Anger 0.046 0.183 0.059 0.254 0.402 2.230
Fear 0.229 0.153 0.301 1.492 0.146 1.688
Delight 0.105 0.238 0.354 2.442 0.061 2.041 Satisfaction 0.022 0.268 0.328 3.483 0.034 1.646
<Table 13> The result of Model 1 (FCA)
Model R2 R2
Adjusted Durbin- Watson
ANOVA
Variables
Unstrdzed.
Coefficient Strdzd.
Coeffi.
T sig.
Collinearity Stat.
F P B Std.
Error B VIF
2 0.351 0.228 1.159 2.159 0.030
(Constant) 0.140 0.023 5.985 0.000
Sadness -0.363 0.152 -0.417 -2.392 0.024 2.015
Anger 0.036 0.180 0.046 0.202 0.342 2.233
Fear 0.387 0.176 -0.508 2.197 0.036 2.304
Delight 0.112 0.242 0.364 2.462 0.038 5.408 Satisfaction 0.011 0.274 0.013 0.939 0.169 5.022 Shame -0.030 0.196 -0.033 -1.155 0.178 1.897 Frustration -0.361 0.274 -0.320 -1.318 0.198 2.551
<Table 14> The result of Model 2 (FCA) regression model 1. In parameter estimates, VIF is
unproblematic to multi-collinearity.
As the result of significancy of each variable, P-value of domains Sadness (0.017), Delight (0.061) and Satisfaction (0.034) have significant influence on the FCA's market share. As seeing the standardized coefficient, Sadness (-0.225) has a negative (-) influence on market share of FCA (0.154) and Delight (0.354) and Satisfaction
(0.328) do positively (+).
According to analysis on Model 2 (FCA), 7 sentiment domains can explain the market share approximately 35.1% through. In ANOVA, P-value (0.03) measured on F-value is appropriate for the regression model 2. In parameter estimates, considering VIF, it is unproblematic to multi-collinearity.
As the result of significancy of each variable, it
Model R2 R2
Adjusted Durbin- Watson
ANOVA
Variables
Unstrdzed.
Coefficient Strdzd.
Coeffi.
t sig.
Collinearity Stat.
F P-v. B Std.
Error B VIF
1 0.330 0.309 1.541 3.735 0.043
(constant) 0.051 0.013 3.975 0.000
Sadness -0.003 0.035 -0.018 -0.099 0.222 1.065 Anger -0.110 0.200 -0.343 -2.551 0.059 2.250 Fear -0.109 0.061 -0.326 -1.797 0.082 1.107 Delight 0.018 0.092 0.053 0.191 0.250 2.557 Satisfaction 0.031 0.072 0.110 0.432 0.269 2.189
<Table 15> The result of Model 1 (VOLKSWAGEN) assumes a different aspect from the result of model
1. P-value of domains Sadness (0.024), Fear (0.036) and Delight (0.038) have significant influence on the FCA's market share. We are able to infer that some positive and negative factors of Shame and Frustration impact on other sentiment domains. As seen the standardized coefficient, Sadness (-0.417) and Fear (-0.508) have negative (-) influence on market share of FCA and Delight (0.364) does positively (+).
Compared to between the development of market share and the sentiment from 2013 to 2015, the market share had increased 2.1% point from 11.3% to 13.4%. In case of FCA, even though negativity and positivity had coexisted during the period, we are able to infer that the positive sentiment factors such as Delight and Satisfaction in VOC had impacted on the business performance of FCA.
4.4.3 VOLKSWAGEN
In VOLKSWAGEN's case, it had retained the
range of market share between about 3% and 4%
during this period (2013-2015) according to Automakers & ANDC. Except for the radical decrease (-0.009) of market share in December.
2019 (0.032), it shows steady rise and fall without dramatic fluctuation in spite of "Diesel gate", which is the event of exhaust fabrication. The results of regression investigating the impact on the market share in accordance with the change of sentiment in VOC are stated as follows.
In table 15, as R2 is 0.33, 5 sentiment domains can explain the market share approximately 33%.
DW value (1.541) meets the condition of the independency of residual. In ANOVA, P-value (0.043) measured on F-value is suitable for the regression model 1. In parameter estimates, VIF, below 10, is unproblematic to multi-collinearity.
As the result of significancy of each variable, P-value of domain Anger (0.059) has a significant influence on the performance of VOLKSWAGEN.
As observing the standardized coefficient, Anger (-0.343) has a negative (-) influence on market share of VOLKSWAGEN.