Received June 23, 2011, Revised February 7, 2012, Accepted for publication March 31, 2012
Corresponding author: Byung Cheol Park, Department of Dermatology, Medical College, Dankook University, 119 Dandae-ro, Dongnam-gu, Cheonan 330-714, Korea. Tel: 82-41-550-6485, Fax: 82-41-552-7541, E-mail: [email protected]
This is an Open Access article distributed under the terms of the Creative Commons Attribution Non-Commercial License (http://
creativecommons.org/licenses/by-nc/3.0) which permits unrestricted non-commercial use, distribution, and reproduction in any medium, provided the original work is properly cited.
ORIGINAL ARTICLE
Reliability on Intra-Laboratory and Inter-Laboratory Data of Hair Mineral Analysis Comparing with Blood Analysis
Sun Namkoong, Seung Phil Hong, Myung Hwa Kim, Byung Cheol Park
Department of Dermatology, Medical College, Dankook University, Cheonan, Korea
Background: Nowadays, although its clinical value remains controversial institutions utilize hair mineral analysis.
Arguments about the reliability of hair mineral analysis persist, and there have been evaluations of commercial laboratories performing hair mineral analysis. Objective:
The objective of this study was to assess the reliability of intra-laboratory and inter-laboratory data at three commer- cial laboratories conducting hair mineral analysis, compared to serum mineral analysis. Methods: Two divided hair samples taken from near the scalp were submitted for analysis at the same time, to all laboratories, from one healthy volunteer. Each laboratory sent a report consisting of quantitative results and their interpretation of health impli- cations. Differences among intra-laboratory and inter- laboratory data were analyzed using SPSS version 12.0 (SPSS Inc., USA). Results: All the laboratories used identical methods for quantitative analysis, and they generated consistent numerical results according to Friedman analysis of variance. However, the normal reference ranges of each laboratory varied. As such, each laboratory interpreted the patient's health differently. On intra-laboratory data, Wilcoxon analysis suggested they generated relatively coherent data, but laboratory B could not in one element, so its reliability was doubtful. In comparison with the blood test,
laboratory C generated identical results, but not laboratory A and B. Conclusion: Hair mineral analysis has its limitations, considering the reliability of inter and intra laboratory analysis comparing with blood analysis. As such, clinicians should be cautious when applying hair mineral analysis as an ancillary tool. Each laboratory included in this study requires continuous refinement from now on for inducing stan- dardized normal reference levels. (Ann Dermatol 25(1) 67∼
72, 2013) -Keywords-
Blood minerals, Hair minerals, Minerals, Scalp hair
INTRODUCTION
Scalp hair has been widely accepted for the evaluation of toxic element exposure and has been performed by clinical laboratories since it was first used to assess systemic levels of the elements in 19291. Researchers have found correlations between essential elements and diseases, metabolic disorders, environmental exposures, and nutritional status2-7.
However, according to several studies that assessed the reliability of commercial laboratories performing hair mineral analysis, it has been suggested that using hair to measure essential element is meaningless8-13.
The usefulness of hair mineral analysis remains contro- versial. Nevertheless, much technical progress has been made in the laboratory field in the last 10 years. The aim of this study was to evaluate the performance of current commercial laboratories performing hair mineral analysis in terms of intra-laboratory and inter-laboratory reliability, compared to the analysis of serum minerals.
Table 1. Characteristics of the selected laboratories
Characteristic Laboratory A Laboratory V Laboratory C
Analytic instrumentation MS MS MS
Hair sample weight required for analysis (mg) 60 60 80
Numbers of analyzed elements 30 26 38
Toxic elements 10 10 8
Nutrients 20 16 30
MS: mass spectrometry.
MATERIALS AND METHODS
Enrolled laboratories
At the time of this study, there were three commercial institutions conducting hair mineral analysis in Korea.
Two of them are based on Korea, and one is a branch of a large laboratory headquartered in the USA, which receives samples from Korea for analysis. All three laboratories were included in this study.
Donor selection
Hair was donated by a 23 year-old healthy, black-haired, Asian man. He had no medical or drug history. Routine blood tests and serum levels of copper, zinc, iron and magnesium were within the normal limits. Electro- cardiogram (EKG) and chest radiograph were normal. This study was approved by the Institutional Review Board of the Dankook University Hospital, and the hair donor provided informed consent prior to participation.
Methods of hair analysis
Hair was cut adjacent to the scalp from several areas of the parieto-occipital regions, using clean stainless steel scissors. Hairs measuring 3 cm from the scalp were included. Collected hairs were intermingled, weighed, and divided into 6 groups according to the amounts required by each laboratory, ranging from 60∼80 mg. For each laboratory, two divided samples were submitted at the same time with different IDs.
Statistical analysis
Differences among laboratories were analyzed by Friedman analysis of variance, using the mean value of two results at each laboratory. Differences between intra-laboratory data were analyzed by the Wilcoxon signed rank sum test. In all analyses, SPSS for windows (version 12.0; SPSS Inc., Chicago, IL, USA) was used. Data were valued within a confidence interval of 95%. A p-value of less than 0.05 was considered statistically significantly different (p<0.05).
RESULTS
Features of the laboratories
The features of the laboratories are summarized in Table 1. All 3 laboratories analyzed hair samples with inductively coupled plasma mass spectrometry (ICP-MS).
The advantage of ICP-MS is its lower detection threshold compared to inductively coupled plasma atomic emission spectrometry (ICP-AES). The required quantity for analysis at each laboratory was 60, 60 and 80 mg, respectively.
Laboratory A analyzed 30 elements, and B and C analyzed 26 and 38 elements, respectively. In total, 24 elements including aluminum, arsenic, barium, bismuth, cadmium, calcium, chromium, cobalt, copper, iron, lead, lithium, magnesium, manganese, molybdenum, mercury, phosphorus, potassium, selenium, sodium, sulfur, uranium, vanadium, and zinc were commonly analyzed by all 3 laboratories. Laboratories provided numerical results and interpretation, which included an evaluation of health status, prediction of possible illnessess in the future, and recommendation on dietary habit. Two laboratories (B, C) added promotions of branded supplements according to the results.
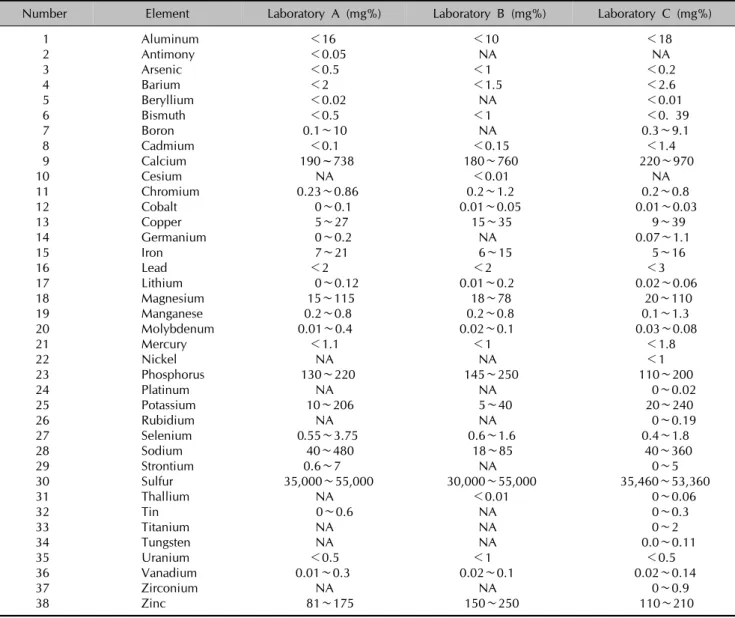
Each laboratory presented a normal reference range for each analyzed element. They were summarized in Table 2. In many elements, all 3 laboratories used different reference ranges, based on studies. As seen in Table 2, the inter-laboratory differences of the reference range for several elements were sufficiently wide in that they did not overlap.
Reliability of inter-laboratory data
The laboratories presented their results on split hair samples as illustrated in Table 3. Statistically, the Friedman test of variance indicated no significant difference between different numerical results from 6 samples (p=0.513).
In the interpretation of their own results, the laboratories did not reach a general consensus although their nu- merical results were coherent, due to different reference ranges. As summarized in Table 4, laboratory A commented that the donor lacked iron and selenium. Laboratory B
Table 2. Reference value of each laboratory
Number Element Laboratory A (mg%) Laboratory B (mg%) Laboratory C (mg%)
1 Aluminum <16 <10 <18
2 Antimony <0.05 NA NA
3 Arsenic <0.5 <1 <0.2
4 Barium <2 <1.5 <2.6
5 Beryllium <0.02 NA <0.01
6 Bismuth <0.5 <1 <0. 39
7 Boron 0.1∼10 NA 0.3∼9.1
8 Cadmium <0.1 <0.15 <1.4
9 Calcium 190~738 180∼760 220∼970
10 Cesium NA <0.01 NA
11 Chromium 0.23∼0.86 0.2∼1.2 0.2∼0.8
12 Cobalt 0∼0.1 0.01∼0.05 0.01∼0.03
13 Copper 5∼27 15∼35 9∼39
14 Germanium 0∼0.2 NA 0.07∼1.1
15 Iron 7∼21 6∼15 5∼16
16 Lead <2 <2 <3
17 Lithium 0∼0.12 0.01∼0.2 0.02∼0.06
18 Magnesium 15∼115 18∼78 20∼110
19 Manganese 0.2∼0.8 0.2∼0.8 0.1∼1.3
20 Molybdenum 0.01∼0.4 0.02∼0.1 0.03∼0.08
21 Mercury <1.1 <1 <1.8
22 Nickel NA NA <1
23 Phosphorus 130∼220 145∼250 110∼200
24 Platinum NA NA 0∼0.02
25 Potassium 10∼206 5∼40 20∼240
26 Rubidium NA NA 0∼0.19
27 Selenium 0.55∼3.75 0.6∼1.6 0.4∼1.8
28 Sodium 40∼480 18∼85 40∼360
29 Strontium 0.6∼7 NA 0∼5
30 Sulfur 35,000∼55,000 30,000∼55,000 35,460∼53,360
31 Thallium NA <0.01 0∼0.06
32 Tin 0∼0.6 NA 0∼0.3
33 Titanium NA NA 0∼2
34 Tungsten NA NA 0.0∼0.11
35 Uranium <0.5 <1 <0.5
36 Vanadium 0.01∼0.3 0.02∼0.1 0.02∼0.14
37 Zirconium NA NA 0∼0.9
38 Zinc 81∼175 150∼250 110∼210
NA: not analyzed.
identified a cobalt, copper, selenium, zinc and phos- phorus deficiency. According to laboratory C, the donor was only deficient in molybdenum. As a result, these differences resulted in the laboratories recommending different nutritional supplements and treatments to the hair donor.
Reliability of intra-laboratory data
The laboratories did not reproduce identical results, but statistically they were coherent numerical results according to the Wilcoxon signed rank sum test (p=
0.513).
On interpretation, laboratory B failed to produce consistent results. B detected a cobalt, copper, selenium, and zinc deficiency in one hair sample, and a deficiency
in cobalt, copper, selenium, and phosphorus in another one.
Comparison of blood test and hair mineral analysis The laboratories indicated that the donor might experience symptoms such as chronic fatigue, dizziness, insomnia, depression, and anxiety. They also claimed he was at increased risk of developing osteomalasia, skin disease, arthralgia, anemia, hypercholesterolemia, alopecia and myalagia. In actuality, the donor did not experience health problems, and his blood test, EKG, and chest radiograph were unremarkable. Specifically, his serum levels of copper, zinc, iron, and magnesium was normal, but his iron level was below the normal limit according to laboratory A. Laboratory B concluded that he was copper
Table 3. Results of generated at each laboratory
Number Element A-1 (mg%) A-2 (mg%) B-1 (mg%) B-2 (mg%) C-1 (mg%) C-2 (mg%)
1 Aluminum 6 6.9 4.282 4.001 5 5
2 Antimony 0.009 0.007 NA NA NA NA
3 Arsenic 0.04 0.02 0.104 0.102 0.06 0.07
4 Barium 0.91 0.89 0.531 0.599 1 0.9
5 Beryllium 0.002 0.003 NA NA 0.01 0.01
6 Bismuth 0.01 0 0.03 0.038 0.02 0.02
7 Boron 1.91 1.85 NA NA 0.6 1.8
8 Cadmium 0.02 0.02 0.024 0.019 0.02 0.03
9 Calcium 568 514 353.6 418 730 670
10 Cesium NA NA 0.001 0.001 NA NA
11 Chromium 0.58 0.59 0.215 0.224 0.4 0.5
12 Cobalt 0.001 0 0.009* 0.009* 0.01 0. 01
13 Copper 7.9 7.8 10.58* 10.98* 9 9
14 Germanium 0.019 0.018 NA NA 0.07 0.07
15 Iron 4.2* 4.2* 6.861 6.63 5 5
16 Lead 0.22 0.24 0.43 0.395 1 1
17 Lithium 0.06 0.056 0.012 0.012 0.01 0.01
18 Magnesium 60 55 25.33 32.98 58 50
19 Manganese 0.36 0.37 0.298 0.333 0.5 0.42
20 Molybdenum 0.017 0.014 0.023 0.023 0.02* 0.02*
21 Mercury 0.18 0.19 0.59 0.625 0.8 0.8
22 Nickel NA NA NA NA 0.1 0.1
23 Phosphorus 158 156 164.5 141.6* 150 150
24 Platinum NA NA NA NA 0.01 0.01
25 Potassium 117 140 17.04 16.13 100 120
26 Rubidium NA NA NA NA 0.104 0.124
27 Selenium 0.44* 0.37* 0.528* 0.517* 0.4 0.4
28 Sodium 216 274 35.93 31.74 210 240
29 Strontium 2.37 2.25 NA NA 3.3 2.8
30 Sulfur 42080 41595 33262 34244 39240 40270
31 Thallium NA NA 0.001 0.001 0.005 0.005
32 Tin 0.096 0.081 NA NA 0.1 0.1
33 Titanium NA NA NA NA 0.7 0.6
34 Tungsten NA NA NA NA 0.01 0.01
35 Uranium 0.01 0.01 0.015 0.006 0.005 0.005
36 Vanadium 0.076 0.072 0.033 0.037 0.04 0.05
37 Zirconium NA NA NA NA 0.1 0.1
38 Zinc 173 166 136* 155.5 190 180
NA: not analyzed. *Above or below normal reference range.
Table 4. Elements below the normal reference range at each laboratory
A-1 A-2 B-1 B-2 C-1 C-2
Elements Iron Iron Cobalt Cobalt Molybdenum Molybdenum
Selenium Selenium Copper Copper
Selenium Selenium
Zinc Phosphorus
and zinc deficient (Table 5).
DISCUSSION
Hair analysis provides good evidence in the fields of forensic and clinical toxicology, doping control, and occupational medicine, but do not demonstrate clear
evidence in the fields of general health screening. While urine and blood tests show the recent and current body status, hair represents a longer time frame, which can incorporate many years1. Since the elements are present in the hair at higher levels, more sensitive and accurate analysis results can be expected9. As such, it has been suggested that hair mineral analysis can be a cost-effective
Table 5. Comparison of the result between blood test and hair mineral analysis
Element Blood test Laboratory A Laboratory B Laboratory B
Iron Normal Below normal* Normal Normal
Magnesium Normal Normal Normal Normal
Zinc Normal Normal Below normal* Normal
Copper Normal Normal Below normal* Normal
Selenium Not done Below normal* Below normal* Normal
*Below normal reference range.
means of screening an individual, or monitoring a patient during putative toxic exposure or its therapy10.
However, the analysis of elements in hair remains controversial. There exists little or no evidence to support hair as a true biological marker. Analytical accuracy and lack of standardization have been cited as the main challenge. In the field of dermatology, trichothiodystrophy is a well known candidate disease for hair mineral analysis, but other skin diseases including hair diseases are not. In 1985, Barrett8 asserted that commercial use of hair analysis is unscientific and economically wasteful after assessing the reliability of commercial hair mineral test results. Seidel et al.11 concluded that commercial laboratories failed to generate consistent results in 2001.
Seidel et al.11 also called the varied normal reference ranges into question. In a similar study conducted in Germany in 2002, the accuracy of hair mineral analysis was refuted12.
In a matter of accuracy, it displayed different results in our study compared to those previously. All 3 commercial laboratories generated coherent results on identical hair samples in repeated analyses. There were imperceptible numerical gaps, but were deemed insignificant by statistical analysis. This may partly be due to identical analysis methods, unlike those studied previously. The non-standardized reference ranges remained a major challenge. In inter-laboratory comparison, each laboratory gave different interpretations on the same patient, because they applied different normal ranges. Insufficient elements were detected and possible predicted future health problems varied, and each laboratory recommended different nutritional supplements.
In intra-laboratory comparison, laboratory A, C made the same interpretations but laboratory B did not. Laboratory B needs to improve its detection consistency.
Compared with serum copper, zinc, iron and magnesium, laboratory A gave a different interpretation in iron and B gave one in copper, and zinc. Laboratory C made an identical interpretation in all three elements. These differences represent a challenge in the evaluation of a patient’s health. More research is required to evaluate for
the correlation between clinical state, hair mineral analysis and blood test.
For now, it appears that we can apply hair analysis carefully as an ancillary tool to evaluate patients, in addition to history taking, physical examination, diet, lifestyle, the environment, and other laboratory data because each laboratory can generate precise numerical results1,14. However, hair mineral analysis cannot be a primary tool for the assessment of individual health without a well-established normal reference range, because the interpretation of results varies greatly according to the wide diverse reference range of each laboratory. It remains a challenge to establish ‘normal’
reference ranges for minor and trace elements in human hair due to the natural variance of hair compositions9. Thus, well-designed large-scale studies are needed to standardize international reference ranges for hair mineral elements.
ACKNOWLEDGMENT
The present research was conducted by the research fund of Dankook University in 2010.
REFERENCES
1. Bass DA, Hickock D, Quig D, Urek K. Trace element analysis in hair: factors determining accuracy, precision, and reliability. Altern Med Rev 2001;6:472-481.
2. Suliburska J, Bogdański P, Pupek-Musialik D, Krejpcio Z.
Dietary intake and serum and hair concentrations of minerals and their relationship with serum lipids and glucose levels in hypertensive and obese patients with insulin resistance. Biol Trace Elem Res 2011;139:137-150.
3. Kim OY, Baek SH, Lee YJ, Lee KH. Association of increased hair calcium levels and enhanced augmentation index (AIx): a marker of arterial stiffness. Biol Trace Elem Res 2010;138:90-98.
4. Park SB, Choi SW, Nam AY. Hair tissue mineral analysis and metabolic syndrome. Biol Trace Elem Res 2009;130:
218-228.
5. Yasuda H, Yoshida K, Segawa M, Tokuda R, Tsutsui T, Yasuda Y, et al. Metallomics study using hair mineral
analysis and multiple logistic regression analysis: relation- ship between cancer and minerals. Environ Health Prev Med 2009;14:261-266.
6. Rautio A, Kunnasranta M, Valtonen A, Ikonen M, Hyvärinen H, Holopainen IJ, et al. Sex, age, and tissue specific accumulation of eight metals, arsenic, and selenium in the European hedgehog (Erinaceus europaeus).
Arch Environ Contam Toxicol 2010;59:642-651.
7. Grabeklis AR, Skalny AV, Nechiporenko SP, Lakarova EV.
Indicator ability of biosubstances in monitoring the moderate occupational exposure to toxic metals. J Trace Elem Med Biol 2011;25 Suppl 1:S41-44.
8. Barrett S. Commercial hair analysis. Science or scam?
JAMA 1985;254:1041-1045.
9. Miekeley N, Dias Carneiro MT, da Silveira CL. How reliable are human hair reference intervals for trace
elements? Sci Total Environ 1998;218:9-17.
10. Druyan ME, Bass D, Puchyr R, Urek K, Quig D, Harmon E, et al. Determination of reference ranges for elements in human scalp hair. Biol Trace Elem Res 1998;62:183-197.
11. Seidel S, Kreutzer R, Smith D, McNeel S, Gilliss D.
Assessment of commercial laboratories performing hair mineral analysis. JAMA 2001;285:67-72.
12. Drasch G, Roider G. Assessment of hair mineral analysis commercially offered in Germany. J Trace Elem Med Biol 2002;16:27-31.
13. Steindel SJ, Howanitz PJ. The uncertainty of hair analysis for trace metals. JAMA 2001;285:83-85.
14. Hamilton T, Schweinsberg F. The reliability of conclusions based on hair mineral analysis in individual diagnostic.
Versicherungsmedizin 2004;56:136-140.