• 검색 결과가 없습니다.

Frequency Characteristics of Surface Wave Generated by Single-Line Pulsed Laser Beam with Two Kinds of Spatial Energy Profile Models: Gaussian and Square-Like

N/A
N/A
Protected

Academic year: 2021

Share "Frequency Characteristics of Surface Wave Generated by Single-Line Pulsed Laser Beam with Two Kinds of Spatial Energy Profile Models: Gaussian and Square-Like"

Copied!
8
0
0

로드 중.... (전체 텍스트 보기)

전체 글

(1)

http://dx.doi.org/10.7779/JKSNT.2012.32.4.347

Frequency Characteristics of Surface Wave Generated by Single-Line Pulsed Laser Beam with Two Kinds of Spatial Energy Profile Models: Gaussian and Square-Like

Hogeon Seo*, Myunghwan Kim*, Sungho Choi**, Chung Seok Kim*** and Kyung-Young Jhang*

Abstract Using a single-line pulsed laser beam is well known as a useful noncontact method to generate a directional surface acoustic wave. In this method, different laser beam energy profiles produce different waveforms and frequency characteristics. In this paper, we considered two typical kinds of laser beam energy profiles, Gaussian and square-like, to find out a difference in the frequency characteristics. To achieve this, mathematical models were proposed first for Gaussian laser beam profile and square-like respectively, both of which depended on the laser beam width. To verify the theoretical models, experimental setups with a cylindrical lens and a line-slit mask were respectively designed to produce a line laser beam with Gaussian spatial energy profile and square-like. The frequency responses of the theoretical models showed good agreement with experimental results in terms of the existence of harmonic frequency components and the shift of the first peak frequencies to low.

Keywords: Surface Wave, Laser-Ultrasound, Line Beam, Energy Profile, Gaussian, Square-Like [Original paper]

Journal of the Korean Society for Nondestructive Testing Vol. 32, No. 4 (2012. 8)

[Received: June 19, 2012, Revised: August 9, 2012, Accepted: August 10, 2012] *School of Mechanical Engineering, Hanyang University, Seoul 133-791, Korea, **Department of Automotive Engineering, Graduate School of Hanyang University, Seoul 133-791, Korea, ***Department of Automotive Engineering, Hanyang University, Seoul 133-791, Korea ✝ Corresponding Author: [email protected]

1. Introduction

A surface wave can be generated by a pulsed laser beam, which is beneficial as a noncontact method [1-3]. Owing to its intrinsic noncontact nature, the automated inspection can be more convenient and more pragmatic [4]. Moreover, this technique provides an advantage that various shapes of surface waves can be easily produced by modulating the shape of laser beam that illuminates the surface of the specimen [5,6].

In the case of a single-point laser beam, not only the generated surface wave propagates into all directions but also the wave energy disperses. However, by using a line laser beam, the directivity of the surface wave can be improved [5]. A line laser beam can be produced by several methods such as the use of

a cylindrical lens and a line-slit mask [2,4,7]. In these methods, the spatial laser energy profile can be largely classified into two kinds:

Gaussian and non-Gaussian.

In most cases that use focusing optics such as a cylindrical lens and so on, the spatial laser energy profile can be regarded as Gaussian;

however, in the case of using a line-slit mask,

the laser beam shape is considerably dependent

on the slit shape. Since the waveform of the

generated surface wave depends on the spatial

energy profile of the incident laser beam onto

the surface, different energy profiles produce

different waveforms which have different

frequency characteristics. In this study, a line-slit

mask was used to consider a typical example of

non-Gaussian energy profile: square-like. After

the laser beam passes the slit, it could be

(2)

( )

2

h G ξ ∝ ξ e ξ (3)

considered as a line laser beam with square-like energy profile [8].

The objective of this paper is to find out a difference in the frequency characteristics of the surface wave generated by single-line pulsed laser beams with those two typical kinds of spatial energy profiles: Gaussian and square-like.

To achieve this, the mathematical models were presented first for Gaussian laser beam profile and square-like with the assumption that in both cases the temporal profiles were Dirac delta function. After the waveform and the frequency spectra were analyzed, they were compared by simulations.

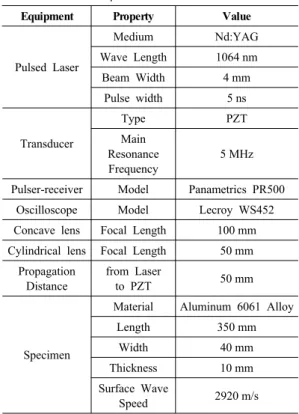
To verify the validity of presented mathematical models, the generated surface waves were experimentally analyzed. In experiments, a cylindrical lens was used to produce a line laser beam with Gaussian spatial energy profile and a line-slit mask was used to produce a line laser beam with square-like spatial energy profile.

Finally, the waveforms and their frequency characteristics obtained from experiments were compared with the simulation results.

2. Basic Theories of Surface Wave Generation 2.1 Principle of Surface Wave Generation

A surface wave generated by a pulsed laser beam results from thermal expansion and contraction of the surface of the specimen, which is caused by interaction between the laser and the surface within thermo-elastic regime [9].

Once a laser beam irradiates on the surface, the laser beam energy is partially absorbed into the specimen and then results in rapidly heating up and cooling down the surface [3]. This thermal variation induces thermal expansion and contraction in the local regime of the surface, which gives rise to thermal stress of the surface.

From this thermal stress, a surface wave is

generated and then propagates along the surface [2,10].

2.2 Gaussian Spatial Energy Profile

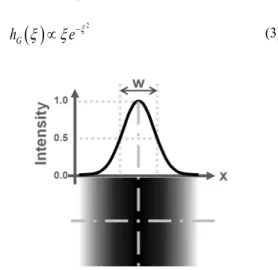
The one-dimensional spatial energy profile of a line Gaussian laser beam as shown in Fig. 1 can be proportionally approximated as follows,

( )

2

2.77 ,

x w

I x G e

− ⎛ ⎞ ⎜ ⎟ ⎝ ⎠

(1)

where   is the laser energy intensity, is the one-dimensional spatial position on the surface of the specimen and w is the effective width of laser beam as shown in Fig. 1 [11].

However, in order to consider the movement of the surface wave in both time and spatial domain, eqn. (1) is necessary to be represented as a function of the normalized retarded time  as follows,

( )

2

,

I G ξ ∝ e ξ (2)

where ξ is   ×    ,  is the propagation distance,  is the propagation speed of Rayleigh waves and  is time, respectively.

Subsequently, the waveform of the generated surface wave can be obtained from the derivative of eqn. (2) as follows [11,12],

Fig. 1 Cross-section view of a spatial energy

profile of a line Gaussian laser beam

(3)

To consider the waveform of the generated surface wave with respect to w in only time domain, eqn. (3) is rewritten as follows,

( )

2

2.77 ,

x

P

ct P w

G

x ct

h t e

w

⎛ ⎞

− ⎜ ⎝ ⎟ ⎠

∝ − (4)

where  and  are fixed constants.

2.3 Square-Like Spatial Energy Profile

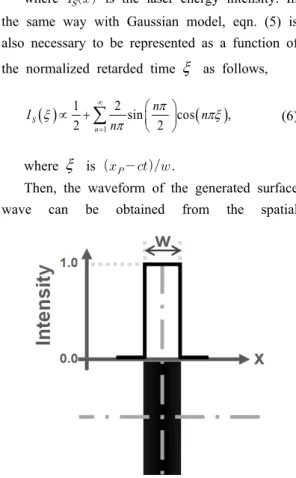
The one-dimensional spatial energy profile of a line square-like laser beam as shown in Fig. 2 can be proportionally approximated by using Fourier series as follows,

( )

1

1 2 sin cos ,

2 2

S

n

n n x

I x n w

π π

π

=

⎛ ⎞ ⎛ ⎞

∝ + ⎜ ⎟ ⎜ ⎟

⎝ ⎠ ⎝ ⎠

(5)

where   is the laser energy intensity. In the same way with Gaussian model, eqn. (5) is also necessary to be represented as a function of the normalized retarded time ξ as follows,

( ) ( )

1

1 2

sin cos ,

2 2

S

n

I n n

n

ξ π πξ

π

=

⎛ ⎞

∝ + ∑ ⎜ ⎝ ⎟ ⎠ (6)

where ξ is    .

Then, the waveform of the generated surface wave can be obtained from the spatial

Fig. 2 Cross-section view of a spatial energy profile of a line square-like laser beam

derivative of eqn. (6) as follows,

( ) ( )

1

sin sin

S

2

n

h ξ

n π n πξ

=

⎛ ⎞

∝ ⎜ ⎟

⎝ ⎠

(7)

To consider the waveform of the generated surface wave with respect to w in only time domain, eqn. (7) is rewritten as follows,

( ) ( )

1

sin sin ,

2

P S

n

n x ct h t n

w π π

=

⎛ ⎞

⎛ ⎞

∝ ∑ ⎜ ⎝ ⎟ ⎠ ⎜ ⎝ ⎟ ⎠ (8)

where  and  are fixed constants.

3. Simulations

3.1 Gaussian Spatial Energy Profile

For general analysis about a generated surface wave, it is necessary to consider thermodynamic characteristics in the specimen.

However, in this paper, the thermodynamic effects are neglected since only the frequency response of the generated surface wave is going to be discussed to find out a difference in the frequency characteristics according to different surface waves generated by lasers with different spatial energy profiles: Gaussian and square-like.

For theoretical analysis of Gaussian spatial energy profile, the spatial energy profile and the generated surface wave were simulated with eqn.

(1) and eqn. (4), respectively. Assuming that the characteristic width w was gradually increased from 0.5 mm to 1.5 mm in 0.5 mm step.

The Gaussian spatial energy profiles were shown in Fig. 3(a) from eqn. (1). Where, the intensity was normalized. The generated surface waves were as shown in Fig. 3(b) from eqn.

(4). Where, their amplitudes were also normalized and also their time axes were shifted to align the middle point between the positive peak and the negative peak to time zero.

The frequency spectra of those surface waves

were computed with a fast Fourier transform

(4)

(a) (a)

(b) (b)

(c) (c)

Fig. 3 (a) Theoretical spatial energy profiles of Gaussian laser beams, (b) theoretical displacement waveforms of the surface waves generated by the spatial energy profiles in (a) and (c) theoretical frequency spectra of the generated surface waves in (b)

Fig. 4 (a) Theoretical spatial energy profiles of square-like laser beams, (b) theoretical displacement waveforms of the surface waves generated by the spatial energy profiles in (a) and (c) theoretical frequency spectra of the generated surface waves in (b)

(FFT) as shown in Fig. 3(c), which showed that it had a single peak each and the peak frequency shifted to the lower frequency as w was increased. The proportion of high frequency spectra diminished to zero as w was increased.

3.2 Square-Like Spatial Energy Profile

For theoretical analysis of square-like spatial energy profile, similar simulations were carried out with eqn. (5) and eqn. (8), respectively.

Assuming that the laser beam width w was gradually increased from 0.5 mm to 1.5 mm in 0.5 mm step and were from 1 to 300.

The square-like spatial energy profiles were shown in Fig. 4(a) from eqn. (5). The generated surface waves were shown in Fig. 4(b) from eqn. (8). Likewise with Gaussian model, the time span between two peaks became broad as w was increased.

The frequency spectra of those surface

waves were computed with the fast Fourier

(5)

transform(FFT) as shown in Fig. 4(c), which showed a significant difference with the Gaussian model, that is, they had multiple peaks. In other words, the harmonic frequency spectra appeared. Whereas, the peak frequencies shifted to the lower frequency as w was increased, which has the same tendency to the Gaussian model.

4. Experiments

4.1 Experimental Setups

Fig. 5 illustrates the experimental setups used to modulate a source laser beam into single-line laser beams with Gaussian spatial energy profile and square-like, respectively.

Table 1 shows specifications of experimental equipment and a specimen. The specimen was cut from a rolled plate and the surface of it was not polished. This is because the spatial profile of the laser intensity on a surface and the frequency characteristics of a generated surface

(a)

(b)

Fig. 5 Schematic design of the experimental setups for modulating source laser beam into single-line laser beams with (a) Gaussian spatial energy profile and (b) square-like

wave are not seriously influenced by its surface roughness although it can affect the amplitude of the surface wave.

Concave lens with 100 mm focal length was used to expand the laser beam from the pulsed laser generator to 20 mm in diameter (EBW:

expanded beam width) at 400 mm distance from the concave lens.

To modulate the expanded laser beam into a line with Gaussian spatial energy profile, a cylindrical lens with the focal length of 50 mm was used. After the expanded laser beam passed through the cylindrical lens, the laser beam focused in the horizontal direction only as shown in Fig. 1. By adjusting the distance between the cylindrical lens and the surface of the specimen, the laser beam width w was changed from 0.5 mm to 1.5 mm in 0.5 mm step.

To modulate the expanded laser beam into a line beam with square-like spatial energy profile, a line-slit mask was used. After the laser beam

Table 1 Specifications of experimental equipment and the specimen

Equipment Property Value

Pulsed Laser

Medium Nd:YAG

Wave Length 1064 nm

Beam Width 4 mm

Pulse width 5 ns

Transducer

Type PZT

Main Resonance Frequency

5 MHz

Pulser-receiver Model Panametrics PR500 Oscilloscope Model Lecroy WS452 Concave lens Focal Length 100 mm Cylindrical lens Focal Length 50 mm

Propagation Distance

from Laser

to PZT 50 mm

Specimen

Material Aluminum 6061 Alloy

Length 350 mm

Width 40 mm

Thickness 10 mm

Surface Wave

Speed 2920 m/s

(6)

(a)

(b)

(a)

(b) Fig. 7 (a) Experimental displacement waveforms of

surface waves generated by single-line laser beams with Gaussian energy profiles and (b) experimental frequency spectra of the generated surface waves in (a)

Fig. 8 (a) Experimental displacement waveforms of surface waves generated by single-line laser beams with square-like energy profiles and (b) experimental frequency spectra of the generated surface waves in (a)

(a) (b) (c) Fig. 6 Laser burn paper images, (a) focused single-

line laser beam with Gaussian spatial energy profile modulated by a cylindrical lens, (b) defocused single-line laser beam with Gaussian spatial energy profile modulated by a cylindrical lens and (c) single-line laser beam with square-like spatial energy profile truncated by a line-slit mask

passing the slit mask attached on the surface of the specimen, the laser beam was truncated as shown in Fig. 2. w was changed by replacing the slit mask of which the slit width was from 0.5 mm to 1.5 mm in 0.5 mm step.

4.2 Experimental Results

In order to confirm the laser beam profile first, the modulated laser beams were irradiated on laser burn paper as shown in Fig. 6, where (a) and (b) were obtained by using a cylindrical lens, and (c) was obtained by slit masking. We can see that Gaussian laser beam and square-like laser beam have been properly produced.

Figs. 7 and 8 show the received waveform

of surface waves and their frequency spectra

generated by the single-line laser beam

modulated by cylindrical lens and slit masks,

respectively. Where, the amplitudes were

normalized. As we can see in Fig. 7(b), the

(7)

frequency spectra of the waveform obtained in the focusing method had a single peak and the peak frequency shifted to the lower frequency as w was increased. The proportion of high frequency spectra diminished to zero as w was increased. These results agree well with the theoretical predictions as shown Fig. 3(c).

Contrarily, as was shown in Fig. 8(b), the frequency spectra obtained in the slit masking method showed multiple peaks and the peak frequencies shifted to the lower frequency as w was increased. These results are also in good agreement with the theoretical predictions as shown in Fig. 4(c). However, it should be noted that there were mismatches in the waveform and the frequency spectra of the surface wave generated by the slit mask between in simulations and in experiments. That is, the waveform shown in Fig. 8(a) is not impulse like as shown in Fig. 4(b), and the magnitudes of harmonic frequency spectra in experiment gradually decrease but don’t in simulation.

These mismatches are due to the fact that the thermodynamic characteristics and heat loss in the specimen were not considered in the simulation. Also, the Fourier series representation of a square-like pulse shown in eqn. (5) was for a pulse wave of a periodic pulse train; however, in the case of a non-periodic single pulse wave, the peaks of harmonic frequency components will decrease as observed in the experimental results shown in Fig. 8(b).

Nevertheless, in the case of considering the difference of the frequency characteristics, the presented mathematical models are suitable enough to analyze and distinguish the surface wave generated by laser beams with Gaussian and square-like spatial energy profiles.

5. Conclusions

To figure out a difference in the frequency characteristics of the surface wave generated by

laser beams with specific two kinds of spatial energy profiles: Gaussian and square-like, mathematical models were presented. By comparing the frequency characteristics between simulation results and experimental results, differences of the frequency characteristics according to different profiles were ascertained and presented models were verified.

In terms of the existence of harmonic frequency components, there was a significant distinction between Gaussian profile and square-like. That is, Gaussian beam profile does not generate the harmonic frequency components;

however, the square-like beam profile generates harmonic frequency components. This difference can be considered as an obvious factor to distinguish the frequency characteristics of the surface wave generated by the Gaussian laser beam and the square-like laser beam.

Acknowledgements

This work was supported by the Innovations in Nuclear Power Technology of the Korea Institute of Energy Technology Evaluation and Planning (KETEP) grant funded by the Korea government Ministry of Knowledge Economy.

(No. 20101620100080) References

[1] S. Kenderian, B. B. Djordjevic and R. E.

Jr. Green, "Narrow band laser-generated surface acoustic waves using a formed source in the ablative regime," Journal of the Acoustical Society of America, Vol.

113, No. 1, pp. 261-266 (2003)

[2] A. Lomonosov, V. G. Mikhalevich, P. Hess, E. Y. Knight, M. F. Hamilton and E. A.

Zabolotskaya, "Laser-generated nonlinear Rayleigh waves with shocks," Journal of the Acoustical Society of America, Vol.

105, No. 4, pp. 2093-2096 (1999)

(8)

[3] C. B. Scruby and L. E. Drain, "Laser Ultrasonics: Techniques and Applications,"

Bristol: Adam Hilger (1990)

[4] T. Y. Wu and I. Charles Ume,

"Fundamental study of laser generation of narrowband Lamb waves using super- imposed line sources technique," NDT&E International, Vol. 44, pp. 315-323 (2011) [5] H. J. Kim, K. Y. Jhang, M. J. Shin and J. Y. Kim, "A noncontact NDE method using a laser generated focused-Lamb wave with enhanced defect-detection ability and spatial resolution," NDT&E International, Vol. 39, pp. 312-319 (2006) [6] K. Y. Jhang, M. J. Shin and B. O. Lim,

"Application of the laser generated focused-Lamb wave for non-contact imaging of defects in plate," Ultrasonics, Vol. 44, pp. 1265-1268 (2006)

[7] Y. Sohn and S. Krishnaswamy, "Interaction of a scanning laser-generated ultrasonic line source with a surface-breaking flaw," Journal of the Acoustical Society of America, Vol.

115, No. 1, pp. 172-181 (2004)

[8] S. H. Choi, T. Y. Nam, C. S. Kim and K. Y. Jhang, "Frequency response of narrowband surface waves generated by

laser beams spatially modulated with a line-arrayed slit mask," Journal of the Korean Physical Society, Vol. 60, No. 1, pp. 26-30 (2012)

[9] J. S. Kim, T. Y. Nam, S. H. Choi and K.

Y. Jhang, "Assessment of plastic deformation in Al6061 alloy using acoustic nonlinearity of laser-generated surface wave," Journal of the Korean Society for Nondestructive Testing, Vol. 32, No. 1, pp. 20-26 (2012)

[10] T. Y. Nam, S. H. Choi, T. H. Lee, C. S.

Kim and K. Y. Jhang, "Acoustic nonlinearity of narrowband laser-generated surface waves in the bending fatigue of Al6061 alloy," Journal of the Korean Physical Society, Vol. 57, No. 5, pp.

1212-1217 (2010)

[11] Y. H. Berthelot and J. Jarzynski,

"Directional laser generation and detection of ultrasound with arrays of optical fibers," Journal of Nondestructive Evaluation, Vol. 9, No. 4, 274 (1990)

[12] C. E. Duffor and C. P. Burge, "Narrow

band laser ultrasonic NDE," Review of

Progress in Quantitative nondestructive

Evaluation, Vol. 15, pp. 593-600 (1996)

수치

Fig. 1 Cross-section view of a spatial energy  profile of a line Gaussian laser beam
Fig. 2 Cross-section view of a spatial energy profile of a line square-like laser beam
Fig. 5 illustrates the experimental setups  used to modulate a source laser beam into  single-line laser beams with Gaussian spatial  energy profile and square-like, respectively

참조

관련 문서

- Symmetric strike of the pellet by the incident laser or ion beam and efficient energy coupling between the beam and the target:.. deeper penetration using high

10 Change of frequency characteristics of the resonators according to adjustment of their g/L ratios ··· 17 Fig.. 11 Change of frequency characteristics of the resonators

Study of Thermal Effects and Structural Deformation Induced by Pulsed Laser Absorption in Human Skin.. By Jae-Young Kim Advisor

3.9 Bead and cross section profiles of welds in LASER welding. Bead

First, the general characteristics of the two groups were analyzed by frequency analysis and correlation analysis, which is technical statistics, and the

LIST OF TABLES... LIST

load and differential output have a superior p p high frequency response over differential amplifiers with current mirror load and. amplifiers with current mirror load

fully developed sea: unlimited fetch and duration of wind; wind energy input is balanced by energy dissipation due to wave breaking.. growing sea: limited fetch and