387
Hematological manifestations in dogs progressing to the iron deficiency anemia by repeated phlebotomy
Young-Wook Kwon, Doo Kim, Son-Il Pak*
School of Veterinary Medicine and Institute of Veterinary Science, Kangwon National University, Chuncheon 200-701, Korea
(Accepted: November 8, 2006)
Abstract : Progressing to the iron deficiency anemia was experimentally induced in 4 clinically healthy dogs by repeated phlebotomy to characterize hematologic features, serum iron values, and RBC indices.
Abnormal RBC morphologies were also evaluated semiquantitatively on Wright’s-stained blood films.
Hematologic abnormalities in early stage of anemia included decreased both hematocrit and hemoglobin, and reticulocytosis, with no changes in mean corpuscular volume (MCV) and mean corpuscular hemog- lobin concentration (MCHC) were represented. In intermediate stage, decreased serum iron concentration with microcytosis and hypochromia were prominent. In late stage, red cell distribution width and Mentzer’s index were out of reference ranges in the majority of dogs. In this study microcytic anemia was appeared at the hemoglobin range of 5.1-7.2 g/dl. On most sampling days, platelet counts and white blood cells were within the reference ranges, with some minor variations. Iron deficiency was not necessarily associated with microcytic anemia. Judging from the sequential changes of both MCV and MCHC, 3 patterns of anemia were sequentially observed: initially normocytic normochromic, intermediate normocytic hypochromic or normocytic normochormic, and finally microcytic hypochromic. The most frequent morphologic abnormalities were target cells. Occasional elliptocyte, acanthocyte, stomatocyte, kinzocyte, dacrocyte and schistocyte were also noted on the blood films.
Key words : anemia, dog, iron deficiency, phlebotomy, RBC morphology
Introduction
With the exception of young growing animals, iron deficiency anemia (IDA) in dogs usually results from persistent blood loss or dietary deficiency of iron.
Chronic blood loss leading to iron depletion is common in dogs with gastrointestinal bleeding caused by gastric ulcers, neoplasia, or endoparasites, and in those with heavy flea infestation. The laboratory findings of IDA include decreased mean corpuscular volume (MCV), erythrocyte hypochromia, decreased mean corpuscular hemoglobin concentration (MCHC), increased red cell distribution width (RDW), thrombocytosis, and reticu- locytosis during early iron deficiency except in the horse [15]. Other abnormalities include decreased serum iron level, hypoferremia, decreased transferrin saturation, normal or increased total iron binding capacity (TIBC) [16, 32], minimal or absent stainable
iron in the bone marrow of most species, and RBC size and shape changes on blood smears [14]. However, some of these observations vary depending on the clinical stages of iron depletion and the cause of iron deficiency; RBC morphologic changes typically occur in more advanced stages of iron depletion and reticulocytosis may not occur if the iron deficiency is caused by decreased intake [8]. IDAs with involvement of many laboratory findings have been described [10, 31], resulting in difficulties for clinicians to confirm suspected cases of iron deficiency in various clinical stages. In addition, erythroid regenerative response in clinical cases may be affected by many confounding factors such as concurrent parasitemia, neoplasia, or inflammation [31]. In practical point of views, the most important problem in diagnosing IDA is that the sensitivity of any single test is low except marrow examination [13].
*Corresponding author: Son-Il Pak
School of Veterinary Medicine and Institute of Veterinary Science, Kangwon National University, Chuncheon 200-701, Korea
[Tel: +82-33-250-8672, Fax: +82-33-244-2367, E-mail: [email protected]]
So far, studies that attempts to characterize hematolo- gical values and RBC abnormalities over time in IDA have limited in the veterinary medical literatures, especially in dogs [7, 32]. Therefore, the primary purpose of this study was to characterize hematologic features of IDA and morphologic abnormalities of RBC experimentally induced by repeated phlebotomy, and thus to give clinicians insights into making a diagnosis of IDA.
Materials and Methods
Animals and phlebotomy
Four clinically healthy adult mixed-breed dogs (3 males and 1 female), with an age range of 3 to 5 years, weighing 5-10 kg were included in the study. The dogs were housed at the animal hospital and handled in a
manner similar to that of hospitalized dogs. Judging from the routine physical check-up and hematological or biochemical analysis, all dogs had no history of excess blood loss and were clinically healthy at the beginning of the study and no drug had been adminis- tered to any of the dogs for 2 weeks prior to and during the study. Diet and water were provided ad libitum . Approximately 10% of total blood volume was withdrawn from the jugular vein of each dog on every 2 days intervals after the first withdrawal for 37 days.
Blood samples were obtained from each dog between 09:00 and 12:00 h after being seated for 10 min. Two ml of blood were transferred to ethylenediamine tetraa- cetic acid tube and were analyzed within 2 h after collection. Blood for iron analyses was collected in clot tubes. Serum was removed from the cells and frozen at
−20
oC until analysis.
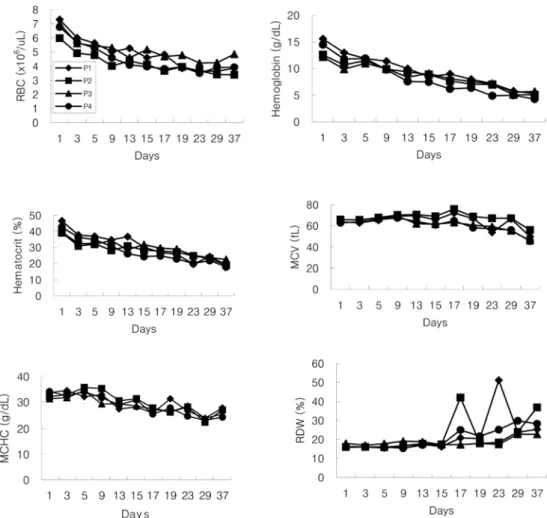
Fig. 1. Sequential changes of erythrocyte parameters in 4 phlebotomy dogs (P1 to P4).
Evaluation of erythrocyte shape changes
Wright’s stained blood smears were evaluated using a light microscope quantitatively for the degree of erythrocyte shape changes (poikilocytosis) by counting and characterizing the number and type of abnormal RBC in a total of 1,000 RBC at 1000x magnification.
The areas of the smear examined were limited to monolayer in which RBC did not overlap. Erythrocyte shape changes were categorized as previously described [19, 27]. No attempt was made to differentiate kerato- cytes from acanthocytes since a clear distinction was not apparent. Reticulocyte was counted using new methylene blue-stained blood films. The absolute reticulocyte count was calculated by multiplying the percentage of reticulocytes in 1,000 erythrocytes by the RBC count. The corrected reticulocyte count percentage to a normal hematocrit (HCT) of 45% and reticulocyte production index considering expected maturation time of reticulocyte were also computed [22].
Hematology and serum iron
The laboratory was kept blinded as to which identification numbers belonged to which individual dogs. The complete blood cell counts (CBCs) were determined with an automated hematology analyzer (Hemacyte; CDC, USA). The instrument was operated with manufacturer’s reagents and protocols for calib- ration and maintenance. The following parameters were measured in each dog; RBC count, HCT, hemoglobin, MCV, MCHC, and RDW, platelet count, and mean platelet volume (MPV). Mentzer’s index was calculated in each case by dividing MCV by the RBC count [21].
Serum iron was measured using a serum chemistry analyzer (Ektachem; Johnson & Johnson, USA).
Results
The sequential changes of RBC parameters in four phlebotomy dogs during 37 days were shown in Fig.
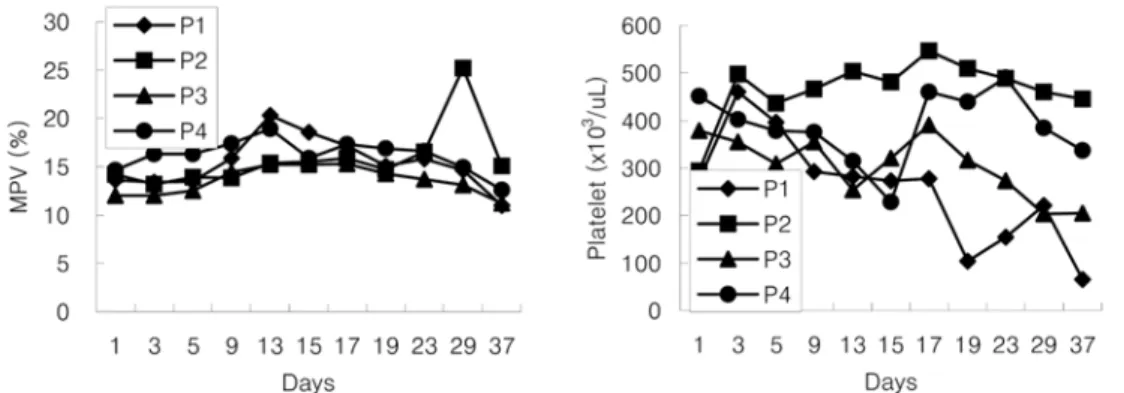
1. HCT decreased rapidly in all dogs 3 days after phlebotomy and gradually decreased (17-24%) until phlebotomy stopped on day 37. Hemoglobin decreased rapidly during the early phlebotomy period and gradually decreased by the end of study (4.3-5.7 g/dl). Changes in RBC count paralleled changes both in HCT and hemoglobin concentration in all dogs. In 3 of 4 dogs, MCV values were within reference range until 19 days of phlebotomy, and dog no. 2 showed a slightly low MCV (56 fl) until phlebomoty stopped. Since 9 days after phlebotomy 3 of 4 dogs showed hypochromia and MCHC decreased below the reference range on appro- ximately day 17 in all dogs (Fig. 2). Before the phlebo- tomy, hematologic values for all dogs were within reference ranges, except for a slightly low platelet count (174
×10
3/
µl ) in dog no. 1 (Fig. 3). On most sampling days, platelet counts were within the reference range in 3 of 4 dogs; dog no. 1 showed thrombocyto- penia on days 19, 23 and 37.
Fig. 3. Sequential changes of platelet parameters in 4 phlebotomy dogs (P1 to P4).
Fig. 2. Changes of mean corpuscular volume and mean
corpuscular hemoglobin concentration after phlebotomy in
4 dogs.
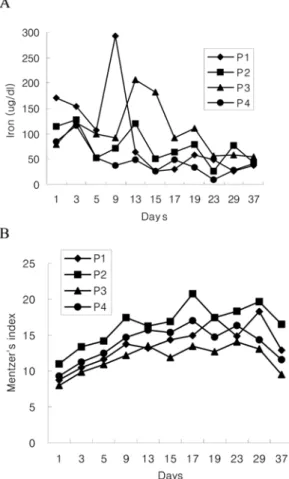
Reticulocytosis occurred in 3 of 4 dogs as early as 5 days after phlebotomy and persisted throughout the blood removal period (Fig. 4). Dog no. 1 showed a reticulocytosis 9 days after phlebotomy. Serum iron concentration decreased rapidly on day 17 in 3 of 4 dogs and dog no. 4 in the very early phelobotomy period.
The iron values were remained low level (10-37
µg/
dl) during the remainder of the phlebotomy period (Fig.
5). Three of 4 dogs showed a Mentzer’s index of greater than 13.5 in 9 days after phlebotomy. The RDW should
a high normal during the 15 days after phlebotomy, and slightly increased since then.
With apparently increased erythrocyte hypochromia, the majority of abnormal RBCs were target cells and occasional stomatocytes, dacrocytes, elliptocytes, knizocytes and schistocytes. Morphologic changes became apparent since day 29 and were most prominent on day 37.
Discussion
Potential causes of microcytic anemia include chronic iron deficiency, anemia of inflammatory disease, hepatic failure due to hepatic disease or portosystemic shunts in dogs and cats, pyridoxine deficiency, copper deficiency especially in pigs, hereditary elliptocytosis in dogs, dyserythropoiesis of English springer spaniels [17], and drug or chemical toxicities [15]. Of these conditions, iron deficiency is the most common cause of microcytic Fig. 4. Reticulocyte percentage and production index in 4
phlebotomy dogs (P1 to P4). Reticulocyte response was not calculated for the first 2 consecutive days after phlebotomy.
Fig. 5. Iron concentration (A) and Mentzer’s index (B) in
4 phlebotomy dogs (P1 to P4).
hypochromic anemia. But in some breeds of dog RBCs are normally microcytes [3, 12].
In an attempt to allow differentiation of causes of microcytosis, a number of calculations such as RDW [5], Mentzer’s index [21] and the discriminant function [11] have been developed. These calculations have been based on the fact that some anemia is associated with a uniform decrease in RBC size, whereas IDA is associated with a significant RBC size variation due to the concurrence of iron-deficient erythropoiesis and erythropoietin-induced marrow stimulation [4, 28]. The RDW, defined as the SD of the RBC volume divided by the MCV multiplied by 100 is a measure of RBC size variation (anisocytosis). Anisocytosis along with poikilocytosis have long been recognized as morphologic hallmarks of some anemias. A classification of anemias based on the RDW and MCV has been proposed and is of particular interest to clinician in that it allows for discrimination of IDA and other types of anemias [5].
A study from humans [24] reported that RDW with greater than 20 was seen exclusively in iron deficiency.
In the present study, anisocytosis was prominent in 17 days after phlebotomy with some minor variations and persisted throughout the study. Since 29 days of study, all dogs had high RDW, ranging 22.8-36.9%. This was further evidenced by prominent reticulocytosis (> 120
×