```
1. INTRODUCTION
About ninety percent of the total mass of liquid propellant rocket is occupied with liquid propellant, like liquid oxygen for an oxidizer and liquid hydrogen or kerosene for fuel. It is important to predict the consumed quantity of propellant in space mission accurately for economical propellant fuelling and efficient rocket design.
Optimization of the charging mass of liquid propellant makes it possible to load a rocket with additional satellite payload. It is, however, extremely difficult to predict exact consumption of propellant before launching rocket.
Consequently, it is necessary to measure the remaining propellant in space to obtain the actually consumed mass of propellant and this information shall be a very useful data for next rocket design.
There are two major problems which make the measurement of liquid quantity in space difficult:
microgravity and cryogenic temperature. The interface of liquid propellant under microgravity in space becomes uneven and globular unlike that on the ground. This fact makes the usual gauging liquid amount under microgravity impossible. Also, cryogenic condition of the liquid propellant causes thermal stratification or thermally non-equilibrium state in an ullage volume and it influences the accuracy of gauging methods using the gas temperature as the measurement parameter.
Various gauging methods for liquid propellant under microgravity have been studied so far and well
summarized in [1]. Pressure-volume-temperature (PVT) gauging method is one of the most attractive gauging methods due to its simplicity and minimal hardware addition [2, 3]. In principle, this method is to calculate the ullage volume from the gas state equation using the measured temperature and the partial pressure with the injected non-condensable pressurant gas.
When the PVT method is applied to liquid hydrogen and liquid oxygen, uniformity of temperature and well-mixed condition of gas in a storage tank are prerequisite important requirements of PVT gauging method by a conventional uncertainty analysis [2]. Experimental investigation on the ground was conducted with 170 litre liquid nitrogen tank equipped with a liquid pump and a spray system to create near-isothermal condition throughout a tank and the gauging performance of PVT method was achieved within 3% accuracy [3]. The effect of mass flow rate of pressurant gas injection was also studied and the low mass flow injection turned out to be suitable to minimize the disturbance effect of thermally stable condition in a tank [4]. Transient effect of PVT gauging method was investigated and the improved PVT concept which reduced the measuring period remarkably was suggested by applying the discretized analysis considering the instantaneous increment of the pressure and the injected mass of pressurant gas [5].
This paper reports on the experimental results and discussion of PVT gauging method under actual microgravity condition in a parabolic flight. This is the first and unique experiment of testing a PVT gauging Abstract
Measuring an exact amount of remaining cryogenic liquid propellant under microgravity condition is one of the important issues of rocket vehicle. A Pressure-Volume-Temperature (PVT) gauging method is attractive due to its minimal additional hardware and simple gauging process. In this paper, PVT gauging method using liquid nitrogen is investigated under microgravity condition with parabolic flight. A 9.2 litre metal cryogenic liquid storage tank containing approximately 30% of liquid nitrogen is pressurized by ambient temperature helium gas. During microgravity condition, the inside of the liquid tank becomes near-isothermal condition within 1 K difference indicated by 6 silicon diode sensors vertically distributed in the middle of the liquid tank. Helium injection with higher mass flow rate after 10 seconds of the waiting time results in successful measurements of helium partial pressure in the tank. Average liquid volume measurement error is within 11% of the whole liquid tank volume and standard deviation of errors is 11.9. As a result, the applicability of PVT gauging method to liquid propellant stored in space is proven with good measurement accuracy.
Keywords: Pressure-Volume-Temperature gauging method, cryogenic propellant management, mass gauging, microgravity
* Corresponding author: [email protected]
Fig. 1. Composition change of partial pressure in an ullage volume of a liquid propellant storage tank before and after helium pressurization.
method under the microgravity situation in a parabolic flight. The experiment was carried out using liquid nitrogen to simulate the behavior cryogenic liquid propellant. The exceptional experimental set-up and the process for a parabolic flight are also presented.
2. PVT GAUGING METHOD Liquid volume,
V , can be obtained by subtracting the l
gas ullage volume, V , from the total volume of a storage u tank, Vtank.
tank
l u
V =V −V
(1)
The ullage volume is determined when the total gas mass, mtotal, is divided by the density of total ullage gas,
total
ρ , as (2). In a propellant storage tank, the ullage volume is composed of pressurant gas, usually helium, and boil-off gas of liquid propellant. Assuming that these gases are homogeneously mixed and follow Dalton’s Law, the mass and density of helium gas, m and He ρ , can substitute for He those of total gas as (2). Density of helium is calculated by the measured ullage temperature, T , and the partial u pressure of helium, P . He
( , )
total He
u
total He u He
m m
V = ρ = ρ T P (2)
Equation (2) can be further expressed with the properties of helium mass and density in a storage tank during helium injection process as described in Fig. 1 and (3).
f i
u
f i He
m m
V ρ ρ
= −
− (3)
The amount of helium mass change is equal to the supplied mass from a helium supply tank,
,sup
mHe
∆ , as (4).
I t i s d e te r mi n ed fr o m t he me a s ur ed pre s s u re a nd
Fig. 2. Various methods to generate microgravity condition artificially.
temperature change and a known volume of the helium supply tank.
,sup
f iHe He
m −m = ∆m
(4)
Each initial and final state of helium density is obtained by using helium partial pressure and ullage temperature at each state as (5). Helium density is calculated by Refprop fluid property database by NIST (National Institute of Standards and Technology).
, , , ,
= ( , ) ( , )
f iHe f PHe f Tu f f PHe i Tu i
ρ −ρ − (5)
The components of each partial pressure are conceptually illustrated in Fig. 1. It is assumed that the liquid propellant and the ullage vapor in the storage tank become well-mixed and saturated state. Saturation pressure of vapor propellant, P , is then obtained by sat measuring the ullage temperature which is supposed to be the saturation temperature when the tank is in thermal equilibrium. Saturation pressure is equal to the partial pressure of vapor propellant consisting of initial partial pressure,
,
Pv i, and the boiled-off partial pressure, PBOG. Therefore, the partial pressure of helium at each state is determined by subtracting the saturation pressure from the total tank pressure as followings:
, , ,
( )
i sat u i He i v i
P−P T =P +P −Psat(Tu i,) =PHe i, (6)
,
, ,
( )
f sat u f
He i v i
P P T
P P
−
= + +PBOG +PHe,sup−Psat(Tu f, )
, ,sup ,
=PHe i+PHe = PHe f
(7)
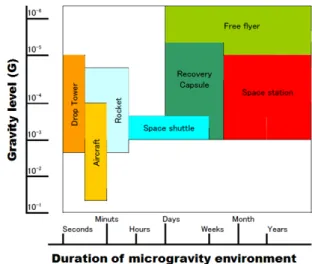
3. PARABOLIC MICROGRAVITY EXPERIMENT Fig. 2 shows various methods to generate microgravity condition with the different gravity level and duration of
Fig. 3. Photo of the airplane MU-300 used in this experiment.
Fig. 4. Variation of flight altitude and acceleration in vertical direction during parabolic flight produced by the aircraft of Diamond Air Service in Japan.
microgravity environment. The methods using a drop tower, an aircraft, and a rocket are practical experimental ways in general. Even though a drop tower is the most economical, since the microgravity condition is only obtained for a few seconds, it is not useful for PVT experiment. Using a rocket is extremely expensive for lab scale experiment. We select a parabolic flight method for this experiment because more than 20 seconds is available as a microgravity condition and this method is economically possible. Japan Space Forum (JSF) coordinates a parabolic flight experimental program for foreign scientists and Diamond Air Service (DAS) in Nagoya provides a practical parabolic flight service. JSF and DAS cooperate with our laboratory for PVT gauging experiment under microgravity.
Fig. 3 shows the photo of aircraft MU-300 which is used for our experiment and Fig. 4 presents a typical procedure of the parabolic flight with MU-300 to induce free fall and microgravity environment.
4. EXPERIMENTAL SET-UP AND PROCEDURE 4.1. Experimental set-up
Liquid nitrogen is chosen to be a representative liquid in this flight experiment to simulate the behavior of cryogenic liquid propellant. Practical cryogenic liquid propellant for Korea space launch vehicle (KSLV) series is liquid oxygen for an oxidizer. Since the density and temperature of liquid nitrogen, 806 kg/m3 and 77.2 K, are similar to those of
(a)
(b)
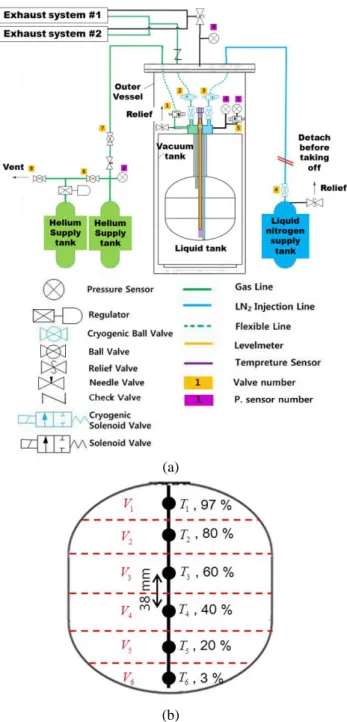
Fig. 5. Schematic diagram of (a) PVT gauging experimental set-up and (b) installation of temperature sensors in the liquid nitrogen storage tank.
liquid oxygen, 1141 kg/m3 and 90.0 K at 0.1 MPa, liquid nitrogen is appropriate substitute for liquid oxygen. Also, oxygen gas is dangerous to support the burning of other substances. It is needed to pass the additional safety procedure and to constitute the more complicated and validated experimental set-up because the experiment is conducted in the air with parabolic flight. The experimental set-up consists of a liquid nitrogen storage tank, an outer vessel for safety, a helium gas supply tank, a liquid nitrogen supply tank, and an exhaust system as shown in Fig. 5(a). The liquid nitrogen supply tank is detached before taking off of the airplane. The liquid nitrogen storage tank is a cylindrical-shaped stainless steel tank with dome cover at the upper and lower sides. The
Fig. 6. Layout of experimental set-up location in the airplane MU-300: Rack B for main experimental set-up with the liquid nitrogen tank and laptop, Rack C for helium supply tanks and electric devices like DAQ, temperature monitor, etc.
geometric dimensions of the tank are 227 mm in height, 250 mm in diameter, and 9.2 L in internal volume. A liquid nitrogen level meter, a liquid nitrogen injection pipe, a helium gas injection and vent line, and a guide rod for temperature sensor installation are located in the tank. The liquid level meter is capacitance-type one (AMI, model 185) with 0.1% accuracy of the total measuring length, 190 mm. Two pressure transducers for measuring high and low range pressure (Delta Metrics, SPA-030P, 35 and 2.1 bara range with 0.25% accuracy) are installed on the top of the tank. Six silicon diode cryogenic temperature sensors (Lakeshore DT-670-SD, ±0.25 K accuracy) are installed vertically to measure the temperature gradient in the tank as shown in Fig. 5(b). All control of fluid injection
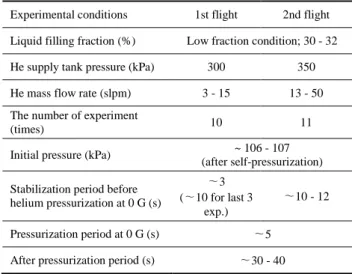
TABLE I
EXPERIMENTAL CONDITIONS OF PVT GAUGING EXPERIMENT. Experimental conditions 1st flight 2nd flight Liquid filling fraction (%) Low fraction condition; 30 - 32
He supply tank pressure (kPa) 300 350
He mass flow rate (slpm) 3 - 15 13 - 50
The number of experiment
(times) 10 11
Initial pressure (kPa) ~ 106 - 107
(after self-pressurization) Stabilization period before
helium pressurization at 0 G (s)
∼3 (∼10 for last 3
exp.)
∼10 - 12
Pressurization period at 0 G (s) ∼5 After pressurization period (s) ∼30 - 40
Fig. 7. Pressure and temperature variation in the liquid nitrogen storage tank during parabolic flight without helium gas injection
or venting is operated with solenoid valves for convenience during the parabolic flight experiment. Relief valves and parallel exhaust system for venting to outside are connected to the storage tank and the outer vessel for safety in the aircraft. Fig. 6 shows the location of the experimental set-up in the airplane. All experimental devices must be fixed or fastened in two designated racks for parabolic flight.
4.2. Experimental procedure and condition
Experimental conditions are shown in TABLE I and the procedure is as follows. Practical moment to measure the remaining liquid propellant is after whole combustion procedure to estimate the quantity of the propellant consumed and to check if there is sufficient propellant is remained for next kick-off phase. Therefore, low liquid fraction after combustion is important condition and liquid nitrogen is filled as 30 ~ 32% for low fraction condition on the ground before taking off in this experiment. Liquid level is also monitored during stable condition before or after parabolic flight in the air. The liquid nitrogen storage tank is fully vented until approximately 100 kPa and closed 2 minutes before microgravity condition because the outside pressure is fluctuated with altitude. The storage tank is self-pressurized up to 106 ~ 107 kPa. When microgravity condition starts, there is a stabilization period without helium gas injection during a few seconds for cooling hot upper side tank wall and achieving near-saturated condition in the tank. After that, helium gas is injected for 5 seconds with various mass flow rates. The storage tank is closed after 30 ~ 40 seconds after helium gas injection until the end of parabolic flight. There have been two flight campaigns for this experiment and each flight accommodates 10 or 11 parabolic flights. Major difference between the 1st and the 2nd flight is the duration of the stabilization period before helium injection. Since the time duration of 3 seconds before helium injection is too short to achieve a saturated condition, initial helium partial pressure cannot be obtained in the experiments of the 1st flight. The preparation period longer than 10 seconds is assigned to the 2nd flight to ensure adequate stabilization period for saturated condition.
(a)
(b)
Fig. 8. Experimental results during parabolic flight with helium gas injection: (a) pressure and temperature variation in the liquid nitrogen storage tank and (b) comparison between the pressure of the tank and saturation pressure from the measured temperature during microgravity condition before helium gas injection.
5. EXPERIMENTAL RESULTS
Entire parabolic flights achieve successful microgravity condition under 3 10× −2 G. Several self-pressurization experiments without helium gas injection are conducted to observe the thermodynamic characteristics of liquid nitrogen in the tank during microgravity condition. As shown in Fig. 7, the tank pressure is rapidly increased when microgravity starts because cold liquid nitrogen crawls up the hot upper wall and evaporation or boiling phenomenon is dominated at this instant in the tank.
Although T1 ~ T4 represent the superheated temperature which is varied between 81 and 115 K before microgravity (they are invisible due to the graph scale), they quickly become saturation temperature and move along the saturation temperature curve several seconds after the microgravity condition begins. T5 and T6 originally indicate saturated or subcooled temperature and they are randomly fluctuated under saturation temperature during microgravity. It means that liquid nitrogen at a lower side of the tank is not well-mixed. We speculate that some liquid exists as compressed liquid state due to abrupt
Fig. 9. Liquid volume measurement error of PVT gauging method using liquid nitrogen under microgravity condition by parabolic flight experiment.
pressure rise and short microgravity duration. Subcooled liquid still dominates the thermal characteristic of the tank and creates transient condition during microgravity at a lower side. After microgravity condition, entire temperatures move along the pressure curve. It implies that the saturated condition in the tank is nearly maintained after a few ten seconds from the initiation of microgravity condition.
Fig. 8 shows a typical example of PVT gauging experiment with helium gas injection during the 2nd flight.
As shown in Fig. 8(a), T2 ~ T4 representing ullage temperature become saturated condition when microgravity begins. The tendency of curves of T2 ~ T4 is similar to the tendency of the saturation temperature curve.
(This tendency is also well-expressed in Fig. 8(b) as saturation pressure) T1 is originally superheated condition because T1 sensor is the nearest sensor to the hot upper wall of the storage tank and becomes dramatically cooled.
T6 keeps stable subcooled condition before helium injection. T5 is not measured by hardware problem in this experiment. Helium gas injection for 5 seconds is performed 9 seconds after the start of microgravity condition. Entire temperature data from the tank after helium injection moves not to be related to the saturation temperature curve due to sudden pressurization by hot helium gas injection. After helium gas injection including microgravity and normal gravity periods, temperatures except T1 move along the pressure and the saturation temperature curve to converge as shown in Fig. 8(a). It implies that the thermal situation in the tank becomes saturated condition qualitatively due to the similar tendency between the measured temperature curves and the saturation temperature curve. Since there is helium partial pressure contribution in the measured total tank pressure after helium injection, temperature discrepancy about 1 K exists between the measured temperatures and the saturation temperature that is calculated by the total pressure. T1 stands for clearly subcooled condition because there can be an evaporation cooling effect. T1 submerges in the saturated liquid and emerge to ullage during parabolic flight and it is the nearest temperature sensor to the hottest wall of the tank. This phenomenon
temperature and the measured total tank pressure due to the helium injection of the previous experiment set. The pressure discrepancy indicates the initial helium partial pressure and it can be calculated by (6). The final helium partial pressure is also calculated by the same procedure with (7). The saturated pressure of liquid nitrogen in the tank which is deduced from the measured temperature varies approximately 5 ~ 10 kPa because it is still unstable, transient, and not completely homogeneous condition due to the limitation of short duration of parabolic flight experiment. This saturated pressure variation is considered as the experimental uncertainty.
Fig. 9 shows liquid volume measurement errors of the PVT gauging experiments performed during the parabolic flight. The liquid volume measurement error is calculated as el =(Vl PVT, −Vl true, ) /Vtank ×100(%). During the 1st flight, the initial helium partial pressure is not considered due to the short stabilization period before helium injection as previously mentioned. It is assumed that there is no initial helium partial pressure and the initial helium density is zero. It causes the overestimated denominator of (3) and the overestimated liquid volume measurement error as shown in Fig. 9 as the injected helium mass is accumulated with the repeated experiments. Measurement errors of the 1st flight are varied from 6 to 47%. During the 2nd flight, longer preparation duration as a stabilization period is allotted without helium injection to ensure initial saturated condition and the initial partial helium pressure can be obtained from (6). The #1 parabolic flight of the 2nd flight is a self-pressurization experiment for cooling hot tank wall and the PVT gauging experiment starts from the #2 parabolic flight during the 2nd flight. The errors of the 2nd flight are reduced from the ones of the 1st flight due to the consideration of initial helium partial pressure. Although we can allow approximately 10 seconds to achieve stable saturation condition in the tank before helium injection, it is extremely difficult to get complete equilibrium condition due to the limitation of short duration of parabolic flight experiment. The average error and the standard deviation of the 2nd flight are 10.9% and 11.9, respectively. These results seem inadequate for real measurement. There are two experimental limits in the parabolic flight: the charged mass limitation of helium gas due to pressure safety and short helium injection duration for approximately 5 seconds. The more the injected helium mass for PVT method is, the more accurate the PVT measurement results become [4]. Consequently, there is
(1) Accurate measurement is achieved within 11%
average at 30% liquid filling fraction when a sufficient stabilization period longer than 10 seconds is assigned before helium gas injection to guarantee saturated condition.
(2) Saturated equilibrium condition is very important to measure the initial and the final helium partial pressures in a storage tank.
(3) Temperature variation due to non-fully homogeneous condition with the limitation of short duration of parabolic flight experiment results in the experimental uncertainty.
(4) It is verified that the applicability of PVT gauging method in a space mission by the experimental results under microgravity condition of parabolic flight.
(5) PVT gauging method is suitable for lunar or deep space exploration program with long microgravity duration in that thermal equilibrium condition is easily obtained in a storage tank.
ACKNOWLEDGEMENT
This research is supported by a grant from Space Core Technology Development Program of National Research Foundation of Korea (NRF-2013-042033) funded by Ministry of Science, ICT & Future planning (MSIP).
REFERENCES
[1] F. T. Dodge, “Propellant mass guaging: Database of vehicle applications and research and development studies”
NASA/CR-2008-215281, 2008.
[2] N. T. Van Dresar, "An uncertainty analysis of the PVT gauging method applied to sub-critical cryogenic propellant tanks,"
Cryogenics, vol. 44, pp. 515-523, 2004.
[3] N. T. Van Dresar, "PVT gauging with liquid nitrogen," Cryogenics, vol. 46, pp. 118-125, 2006.
[4] M. Seo, S. Jeong, Y. Jung, D. Ku and D. Ji, "Experimental research of Pressure-Volume-Temperature mass gauging method using instantaneous analysis under cryogenic homogenous condition,"
Journal of the Korea Institute of Applied Superconductivity and Cryogenics, vol. 14, pp. 38-43, 2012.
[5] M. Seo, S. Jeong, Y. Jung, J. Kim and H. Park, "Improved pressure–volume–temperature method for estimation of cryogenic liquid volume," Cryogenics, vol. 52, pp. 290-295, 2012.