This is an Open Access article distributed under the terms of the Creative Commons Attribution Non-Commercial License (http: //creativecommons.org/licenses/by- nc/4.0/) which permits unrestricted non-commercial use, distribution, and reproduction in any medium, provided the original work is properly cited.
Copyright: © 2018 Korean Journal of Agrcultural Science
https://doi.org/10.7744/kjoas.20180010
ANIMAL
Effects of dietary energy levels on growth performance in lactating sows and piglets
Shuai Qi Huang, In Ho Kim*
Department of Animal Resource and Science, Dankook University, Cheonan 31116, Korea
*Corresponding author: [email protected]
Abstract
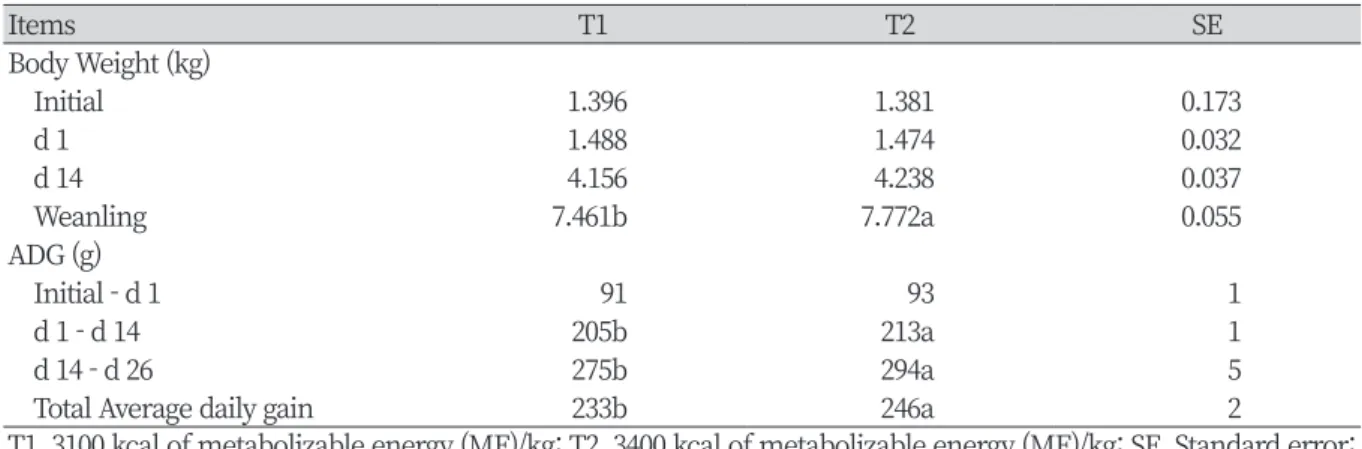
Twenty-five sows and 265 piglets (Landrace × Yorkshire) were used to evaluate the effects of dietary energy level on the pre-weaning and post-weaning performance of piglets and first parity sows. Sows with an average initial B.W. of 217.54 ± 25.47 kg were randomly assigned to 2 treatments. The treatments consisted of a T1 diet containing 3,100 kcal, and the T2 diet contained 3400 kcal of metabolizable energy (ME)/kg, respectively. Data were analyzed using Duncan statements to test the effect of the dietary energy levels on growth performance in lactating sows and piglets. In this study, Dietary T2 sows had a greater number of weaned piglets per litter (p < 0.05). Dietary T2 had a higher (p < 0.05) body weight than that of T1 in the weanlings, meanwhile it had a higher total average daily gain (p < 0.05) than that of T1.
Dietary T1 had a higher average feed intake than that of T2 in gestation and lactation. There were no significant differences on the litter size or litter birth weight. No differences (p > 0.05) were noted in the survival of the piglets as well as in the backfat thickness and body weight loss in sows. In conclusion, these results show that high-energy diets had no effect on the body weight and backfat thickness of sows during gestation and lactation but influenced the body weight and average daily gain of weanling pigs during the lactation period.
Keywords: dietary energy allowance, multiparous sows, piglets, reproductive performance
Introduction
The energy balance of the lactating sow was discussed in detail by the ARC ( 1981 ). The requirement for energy may not always be satisfied either because the management system limits the maximum amount supplied to sows or because of the inability of the sow to consume such quantities of feed . The probable results of either situation are reduced milk yield and excessive loss of body weight and then will influence the growth performance in suckling piglets . Thus , studies on effects of energy supplementation are quite necessary for sows . In 1990s , earlier studies reported effects of different energy supply levels during gestation and lactation on body composition of sows ( Beyer et al ., 1993a ; Park et al ., 2016 ) considering also the growth of conceptus and reproductive tissues ( Beyer et al ., 1993b ; OPEN ACCESS
Accepted: March 5, 2018 Revised: February 8, 2018 Received: August 30, 2017 DOI:
Citation: Huang SQ, Kim IH. 2018.
Effects of dietary energy levels on growth performance in lactating sows and piglets.
Korean Journal of Agricultural Science.
https://doi.org/10.7744/kjoas.20180010
1994a ), on energy and nitrogen metabolism of pregnant and lactating sows ( Beyer et al ., 1994b ) and on litter weight gain ( Jentsch et al ., 1995 ) during suckling in 1st , 2nd , and 4th parity sows . In the 21st century , Beyer et al . ( 2007 ) continued evaluate the effects of energy supply levels during gestation and lactation on milk production and composition in sows of 1st , 2nd , and 4th parity . Also low energy intake during gestation period may increase the risk of being culled due to pregnancy failure ( Kongsted , 2005 ). O ' Grady et al . ( 1973 ) found that birth weights of the piglets were significantly affected by the energy intakes in the previous lactations , being greater for the sows on the higher energy levels . Noblet and Etienne ( 1986 ) found that the ability of sows to mobilize body lipids in order to maintain the output of energy in milk is reduced as body fat reserves are depleted . Indeed , Mahan ( 1993 ) demonstrated that weight at weaning is more important than growth rate post - weaning in determining the time needed to reach market weight . It is therefore imperative to find new management schemes that will increase growth rate of suckling piglets and weanling pigs .
However , prior research in energy supplementation in the diet is still controversial . Further to say , not enough studies have been conducted to evaluate the use of different energy intake from lactating sows to weanling sows . Additionally , we wondered if higher dietary energy levels could reduce stress during lactation or improve sow and piglet growth performances . The objective of this study was to evaluate effects of different energy level on growth performance , backfat thickness , body weight loss , in lactating sows and body weight , average daily gain ( ADG ) in piglet .
Materials and methods
All animals received humane care as outlined in the guide for the care , and use of experimental animals ( Dankook University , Animal Care Committee , Korea ).
Experimental Design, Animals, Housing
A total of 25 multiparous sows ( Landrace × Yorkshire ), which were at 7 days before farrowing , were assigned to two treatments comprising of different dietary energy levels . There were twelve and thirteen replicates per treatment , respectively . This experiment was completed during a 5 - week period from the January to March . Dietary treatments were corn - soybean meal - based diets with the metabolizable energy ( ME ) of 3100 kcal / kg ( T1 ) and 3400 kcal / kg ( T2 ), respectively . The sows were housed individually in 2 . 1 × 1 . 8 m
2farrowing crates with solid concrete floors combined with slats of iron . The temperature in the farrowing house was maintained at a minimum of 20 ° C . Supplemental heat was provided for piglets using heat lamps . Piglets were treated according to routine management practices that included teeth clipping , tail docking , ear notching .
Diets and feeding
From day 108 of gestation until farrowing sows were fed their experimental gestation diets ( Table 1 ). On the day of
parturition , the sows were fed 1 kg / d of their experimental lactation diets respectively . After farrowing , daily feed allowance
was increased gradually until sows had ad libitum access to feed . All diets were provided in meal form twice daily and sows
had free access to drinking water throughout the experimental period . Piglets were provided with creep feed from two weeks
of age . The sow diets ( Table 1 ) were based on corn - soybean meal and were formulated to meet or exceed the nutrient
requirements recommended by NRC ( 2012 ). The metabolizable energy levels were designed at 3 . 10 Mcal / kg and 3 . 40 Mcal /
kg according to the guide .
Sampling and measurements
Individual sow was weighed and scanned for back fat thickness at day 108 of gestation , the day after farrowing and at weanling ( 26 - 29 d ) to determine weight and back fat thickness loss . The back fat thickness of the sows ( 6 cm off the midline at the 10th rib ) was measured using a real - time ultrasound instrument ( Piglot 105 ; SFK Technology , Herlev , Denmark ). The feed consumed during the gestation and lactation periods was recorded for each sow to calculate average daily feed intake . After farrowing , daily feed allowance increased 1 kg / day until day 6 postpartum , and then sows were given ad libitum access to feed and water .
During the experimental period , individual piglets were weighed within the first 24 h of farrowing as well as at weaning ( 26 - 29 d ). The numbers of piglets alive and death per litter were recorded to calculate survival ratio . To guarantee that all sows nursed a similar number of piglets , litter sizes were adjusted by cross - fostering piglets within 24 h of birth ( Zhou et al ., 2012 ).
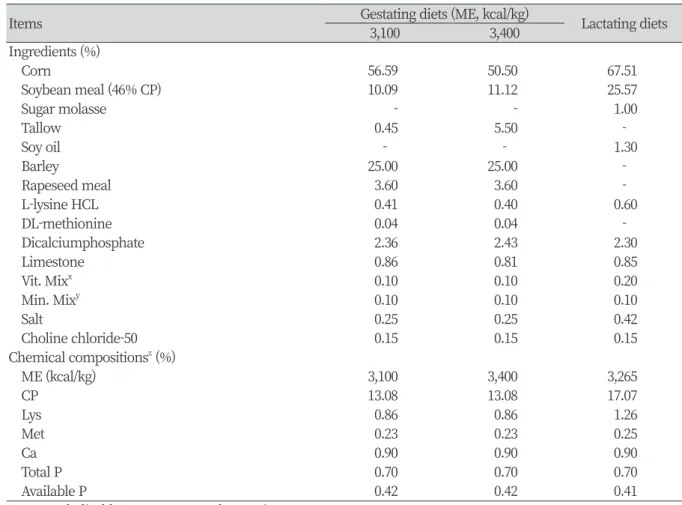
Table 1. Formula and chemical composition of gestating and lactating diets (%).
Items Gestating diets (ME, kcal/kg) 3,100 3,400 Lactating diets
Ingredients (%)
Corn 56.59 50.50 67.51
Soybean meal (46% CP) 10.09 11.12 25.57
Sugar molasse - - 1.00
Tallow 0.45 5.50 -
Soy oil - - 1.30
Barley 25.00 25.00 -
Rapeseed meal 3.60 3.60 -
L-lysine HCL 0.41 0.40 0.60
DL-methionine 0.04 0.04 -
Dicalciumphosphate 2.36 2.43 2.30
Limestone 0.86 0.81 0.85
Vit. Mix
x0.10 0.10 0.20
Min. Mix
y0.10 0.10 0.10
Salt 0.25 0.25 0.42
Choline chloride-50 0.15 0.15 0.15
Chemical compositions
z(%)
ME (kcal/kg) 3,100 3,400 3,265
CP 13.08 13.08 17.07
Lys 0.86 0.86 1.26
Met 0.23 0.23 0.25
Ca 0.90 0.90 0.90
Total P 0.70 0.70 0.70
Available P 0.42 0.42 0.41
ME, metabolizable energy; CP, crude protein.
x
Provided per kg of diet: Vit. A, 10,000 IU; Vit. D
3, 1,500 IU; Vit. E, 35 IU; Vit. K
3, 3 mg; Vit. B
2, 4 mg; Vit. B
6, 3 mg;
Vit. B
12, 15 μg; pantothenic acid, 10 mg; biotin, 50 μg; niacin, 20 mg; folic acid 500 μg.
y
Provided per kg of diet: Fe, 75 mg; Mn, 20 mg; Zn, 30 mg; Cu, 55 mg; Se 100 μg; I, 250 μg; Co, 250 μg.
z
Calculated value.
Statistical analyses
All experimental data were analyzed using the GLM procedure of SAS version 8 . 2 ( SAS Inst . Inc ., Cary , NC , USA ) as a randomized complete block design according to their body weight ( BW ). The sow or litter of piglets was used as the experimental unit . The analysis of sow backfat thickness and change during lactation used fat depth at farrowing as covariates . Piglet birth weight was used as covariates for weaning weights during lactation . Lactation length was used as a covariate for piglet survivability , sow and piglet weaning weight , sow feed intake , and backfat thickness depth change . Duncan ’ s multiple range test , and a probability level of p < 0 . 05 was regarded as statistically significant . Variability in the data was expressed as standard error .
Results and Discussion
Growth performance in lactating sows
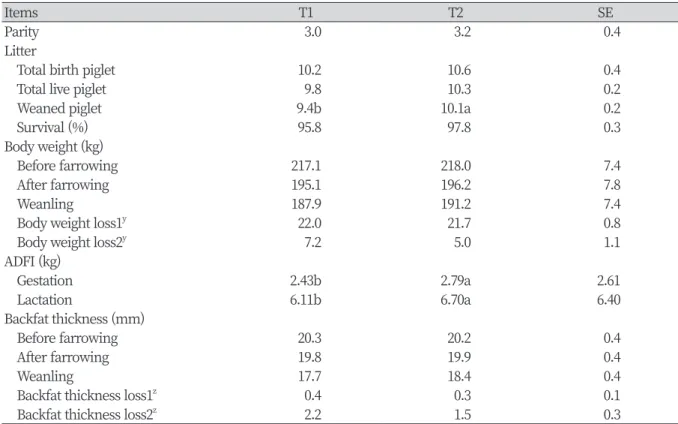
In this study , Dietary T2 sows provide more number of weaned piglets per litter ( p < 0 . 05 ) among dietary treatments ( Table 2 ). During gestation and lactation , the average daily feed intake ( ADFI ) in T1 treatment were greater ( p < 0 . 05 ) than sows fed the T2 treatment . There were no significant impacts observed on total birth piglet , total live piglet , body weight , and backfat
Table 2. Effect of different dietary energy levels in lactating sows.
Items T1 T2 SE
Parity 3.0 3.2 0.4
Litter
Total birth piglet 10.2 10.6 0.4
Total live piglet 9.8 10.3 0.2
Weaned piglet 9.4b 10.1a 0.2
Survival (%) 95.8 97.8 0.3
Body weight (kg)
Before farrowing 217.1 218.0 7.4
After farrowing 195.1 196.2 7.8
Weanling 187.9 191.2 7.4
Body weight loss1
y22.0 21.7 0.8
Body weight loss2
y7.2 5.0 1.1
ADFI (kg)
Gestation 2.43b 2.79a 2.61
Lactation 6.11b 6.70a 6.40
Backfat thickness (mm)
Before farrowing 20.3 20.2 0.4
After farrowing 19.8 19.9 0.4
Weanling 17.7 18.4 0.4
Backfat thickness loss1
z0.4 0.3 0.1
Backfat thickness loss2
z2.2 1.5 0.3
T1, 3100 kcal of metabolizable energy (ME)/kg; T2, 3400 kcal of metabolizable energy (ME)/k; SE, Standard error;
ADFI, average daily feed intake.
y
Body weight loss: 1, before farrowing to after farrowing; 2, after farrowing to weanling.
z