- 41 -
벵갈만 지역의 컨테이너항만 효율성 분석에 관한 연구
태태쩌뉸*⋅김현덕**
A Study on the Efficiency of Container Ports in the Bay of Bengal Area
Htet Htet Kyaw Nyunt*⋅Kim Hyun Deok**
Abstract
This study aims to investigate the technical efficiency of major container ports in the Bay of Bengal area and to study how certain factors influence the efficiency of container ports and terminals. The research is conducted on the four main container ports in the Bay of Bengal area, namely, Colombo Port in Sri Lanka, Chennai Port in India, Chittagong Port in Bangladesh, and Yangon Port in Myanmar. There are three input variables (quay length, storage area, and the num- ber of cranes) and two output variables (throughput twenty-foot equivalent units and vessel calls) chosen for the process in this study. This paper evaluates the efficiency score of the defined varia- bles and suggests implications for further improvement of the core competitiveness of the four se- lected ports. The findings indicate that Colombo Port is the most efficient on a technical scale, fol- lowed by Chennai Port, Yangon Port, and Chittagong Port. However, the slack and radial move- ment calculation results show that the inputs and outputs of the four ports need to be adjusted to be efficient and to reduce the amount of resources that are wasted. The results validate the adapt- ability of the improved data envelopment analysis algorithm in port efficiency analysis. The research findings provide an overview of the efficiencies of the selected container ports and can potentially affect the port management decisions made by policymakers, terminal operators, and carriers.
Key words: Efficiency, Data Envelopment Analysis, Container Ports, Bay of Bengal, Technically
▷ 논문접수: 2019. 12. 17. ▷ 심사완료: 2020. 03. 20. ▷ 게재확정: 2020. 03. 25.
* 순천대학교 물류학과 박사, 제1저자, [email protected]
** 순천대학교 물류학과, 교수, 교신저자, [email protected]
Ⅰ. Introduction
The container port traffic is fluctuating over the past decade. The long-term trend of this growth pattern is expected to continue. Container trade is a major part of seaborne and merchandise trade. Manufacturers are also integrated into the global network and choose the cheapest route to deliver the product to the customer. The growth of supply chain network result in increased in the container port traffic. The faster growing rate of container trade is also another factor for in- crement in port traffic. The first internationally standardized container was started in 1960s and the container trade has developed continuously.
The role of the Bay of Bengal in the world shipping route is quite important since it is the world’s largest bay which emerges as the strate- gic and economic hub in the Indo-Pacific region.
There are many studies which have identified the influencing factors of the port performance as well as the efficiency. However, the comparative study for the port efficiency of the inner part of Bay of Bengal are quite few. The requirements to quantify the relative contributions of port effi- ciency is to be filled. This study is conducted to establish how efficient the ports are compared to the resource they have. Regarding the data col- lected from the four DMUs(Decision Making Units), this study tends to provide the empirical basis for the crucial role of the port efficiency relative to other factors in the overall port performance. This paper aims to investigate the technical and scale efficiency of major container ports in the Bay of Bengal area through DEA(Data
Envelop Analysis), Colombo Port in Sri Lanka, Chittagong Port in Bangladesh, Channai Port in India and Yangon Port in Myanmar and to study how certain factors influence the efficiency of container ports and terminals.
The objectives of this paper is to investigate the technical and scale efficiency of major con- tainer ports in the Bay of Bengal area through DEAP(Data Envelop Analysis Program), Colombo Port in Sri Lanka, Channai Port in India, Chittagong Port in Bengladesh and Yangon Port in Myanmar and to study how certain factors influence the efficiency of container ports and terminals. A pi- lot survey was carried out to know the feasibility of the large study. The deficiencies found during pilot survey are attempted to address before the main study. A pilot study provides limited in- formation compared to large scale study but still it gives the vital information on the magnigude of variation of response measures.
II. Literature Review
DEA is the efficiency calculation was in- troduced by Farrell (1957) and later modified by Charnes, Cooper and Rhodes(1978), This model allows for a comparative analysis of processes characterized by different scales and enables the rankings or benchmarking as per the perform- ance criteria. It is based on linear programming which converts the input and output variables to measure the efficiency of the DMUs(Decision Making Unit). It is a non parametric method for the esti- mation of production frontier.
Clark et al.(2004) said that the port efficiency
is the important determinant in the seaborne transportation. The port efficiency is propor- tionate to the total square number of the largest seaports in a country and the country’s Gross Domestic Product. Clark(2004) concludes that the 25-75% of the port efficiency can be improved through the infrastructure development. The out- put of container ports is measured by the throughput. Comin and Hobijn (2010) mentioned that effectiveness of each transportation system is remarkably different while the freight railways 79 years, cars 44 years, freight aviation 42 years, trucks 35 years to have impact on the half of the countries but the containerization took only 20 years. The port which have bigger number of throughput can be said as more productive than which does not. Throughput is useful while cal- culating in DEA and SFA(Stochastic Frontier Analysis) to measure the relative technical and scale efficiency (Cullinane, 2002; Cullinane and Song, 2006). mentioned the DEA method cannot discriminate the efficient DMUs but Andersen and Petersen (1993) constructed a super-efficiency DEA model and addresses the insufficiency of CCR-DEA model developed by (Charles, Cooper
& Rhodes, 1978). Therefore, DEA models can be constant returns to scale (DEA-CCR) or variable returns to scale (DEA-BCC and FDH). And it can be divided into input oriented or output oriented. The input-oriented models minimize the resources used without changing the production level, and output-oriented models aim to improve products without modifying the resources used.
The basic premise of DEA is the homogeneity of the DMUs which means that all of the units
perform similar activities and produce outputs in comparable scales. The traditional DEA optimizes the efficiency score of each DMU, compare the resource and construct the efficient frontier. The other units apart from efficient frontier are re- garded as inefficient. The essence of DEA mod- els is to maximize the efficiency rate which is al- ways described with the value under 1. The weight of all the input and outputs are greater than zero. To calculate DEA, the population of a productive units shall be firstly defined as DMU1, DMU2, …, DMUn. While each productive unit produce s output with m input consumptions.
The input matrix X and output matrix Y can be written as follows:
X = [xij, i = 1, 2, …, m, j= 1, 2, …, n] and Y = [yij, i = 1, 2, …, s, j= 1, 2, …, n].
The q-th line of those matrix for unit DMUq can be expressed as
=
where: vj, j = 1, 2, …, m, are weights as- signed to j-th input,ui, i = 1, 2, …, s, are weights assigned to i-th output.
u = no of outputs v = no. of inputs
vu = j,j = 1, 2, …, m, are weights assigned to j-th input,
ui,i = 1, 2, …, s, are weights assigned to i-th output.
The calculation of the efficiency through DEA is started with the productive units from the overall population, DEA calculates the rate of utility for the given inputs or the required outputs. The input and output are weighted first and the rating reveals. The implication can be drawn from the results in serial from. The effi- cient and inefficient DMUs are defined and the later ones are targeted to modify until the target value of efficiency is fulfilled. Traditionally, the calculation of radial measures of efficiency is done in input orientation method. It is to mini- mize the resource for the same output amount.
In bootstrapped DEA, the simulated data set is similar to the original and the results are con- cluded through sampling distributions and stand- ard deviations. The bootstrapped DEA method was developed by Simar and Wilson(2000) to overcome the constraints of former DEA which is being overly sensitive on the sampling. The Bootstrap-DEA has been recognized as a mile- stone in the international world for measurement of relative efficiency and productivity. The sam- pling distributions are approximated using Monte Carlo simulation. The random nature of this method allow the results data to be comparable with the data obtained from SFA(Scholastic Frontier Analysis) method. The fundamental calcu- lation theory of Bootstrap DEA can be given as follows:
Bias(θ^k)=E(θ^k)−θ^k.
Bias(θ^k)=B−1∑b=1B(θ^*kb)−θ^k.
The bias corrected efficiency score can be ex-
pressed as follows:
θ~k=θ^k−Bias(θ^k)=2θ^k−B−1∑b=1B (θ^*kb).
The confidential interval can also be calculated as follows:
Pr(−b^r≤θ^kb*−θ^k≤−a^α)=1−α.
Pr(−b^α≤θ^k*−θ^k≤−a^α)=1−α.
θ^k+a^α≤θ^k≤θ^k+b^α.
The estimated efficiency scores is calculated through numerous repeated sampling and the confidential intervals is defined. Later, the DEA- BCC model was developed based on that by Banker, Charnes, and Cooper(1984).
The BCC model allows DMUs to operate with lowe levels of inputs but increase the returns of scale but those high levels of inputs can also have decreasing returns of scale. However, in ef- ficiency analysis, variable returns to scale can al- so be considered. In that case, models(3) and (4) need to be rewritten to include a condition of convexity eTλ = 1. Afterwards, they are re- ferred to as BCC (Banker, Charnes, Cooper) models.
To measure the capacity, the variables are used as the fixed factors. The input oriented DEA is less relevant to estimate the capacity utilization. However, the modifications can be done to the traditional input oriented DEA model to make changes in the input to get the desired output level. In output-oriented DEA, the linear programme determines the firm's favourable out-
put based on the given input. It estimates the potential output for the given set of inputs and it measures the capacity utilization either (Färe, Grosskopf and Lowell, 1994).
The multiplier for firms having variable re- turns to scale is never 1. Competitive business environment have the firms which has higher rate of returns to scale. The multiplier is greater than 1 and for decreasing returns is less than 1.
The levels of change in output with respect to changes in input levels are measured by return to scale concept.
Technical efficiency is a measure which can be improved over time through better allocation and the use of different inputs. It is used to evaluate relative productivity over time, space, or both. The scale efficiency of the production unit can be measured whether the size of operation is optimal so that any modification on the size will render the production unit less efficient. The value of scale efficiency is to divide the aggregate efficiency divided by the technical efficiency.
Liu(2010) studied the efficiency analysis of 32 container ports in the North Mediterranean Sea and 165 container ports and terminals worldwide.
The findings revealed that 90% of the container ports have a technical efficiency lower than 0.80, 95% of container terminals have a technical effi- ciency lower than 0.80. For scale efficiency, 40%
of ports have scale efficiency larger than 0.8 and 80% of terminals have a scale efficiency larger than 0.80. The research concludes that trading volume is the significant factor to define the efficiency. Even though the annual increment of port output is slower than the expected, the
container terminals are more productive than multi-purpose terminal. Under the same circum- stances of the country, the local terminal oper- ators are as good as global terminal operators in providing service. It was also found that the container terminal operation industry is over-scaled. In general, it can be concluded that the low technical efficiency values and high scale efficiency values indicate that there is sufficient input level. Any deviation form the frontier shows the inefficiency.
The implication is that more container termi- nals to be adapted to meet growing market demand. The paper examined the impact on production and efficiency on three factors, the trade volume, terminal type and the operator type. The assumption is that they influence the production and technical efficiency directly. The analysis indicates that the influence of trading volume on the production of container ports is more significant than the technical efficiency.
Susila (2011) studied about the benchmarking the efficiency of 69 Asian container ports using DEA(Data Envelopment Analysis) technique. The results rank the efficiency rate of the ports against each other. The results indicate that the average technical efficiency of the Asian contain- er ports is 48.4% and such inefficiency is due to technical rather tan scale inefficiency. Susila(2011) suggests that the ports must enhance the han- dling activities through computerized system ad to improve scale efficiencies. 48% of the ports are increasing returns to scale . The scale of oper- ations can further be expanded via building alli- ances within shipping organizations.
Since about 35% of the container ports are de- creasing returns to scale, they can maintain it by giving up some of the terminal assets and opera- tional functions to other specialized private entities. The efficient handlings and transit of containers will promote intra-port competition.
The analysis support that the container ports in China plays a clear lead in the Asian lead as per handling capacity. Susila(2011) concludes that the size and the ownership are not the determinants of efficiency level in the container ports.
Cullinance (2006) analyses the relevance of Data Envelopment Analysis (DEA) to the estima- tion of productive efficiency in the container port industry.
An analysis reveals that container port effi- ciency fluctuates over time and it suggests that there are some substantial waste in container port production. The sample ports involved in the survey exhibit a mix of decreasing, increas- ing and constant returns to scale. Culliance (2006) said the DEA results might not be achiev- able in reality, because each individual port has its own specific and unique context. More sin- gular aspects of individual ports should be inves- tigated to determine the efficiency levels.
Vincent(2001) conducted a measurement study on the port efficiency through data envelopment analysis.
The paper investigates the port efficiency on both the private and state owned ports. The pa- per seeks to determine whether the ownership defines the efficiency of the port or not. The use of DEA to test the efficiency helps to high- light the characteristics of an efficient port.
The results indicate that the more simple or- ganization structure, the more efficient in the operation. Organizational restructuring of an in- efficient port shall be done to improve port effi- ciency but the most important fact is to be ro- bust and reflective to changing demand.
Hong(2015) measures the port efficiency of 43 largest ports in Vietnam with bootstrapped DEA.
The results of bootstrapped DEA, stochastic fron- tier analysis (SFA) and standard DEA are com- pared and the findings show 3 implications. The first finding is that the efficiency scores produced by bootstrapped DEA are consistent, unbiased, and not sensitive to the sample size while the standard DEA and SFA yield much larger effi- ciency scores. Second, the main weakness of the standard DEA method is it is sensitive to the variables and unable to account for the random variables which tend to result in statistical inconsistency. Thirdly, the bootstrapped DEA method is consistent and bias-corrected. The tra- ditional DEA and SFA are not directly com- parable, becausethey are based on very different approaches. Furthermore, There is a considerable opportunity for Vietnamese ports to improve the operational efficiency and contribute to Vietnam’s international competitiveness andtrade performance.
Danijela(2012) conducted a DEA Window Analysis for Measuring Efficiencies in five Ports along the Danube river, Serbia. The panel data is used to calculate the port efficiency in DEA method. The input data are composed of the to- tal area of warehouses, quay length and number of cranes while output data include port through-
put per year. The average ef efficiency in all ports is below 100% under two main reasons for inefficiency which are less transshipment cargo and poor facilities. Daniiela(2012) suggests that it is important to examine the strategic plan to im- prove the port operation.
Sharhar(2017) conducted the analysis of port efficiency using imprecise and incomplete data.
The missing or imprecise data are replaced by interval or ordinal data which are properly esti- mated using auxiliary data. The iterative proce- dure is developed to estimate the new interval bounds that turn non-efficient ports into efficient and access the efficiency of the sample port.
Polyzos(2013) evaluates the efficiency of ports in Mediterranean Sea. The aims of the study is to conduct the comparative study on the effi- ciency of the ports in the Mediterranean. The potential of each port in the era of larger con- tainer volumes attraction display significant ach- ievement in transhipment movement. The results indicate the functional inefficiencies of the ports, to be qualitative on the safe transportation of containers. The diversification of factors of pro- duction in the various kinds of cargo transport in Mediterranean is functionally inefficient. Through its exploitation from the port management, the survey contributes to the improvement of the port efficiency to enrich the new variable factors of port functions.
Yuki (2018) evaluated the competitiveness of port logistics through DEA. The DEA algorithm model is constructed as per the principal compo- nent analysis method. The efficiency value of Shenzhen port logistics competitiveness from
2012 to 2016 is measured. The results show that the input and output of Shenzhen port in 2015 and 2016 are unreasonable, and there is a waste of resources. The analysis index system of Shenzhen port logistics competitiveness includes five first level indicators and seventeen second level indicators which comprised of port logistics operating conditions, port logistics development environment, port logistics infrastructure con- ditions, port logistics service level and the poten- tial of port logistics development period.
Alexandra (2018) also conduct the efficiency of 44 container ports in Brazil through a DEA and FDH approach. The evaluation will first proceed by identifying the main benchmarks to get the variables which has affect on the technical efficiency. The relationship between the container movement and specialized terminals are also found out. Together with Data Envelopment Analysis, Free Disposal Hull Output-oriented mod- els is also used with three inputs - berth depth, berth length and number of berths to produce three outputs, number of throughput, mooring per hour and medium consignment rate meas- ured in container throughput per ship. The re- sults show that 50% of the terminals have an in- efficient infrastructure in which shortage of ca- pacity to meet the current demand. There is a strong relationship between the efficiency and size of a terminal port and between the effi- ciency and degree of specialization.
Hanaa(2016) conducted a study about the effi- ciency Assessment of Jazan Port based on DEA with the input factor of port imports, discharged vessels, number of berths and the output factor
of port outputs and loaded vessels. The scope of the study is to evaluate the efficiency scale of 9 main ports in the Saudi Arabia. The results show that Jazan port is inefficient compared to other ports in the sample. There is a requirement for the ports to develop as per the market demand, to increase the income and employment rate.
Based on the theoretical background and the lit- erature review, the conceptual framework is de- veloped as follows:
Step 1: Define Vairables & DMUs
Step 2: Collect Sample Data from the Original Data Set of DMUs as per defined
Step 3: Calculate DEA Technical and Scale Efficiency Score
Step 4: Review the Efficiency Score, Peer Summary and Benchmark
Step 5: Conclude Implications as per the Radial and Slack Movements to Meet
As mentioned above, there are many studies conducted for the effectiveness of the container ports. But most of them are for the hub/trans- shipment ports and not included the comparison with the other ports located in the inner part of the bay of Bengal, especially the Yangon and Chittagone port.
The present study explained the operational indicators like cargo throughput. In order to ex- amine the efficiency of ports a period of ten years (2007 to 2017) has been considered for this study. The analysis during this time period helps in evaluation of long-term impact of the above policy measures.
Ⅲ. Data Description and Methodology
The choice of particular variables are made under the scope of which area to investigate among the different determinants of port performance. Port performance is usually meas- ured with location, performance, cost and effi- ciency, etc. This paper focus on the measure- ment of efficiency but excludes the other factors.
The three variables of port storage area, quay length and the number of cranes are measured.
Storage utilization is calculated by comparing the number of storage slots occupied with the total number of available slots according to the yard’s design capacity. Container storage area is required to receive the cargo, store, retrieve, packing and shipping but exclude the office area. Both the covered and open storage areas are counted. The racks, hazardous area and free port zone are also not included. The amount of storage facility vary upon the warehouse area and the arrangement of racks. That include the transfer and store within port area in case of no direct ship-to-ship loading or transferring cargo out of the port area on rail/road vehicles.
Another chosen input is quay length.
The quay utilization is one of the criteria to measure the amount of time that the berth was occupied out of the total time available. The quay length is crucial to the efficiency of the ports to receive the different types of ships so that the amount of throughput differs because of that. River ports are smaller than seaports and the quay length corresponds to it. The ships call to such port are literally smaller size than which goes to seaports. The aim of the shipping com- pany is to reduce the ships turnaround time, the quay length matters to attract the clients.
The other important factor is the number of crane. Because the terminal’s investment in car- go-handling equipment is very costly, equipment utilization is also chosen as one of criteria in this paper. The service rate significantly depends on the number of quay cranes. The flexibility of the port to work with many vessels depend on the crane availability also. The loading/unloading speed of cranes minimize the time taken to serve more vessels. The overall time the vessel spent at the port is significantly relied on the crane productivity.
DEA calculates the utilization of any item or type of equipment on the proportion of time that it and give the summary about how the re- source are effectively deployed over a specified period.
The time frame counted in this study is from 2010 until 2017 and did not considered the var- iance of measurements out of that period. The the size of port is considered as a constant in the medium-term interval. The investment factors are as mentioned in the government website
only.
There are many ports located around the Bay of Bengal but the scope of this paper restricts to the main port in the inner bay of Bengal.
This includes the Colombo Port in Sri Lanka, Channai Port in India, Chittagong Port in Bangladesh and Yangon Port in Myanmar.
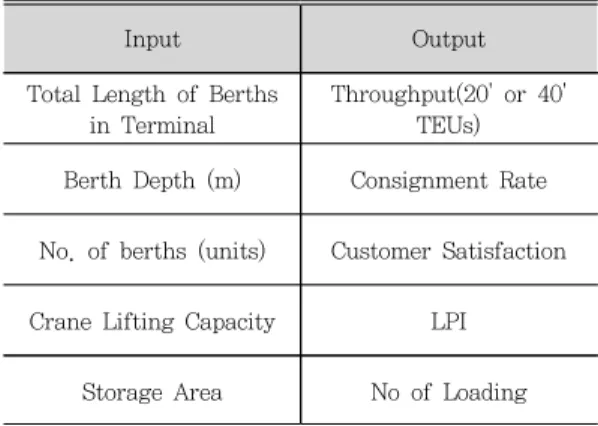
Table 1. Sample Input and Output Variables
Input Output
Total Length of Berths in Terminal
Throughput(20' or 40' TEUs) Berth Depth (m) Consignment Rate
No. of berths (units) Customer Satisfaction
Crane Lifting Capacity LPI
Storage Area No of Loading
For sample selection and data source, the vari- ables are evaluated based on the consistent avail- ability of the data. Facilities is the main basis for comparison of container terminals in relation of their size or scale and the magnitude of invest- ments at the port. It has been widely used to evaluate the technical efficiency of ports. Some variables used which can be used in measuring port efficiency are the number of cranes, number of berths, number of employees, terminal area, and the available equipments or the facilities are the input and throughput handled and vessel calls are the output. The input can mean for the entire port or for each specific terminal and the output includes the sum of two or more types of cargo.
Variables are the most analytically tractable in- dicator of the productive efficiency of a port.
The average productivity of each terminal com- pared to the time of berthing of ships is taken as service time. That can be as large as possible because the decrease in berthing time and an in- crease in cargo handling units result in less cost and increase the number of vessels to handle. It generates more revenue for the ship companies and the port operator.
For instance, the consignment rate indicates the average size of a ship arrived at the con- tainer terminal. It measure the total number of unit of containers moved by the number of ships. The higher the rate, the lower the cost of port services for a higher capacity ship. The less time would be spent for berthing and load- ing/unloading of goods, the larger quantity of goods can be distributed. Optimizing the port in- frastructure is important to increase amount of cargo to handle over time under the available berths.
After resource allocation in the setting of input and output setting for DMUs, the organization has to define the target for outputs too. It plays a pivotal role for DMUs because the efficiency is measured on those determinants only.
In this paper, there are two outputs which is the throughput TEUs and the vessel calls. The selected four ports have different number of tar- get output for each year as per the input availability.
The DMUs defined in this study does not mean only for the port as a whole but for the specific terminals too. Because of the scarce of
information for each terminal, the whole port is taken as a whole but the data for each terminal is not mentioned separately.
Furthermore, the number of DMUs does not matter to compare the number of variables when the technical efficient DMU is efficient with ߳DF(Degree of Freedom) in inputs and out- puts(Khezri motlagh D et al. (2012).
max
where,
i and n= non negative input of DMUs, i
= 1,2,...,n)
j and m = non negative output of DMUs,j
= 1,2,...m)
≥ max where,
n = number of DMUs, m = number of inputs and s = number of outputs
The number of degree of freedom will in- crease with the number of DMUs and decrease with the number of inputs and outputs.
Ⅳ. Empirical Results
This paper analyzes the efficiency of four con- tainer ports in Bay of Bengal, Colombo Port in Sri Lanka, Channai Port in India, Chittagong Port in Bangladesh and Yangon Port in Myanmar.
There is no single measure that can sum up all the important aspects of port or terminal
performance. The two variables (Throughput TEUs and vessel calls) are taken as output and the three variables (quay length, storage area and the number of cranes) are counted as input.
First of all, the general information of the ports in the selected four countries can be seen as fol- lows:
Table 2. Comparison of Terminal Facilities Description Port 1* Port 2* Port 3* Port 4*
Quay Length (m) 4,822 2,540 8,717 3,775 Cranes(Quay
Cranes+RTG, Roll Mounted)
91 61 40 34
Storage Area (, excludes liquid storage area)
800,000 432,239 736,686 602,171
World Port Ranking
(2018) 24 70 99 -
LPI 94 100 44 137
* Port 1: Colombo, Port2: Chittagong, Port 3: Channai, Port 4: Yangon
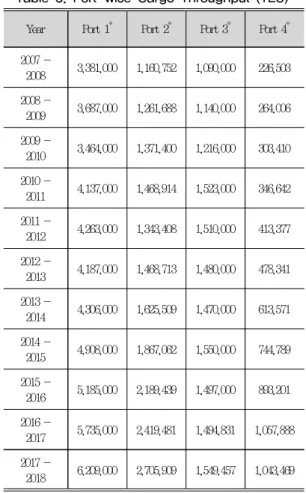
Table 3 and 4 describes the two output values for the 10 consecutive years from 2007 until 2018.
As per the data from port authority of each coun- try, India has the highest number of TEUs (13,259,000) compared to the other country fol- lowed by Sri Lanka(6,000,000), Bengaldesh (2,587,000) and Myanmar (1,070,343) respectively.
However, the TEU for each selected port is a bit varied since India is very wide and the average data does not represent the throughput of Channei port.
Colombo has the highest TEU with 6,209,000 followed by Chittagong (2,705,909), Channei (1,549,457) and Yangon Port (1,043,469)
respectively. The detail cargo throughput of each port is described in Table 2.
Table 3. Port-wise Cargo Throughput (TEU)
Year Port 1* Port 2* Port 3* Port 4* 2007 -
2008 3,381,000 1,160,752 1,090,000 226,503 2008 -
2009 3,687,000 1,261,688 1,140,000 264,006 2009 -
2010 3,464,000 1,371,400 1,216,000 303,410 2010 -
2011 4,137,000 1,468,914 1,523,000 346,642 2011 -
2012 4,263,000 1,343,408 1,510,000 413,377 2012 -
2013 4,187,000 1,468,713 1,480,000 478,341 2013 -
2014 4,306,000 1,625,509 1,470,000 613,571 2014 -
2015 4,908,000 1,867,062 1,550,000 744,789 2015 -
2016 5,185,000 2,189,439 1,497,000 893,201 2016 -
2017 5,735,000 2,419,481 1,494,831 1,057,888 2017 -
2018 6,209,000 2,705,909 1,549,457 1,043,469
* Port 1: Colombo, Port2: Chittagong, Port 3: Channai, Port 4: Yangon
The vessel calls of each port is also presented in Table 4. Colombo has the highest vessel call with 6209 followed by the Chittagong(2566), Yangon (2667) and the Channei(1549) for the year of 2017-2018. Colombo and Chittagong port have always got the highest vessel calls com- pared to other ports in the inner side of the Bay of Bengal Area.
Table 4. Vessel Calls at Each Port Year Port 1* Port 2* Port 3* Port 4* 2007 - 2008 3,415 946 1,295 l,293
2008 - 2009 3,555 962 1,301 1,289
2009 - 2010 3,531 947 1,255 1,598
2010 - 2011 3,717 890 1,388 1,775
2011 - 2012 4,124 938 1,455 1,833
2012 - 2013 3,870 1,845 1396 1,793
2013 - 2014 4,306 1,540 1,470 1,891
2014 - 2015 4,908 1,622 1,550 2,002
2015 - 2016 5,185 2,024 1,565 2,075
2016 - 2017 5,734 2,346 1,495 2,016
2017 - 2018 6,209 2,566 1,549 2,667
* Port 1: Colombo, Port2: Chittagong, Port 3: Channai, Port 4: Yangon
To present the efficiency of the output, the slack movement and peer count summary are presented.
The Colombo, Chittagong, Channei and Yangon Ports are defined as DMU 1,2,3 and 4.
Table 5 and 6 presents the slack for Output 1 and 2 of four DMUs respectively. The early years do not have slack for the selected ports.
Table 5 mentioned that Chittagong Port has slack in 2016 and 2017 with 156,409 TEUs and 309,000 TEUs respectively. Yangon port has the most number of slack with 1,072,856 TEUs in 2008 and 958,464 TEUs in 2016.
Table 5. Slack for Output 1(TEUs) DMUs Port 1* Port 2* Port 3* Port 4* Mean
2007 0 0 0 0 0
2008 0 0 209 1,072 320,5
2009 0 0 0 0 0
2010 0 0 0 0 0
2011 0 0 0 0 0
2012 0 0 0 0 0
2013 0 0 0 0 0
2014 0 0 0 0 0
2015 0 0 0 0 0
2016 0 156,4 430 958,4 278,8
2017 0 309,0 0 0 772,5
Average 0 42,3 19,0 184,6 54,4
* Port 1: Colombo, Port2: Chittagong, Port 3: Channai, Port 4: Yangon
On average, colombo is the most efficient fol- lowed by the Channai, Chittagong and Yangon Port in terms of Cargo Throughput in TEUs.
Table 6 shows that the Colombo port has no slack in terms of vessel calls while the Yangon Port has least slack with average 0.091.
Channei Port has second least average value with 0.566 and the Chittagong port has the most slack value with average of 221.478. The mean value for slack of each port for each year is al- so calculated and presented in Table 6.
DMUs Port 1 Port 2 Port 3 Port 4 Mean
2007 0 7,302.008 276,079.241 0 7,045.312
2008 0 6,807.583 320,569.566 294,310.053 155,421.800 2009 0 7,780.360 306,863.382 0 78,660.935 2010 0 6,681.002 321,815.152 0 82,124.038 2011 0 6,718.350 310,274.591 0 79,248.235 2012 0 6,910.818 308,050.773 0 78,740.398
2013 0 765.123 299,039.051 0 76,601.046
2014 0 8,095.305 276,637.940 0 71,183.311 2015 0 8,332.528 245,604.160 0 63,484.172 2016 0 8,417.373 228,385.276 285,380.717 130,545.841 2017 0 8,611.739 218,596.128 0 56,801.967 Average 0 7,547.47 263,029.01 52,699.16 79,346.52
Table 6. Slack for Output 2(Vessel Calls)
DMUs Port 1 Port 2 Port 3 Port 4 Mean
2007 0 266.067 0 0 66.517
2008 0 214.322 0 0 53.581
2009 0 388.388 0 0 97.084
2010 0 317.057 0 1 79.264
2011 0 408.713 5.765 0 103.619
2012 0 454.713 0 0 0
2013 0 1.517 0 0 0.379
2014 0 309.219 0 0 77.305
2015 0 76 0 0 19
2016 0 0 0 0 0
2017 0 0 0.457 0 0.114
Average 0 221.478 0.566 0.091 45.169
Table 7. Slack for Input 1(Quay Length) DMUs Port 1 Port 2 Port 3 Port 4 Mean
2007 0 0 5,318.139 0 1,329.535
2008 0 0 5,492.809 1,915.072 1,851.970
2009 0 0 5,296.676 0 1,324.169
2010 0 0 5,557.357 0 1,389.339
2011 0 0 5,316.410 0 1,329.102
2012 0 0 5,345.233 0 1,336.308
2013 0 0 5,123.894 0 180.973
2014 0 0 4,740.061 0 1,185.051
2015 0 0 4,393.762 0 1,098.441
2016 0 0 3,913.275 1,856.969 1,442.561
2017 0 0 3,745.542 0 936.386
Average 0 0 4,931.196 342.912 1,202.078
Table 7,8 and 9 describes the slack for output 2(Vessel Calls). For input 1(Quay Length), the Colombo port and Chittagong Port do not have any slack followed by Yangon port with least
slack 342.913 and Channei Port with 4931.196.
Channei Port has second least average value with 0.566 and the Chittagong port has the most slack value with average 221.478.
As mentioned in Table 8, Colombo Port has no any slack while the Chittagong Port is the least slack with 754,747, followed by the Yangon Port 7,346.52 and the Channai Port 263,029.01 on the average.
Table 8. Slack for Input 2(Storage Area)
Table 9 describes that there is no slack for Colombo port, Channei Port and Yangon Port in terms of the number of cranes but average of 9 cranes slack for the Chittagong Port. The panel data obtained from each port over the years show that the Chittagong port has slack for each year values varied from 8.1 to 10.3. The value and the reference of the organizations that are to be adopted as per the peer level.
Table 9. Slack for Input 3(No. of Cranes) DMUs Port 1 Port 2 Port 3 Port 4 Mean
2007 0 8.804 0 0 2.201
2008 0 8.207 0 0 2.052
2009 0 9.380 0 0 2.345
2010 0 8.055 0 0 2.014
2011 0 8.1 0 0 2.025
2012 0 8.332 0 0 2.083
2013 0 8.880 0 0 2.22
2014 0 9.760 0 0 2.44
2015 0 10.046 0 0 2.511
2016 0 10.148 0 0 2.537
2017 0 10.383 0 0 2.596
Average 0 9.1 0 0 2.27
The selected four ports have different number of target output for each year based on the in- put availability at each port. After resource allo- cation, the related DMU has to define the target for outputs as per the peer summary and the ef- ficiency level.
Colombo port, Chittagong Port, Channei Port and Yangon port are defined as the DMUs 1,2,3 and 4 respectively. The peer count summary de- scribes the bnumber of times an efficient port acts as a reference for the other (inefficient) ports.
Table 10 presents the peer count summary of the defined DMUs. The radial and slack move- ment table of the final year data(2017) is also prepared to describe how each port can adjust to get the frontier.
Table 10. Peer Count Summary
DMUs Port 1 Port 2 Port 3 Port 4
2007 2 0 0 1
2008 3 0 0 0
2009 2 0 0 1
2010 2 0 0 1
2011 2 0 0 0
2012 2 0 0 1
2013 2 0 0 0
2014 2 0 0 0
2015 2 0 0 1
2016 3 0 0 0
2017 2 0 0 0
Table 11. Radial and Slack Movement(Output) Variabl
es DMUs Origina
l Value Radial Slack Project
ed Value
Output 1
1 6,209,000 0 0 6,209,000
2 2,290,000 0 309000 2,599,000
3 1,549,457 0 0 1,549,457
4 1,043,469 0 0 1,043,469
Output 2
1 6,209 0 0 6,209
2 2,599 0 0 2,599
3 1,549 0 457 1,549.457
4 2,667 0 0 2,667
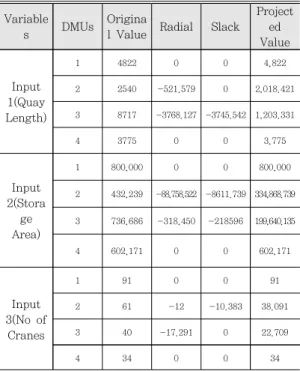
Colombo port do not have any radial or slack for both output TEUs and vessel calls. Chittagong port can increase the TEUs up to 309,000.
There is lack of quay occupancy, excess stor- age area and excess number of cranes as the radial movement shows –521.579, -887,758.522 and –13 respectively.
Variable
s DMUs Origina
l Value Radial Slack Project
ed Value
Input 1(Quay Length)
1 4822 0 0 4,822
2 2540 -521.579 0 2,018.421
3 8717 -3768.127 -3745.542 1,203.331
4 3775 0 0 3,775
Input 2(Stora ge Area)
1 800,000 0 0 800,000
2 432,239 -88,758.522 -8611.739 334,868.739 3 736,686 -318,450 -218596 199,640.135
4 602,171 0 0 602,171
Input 3(No of
Cranes
1 91 0 0 91
2 61 -12 -10.383 38.091
3 40 -17.291 0 22.709
4 34 0 0 34
Furthermore, Chittagone port can further adjust the input amount as there is slack movement with –8611.739 for storage area and –10 for the no of cranes. The radial and slack movement for input variables can be seen as follows:
Table 12. Radial and Slack Movement(Input)
The Colombo Port do not have slack and ra- dial movement for input variables. The Chittagong port has radial movement 522 units for the input 1(quay length), slack 88,759 units and radial movement 8,612 units for storage area and the input 3(no of cranes) needs slack move- ment of 12 units and radial movement 10 units.
The Channei Port needs slack movement of 3,768 unit and radial movement of 3,746 unit for input 1, slack movement 318,450 units and radial movement 218,596 units fo input 2 and slack movement 17 units for input 3. The Yangon port
do not have slack and radial movement to host the projected value.
Ⅴ. Conclusion and Recommendations for Further Research
This study sums up the movements that take place in the storage area of the port which were re- ceived through quay by use of crane.
As per the analysis data, Colombo is the most efficient. It is located at the strategic location which link the East Asia with the world, Europe, Middle East and Africa. As long as the Indian Ocean becomes more integral to global trade, both the Colombo port and the Channei Port plays a critical role because of it’s geographical location.
China has been using those sea ports as part of Belt and Road initiatives projects to increase its in- fluence in the region, as well as Japan focus in the Indian Ocean with it’s Free and Open Pacific Ocean and Indian Ocean strategy.
The first implication from the study concludes that there is positive affect on the revenue earn- ings(TEUs, vassel callings) along with the develop- ment of the port.
All of the countries are developing the port to be more efficient overtime. However, the ability to sus- tain and maintaining the transparency is different.
The data archive for Colombo port is easier com- pared to other ports.
They have issued annual reports based on the investment and the progress incurred during the past year. The positive trade and balance of pay- ments effects of good seaports and harbours can- not be denied.
The cluster of activities in sea ports all over the world clearly show that ports have significant economic impact both locally, regionally and nationally.
Secondly, the ports with low efficiencies are advised to invest on infrastructure, reduce long process paper work to attract more customers in order to increase the cargo handling units over time. Because of lack of infrastructure facilities, a long process time is required for the trans- portation of containerized cargoes to its hinter- land destinations, especially in Yangon Port and Chittagong port.
The third implication is to focus on the econ- omy of scale through the application of the slack and radial movement as presented in the empiri- cal analysis. The principle of economies of scale is fundamental to the economics of maritime transportation as the larger the ship, the lower the cost per unit transported. This trend has par- ticularly been apparent in bulk and containerized shipping. The evolution of containerization, as indicated by the size of the largest available con- tainership, has been a stepwise process.
Since the main weakness of DEA is being sensi- tive to the number of variables, the random nature of the variables might result in statistical consistency and data sampling error.
Further research can be done with bootstrapped DEA or other more aspect of theory to avoid over- estimation(Simar and Wilson 1998, 2000; Gutierrez, Lozano, & Furio 2014).
In view of the above mentioned ongoing ini- tiatives and activities, it may be concluded that the present and proposed port developments in
the Bay of Bengal area can have significant ef- fect to transport cost, time and efficiency in the future.
References
Alexandra MRC et al.(2018), "Efficiency container ports in Brazil : A DEA and FDH approach", Central European Review of Economics and Management ISSN: 2543-9472;
eISSN 2544-0365,Vol. 2, No. 1, pp. 43-64.
Andersen P and Petersen NC(1993). “A Procedure for Ranking Efficient Units in Data Envelopment Analysis.” Management Science, Vol 39, Issue 10, pp. 1261-1264.
Banker RD, Charnes A and Cooper WW(1984). “Some Models for Estimating Technical and Scale Inefficiencies in Data Envelopment Analysis.”
Management Science Journal, Volume 30, No 9.
pp. 1031-1142.
Banker RD, Charnes A and Cooper WW (1984), "Some Models for Estimating Technical and Scale Inefficiencies in Data Envelopment Analysis", Management Science, Vol. 30, No. 9, pp.
1078-1092.
Channei Port Trust(2019), "Indexed Scale of Rates", BOard of CHPT, Channei, India.
Charnes A, Cooper WW and Rhodes E(1978),
"Measuring the efficiency of decision making units", European Journal of Operational Research, Volume 2, Issue 6, pp. 429 - 444.
Chung, YH,Färe R and Grosskopf, S(1997), "Productivity and undesirable outputs: a directional distance function approach’, Journal of Environmental Management, Vol. 51, pp. 229-240.
Clarke X, Dollar D and Micco, A, (2004)," Port Efficiency, Maritime Transport Costs and Bilateral Trade", Journal of Development Economics, Vol 75, Issue 2, pp. 417-450.
Comin, D. and B. Hobijn(2004), “Cross-country Technology Adoption: Making the Theories Face
the Facts,” Journal of Monetary Economics, 2004, Vol. 51, Issue 1, 39-83.
Cullinane,K(2002), "The Productivity and Efficiency of Ports and Terminals: Methods and Applications. In:
Grammenos, (ed.)", The Handbook of Maritime Economics and Business. London: Lloyds of London Press, pp. 426-442
Cullinane, K and Song, D.W(2006) ."Estimating the Relative Efficiency of European Container Ports: A Stochastic Frontier Analysis", Port Economics:
Research in Transportation Economics, 16, Amsterdam: Elsevier, pp. 85-115
Danijela BP(2012), “DEA Window Analysis for Measuring Port Efficiencies in Serbia”, Journal of Promet-Traffic & Transportation May, 2012.Vol (24), pp. 63-72.
Fare R, Grosskopf S and Lovell CAK (1994),"Production Frontiers", Cambridge, UK, Cambridge University Press.
Farrell MJ(1957), "The Measurement of Productive Efficiency". Journal of the Royal Statistical Society, Vol 120.No. 3, pp. 253-290.
Hanaa AHEl(2016), "Efficiency Assessment of Jazan Port Based on Data Envelopment Analysis", Mediterranean Journal of Social Sciences, Vol 7, No 3, pp. 1 - 526.
Khezrimotlagh D et al.(2012), "A new method in data envelopment analysis to find efficient decision making units and rank both technical efficient and inefficient DMUs together", Applied Mathematical Sciences Volume 6, pp.
4609-4615.
Liu Q(2010), “Efficiency Analysis of Container Ports and Terminals”, Centre for Transport Studies, Department of Civil, Environmental and Geometric Engineering, University College London.
Myanmar Port Authority(1998), "Tariff and Dues", MPA, Ministry of Transport, Myanmar.
Simar L and Wilson P W(2000), "A general methodology for bootstrapping in non-parametric frontier mod- els", Journal of Applied Statistics, Volume 27, Issue 6, pp. 779-802.
Sri Lanka Ports Authority(2005), "Sri Lanka Ports Authority Tariff", Sri Lanka Port Authority.
Sri Lanka Port Authority(2013-2018), "Annual Report", SLPA, Port (Cargo) Corporation, the Port Tally and Protective Services.
벵갈만 지역의 컨테이너항만 효율성 분석에 관한 연구
Htet Htet Kyaw Nyunt⋅김현덕
국문요약
본 연구는 벵갈만 지역의 주요 컨테이너 항만들의 기술적 효율성을 조사하고 특정 요소가 컨테이너 항만 및 터미널의 효율성에 어떤 영향을 미치는지 분석하는데 목적이 있다. 주요 분석 대상은 스리랑카 의 콜롬보항만, 인도의 첸나이항만, 방글라데시의 치타공항만 그리고 미얀마의 양곤 항만 등이다.
연구의 목적을 달성하기 위한 투입 변수로는 선석 길이, 보관 장소 및 크레인 수를 사용하였으며 산 출 변수로는 컨테이너 물동량과 기항수가 분석에 사용되었다.
연구 결과에 의하면 동아시아와 유럽, 중동 그리고 아프리카를 연결하는 전략적 위치에 있는 콜롬보 항만이 기술 규모면에서 가장 효율적인 항만으로 분석되었으며 그 다음으로는 첸나이항만, 양곤항만 그 리고 치타공항만 순으로 나타났다. 제시된 연구 결과는 벵갈만에 위치한 항만들의 효율성을 제고하기 위 해서 어떤 변수에 주안점을 두어야 할지에 대한 기초 자료로서 의미가 있으며 주요 항만 정책 입안자 또는 터미널 운영업자 등의 의사결정에 유의미한 영향을 미칠 수 있다.
주제어: 효율성, 자료포락분석, 컨테이너항만, 벵골만