The Population Genetic Structure of the Japanese Anchovy (Engraulis japonicus Temminck & Schlegel) in the West, South and East Seas of Korea Based on Microsatellite DNA Analysis
Taeg Yun Oh, Joo Il Kim, Young Il Seo and Eun Seob Cho*
South Sea Fisheries Research Institute, National Fisheries Research and Development Institute, Yeosu 556-823, Republic of Korea Received November 5, 2008 /Accepted February 11, 2009
The characteristics of the population genetic structure of the Japanese anchovy (Engraulis japonicus Temminck & Schlegel) were collected from the West, South and East Seas of Korea in August, 2006 and were compared using six microsatellite DNA loci. In the West Sea population, the range of allele number against 72 individuals was from 19 to 41, the average allele number was 28.5. In EJ9, the al- lele number had the highest value of 41, this was 1.4 times higher than the average number of allele.
The average allele number of the South Sea population was 24.5 that was less than that of West Sea population. In EJ2, EJ9 and EJ27.1 loci, the allele number was higher than average allele number in the South Sea population. In the East Sea population, the average allele number was estimated at 25.0 that most of loci except for EJ35 were higher than average allele number. Allele frequency in the West, South and East Sea populations was below 0.24. The value of observed heterozosity for six loci was approximately 0.5 higher than that of expected heterozosity (p>0.05), but three populations similar val- ues to these heterozosity. Although the genetic diversity was higher value of above 0.9, three pop- ulations had a similar value. Genetic differentiation and distance combined estimate of the six loci were 0.258 and 0.019 (p>0.05), respectively, but showed no significant distance between three populations. These results suggested that it is responsible for no differentiated gene pool between three populations.
Key words : Anchovy, microsatellite DNA, population genetic structure
*Corresponding author
*Tel:+82-61-690-8959, Fax:+82-61-686-1588
*E-mail : [email protected]
Introduction
The Japanese anchovy, Engraulis japonicus (Temminck &
Schlegel), is a small pelagic schooling fish, and a plankton feeder with a wide distribution off the coast of the Korean peninsula including Japan and China. This species contrib- utes to one of importantly commercial fishing resources in Korea. Due to the higher economic value of the Japanese anchovy, it is needed for the efficient conservation of its fisheries. At present, genetic data play an important role in guiding the management of the Japanese anchovy. Some re- searchers have to undertaken to define the genetic structure of the population in European anchovy (E. encrasicolus Linnaeus) over decades [3,5,6,11,12,16-18]. In contrast to the European anchovy, the genetic structure of the population of the Japanese anchovy has been limited. More recently, Kim et al. [10] and Cho and Kim [8] had first studied the genetic characteristics of the Japanese anchovy occurring on- ly in the South Sea of Korea using DNA sequencing. Chiu
et al. [7] developed microsatellite primers for E. japonicus to identify genetic stocks and subsequently Yu et al. [20]
analyzed the population structure of the Japanese anchovy using 6 microsatellite DNA loci. In this study, we analyzed 6 microsatellite loci of the Japanese anchovy inhabiting the West, South and East Seas of Korea to illustrate and charac- terized population genetic structure.
Materials and Methods
Specimen
Japanese anchovies were sampled from the West, South and East Seas of Korea in August, 2006. We used a total of 174 specimens, and obtained 72, 60, 42 individuals from the West, South and East Seas of Korea respectively. Samples were frozen at -70oC until required.
DNA
Genomic DNA was extracted by the following method of Asahida [1]. Six oligonucleotide primers designed from the Japanese anchovy genomic DNA sequences were suc- cessfully used to amply DNA segments containing micro-
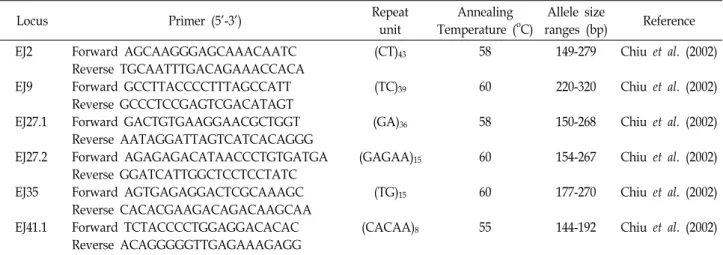
Table 1. Primer sequences and information of the microsatellite DNA
Locus Primer (5'-3') Repeat
unit
Annealing Temperature (oC)
Allele size
ranges (bp) Reference EJ2
EJ9 EJ27.1 EJ27.2 EJ35 EJ41.1
Forward AGCAAGGGAGCAAACAATC Reverse TGCAATTTGACAGAAACCACA Forward GCCTTACCCCTTTAGCCATT Reverse GCCCTCCGAGTCGACATAGT Forward GACTGTGAAGGAACGCTGGT Reverse AATAGGATTAGTCATCACAGGG Forward AGAGAGACATAACCCTGTGATGA Reverse GGATCATTGGCTCCTCCTATC Forward AGTGAGAGGACTCGCAAAGC Reverse CACACGAAGACAGACAAGCAA Forward TCTACCCCTGGAGGACACAC Reverse ACAGGGGGTTGAGAAAGAGG
(CT)43
(TC)39
(GA)36
(GAGAA)15
(TG)15
(CACAA)8
58 60 58 60 60 55
149-279 220-320 150-268 154-267 177-270 144-192
Chiu et al. (2002) Chiu et al. (2002) Chiu et al. (2002) Chiu et al. (2002) Chiu et al. (2002) Chiu et al. (2002)
Note: Exact annealing temperature of this particular primer is not available from the original study.
satellite DNA by PCR (Table 1).
PCR
PCR was carried out in a 25 μl reaction volume containing 100-200 ng of genomic DNA, each 20 pmol forward and re- verse primers, 0.5 mM dNTPs, 1.25 unit Taq DNA polymer- ase (Biotool) and 1× PCR buffer. The conditions for PCR am- plification were as follows: the extracted DNA was initially denatured at 94oC for 5 min followed by 30 cycles (denaturation at 94oC for 30 sec, annealing at 55-60oC for 1 min, and extension at 72oC for 1 min). The final extension step increased up to 10 min. The respective annealing tem- perature for each locus is as follows: 56-58oC for EJ2, 60oC for EJ9, 55-58oC for EJ27.1, 59-60oC for EJ27.2, 60oC for EJ35, and 55-57oC for EJ41.1. To ascertain successful DNA amplifi- cation, electrophoresis was carried out in 3% agarose gel for 1 hr and visualized after staining kit (Sybr Green Nucleic Acid StainⓇ, Roche Co.) by following manufacturer’s instructions. For the accuracy of size determination electro- phoresis was carried out three times mostly by using two independent PCR products.
Data analysis
Observed and expected heterozygosities were calculated using GENEPOP ver. 1.2 [13]. Genetic distance (FST) between populations of the West, South and East Seas of Korea was estimated according to the method of Excoffier et al. [9] us- ing Arlequin ver. 1.1 [14]. To investigate the genetic diversity within populations which corresponded to the expected het- erozygosity in the diploid data was calculated by Arlequin ver. 1.1. To test the null hypotheses that allelic and genotypic
distribution are identical across populations, the degree of genetic differentiation between populations was obtained using GENEPOP ver. 1.2. Statistical significance of the differ- ence between populations was tested by permutations.
Results and Discussion
Microsatellite DNA profiles of the anchovy was shown in Fig. 1. Although the amplification of the six microsatellite loci from the anchovy was possible, there is no finding of the most-informative locus for fingerprinting and differentiation. EJ27.1 showed moderate levels of poly- morphisms (e.g. the PCR products for EJ27.1 from lane 1 and 20 in Fig. 1 were 202 and 169 bp, respectively). In the West Sea population, the use of EJ9 locus had the highest number of allele of 41 than any other of that of the other loci (Table 2). The average allele number of the six loci was 28.5 in the West Sea. In EJ9 locus, the number of alleles showed a higher 1.4 times than the average allele number.
In EJ2, EJ27.1 and EJ27.2, the allele number ranged from 21 to 28, indicating around the average allele number. The aver- age allele number of the six loci was 24.5 in the South Sea population of EJ2, EJ9 and EJ27.1 loci had a higher number
Fig. 1. Gel photograph showing the PCR products at one micro- satellite locus (EJ27.1) in the anchovy.Lane 2, negative control; lane 1 and 3-20, population in the South Sea of Korea. M, molecular weight size (100 bp).
Table 2. Allele frequencies of the West, the South and the East Seas populations at each locus
Locus Population Na Nallb
Allele frequencies
EJ2
EJ9
EJ27.1
EJ27.2
EJ35
EJ41.1
West South East West South East West South East West South East West South East West South East
72 60 42 72 60 42 72 60 42 72 60 42 72 60 42 72 60 42
28 37 29 41 29 28 24 33 25 21 15 27 38 11 13 19 22 28
149-279 0.09 0.15 0.03 220-320
0.24 0.17 0.05 150-268
0.03 0.11 0.08 154-267
0.04 0.06 0.07 177-270
0.13 0.07 0.05 144-192
0.04 0.05 0.12
aN, sample size; bNall, number of alleles.
of allele ranging from 29 to 37, higher than the average allele number. However, EJ27.2 and EJ35 loci showed approx- imately 0.5 times lower than the average allele number. In the East Sea population, most of the loci except for EJ35 showed a higher number of alleles than the average allele number (25.0). Allele frequencies in all loci, which revealed a very low polymorphism, showed no remarkable difference across the three populations. Observed heterozygosity and expected heterozygosity are shown in Table 3. The highest observed heterozygosity was found in EJ9 locus of the South Sea population (Hobs=0.584). Instead, relatively low he- trozygosity was observed in EJ2 (Hobs=0.477, South Sea pop- ulation), EJ27.1 (Hobs=0.457, West Sea population) and EJ27.2 (Hobs=0.437, East Sea population). In all loci, three pop- ulations were of a similar value of heterozygosity (Hobs= 0.457-0.562 in West Sea population, Hobs=0.477-0.584 in South Sea population and Hobs=0.437-0.555 in East Sea population).
In comparisons between values of observed and expected heterozygosity, the estimate of three populations was re- markably high in all loci. Statistically significance was not found in all loci of three populations at the level of p>0.05.
Table 3. Results of the test for heterogeneity in each population Locus Population Hobsa
Hexpb
d.f.c Pd EJ2
EJ9
EJ27.1
EJ27.2
EJ35
EJ41.1
West South East West South East West South East West South East West South East West South East
0.549 0.477 0.521 0.521 0.584 0.502 0.457 0.533 0.507 0.578 0.522 0.437 0.562 0.555 0.475 0.534 0.529 0.555
0.921 0.904 0.934 0.966 0.985 0.907 0.985 0.964 0.912 0.937 0.936 0.967 0.955 0.915 0.965 0.933 0.948 0.962
45 25 15 10 8 19 22 34 21 34 9 22 27 15 19 28 8 11
NS NS NS NS NS NS NS NS NS NS NS NS NS NS NS NS NS NS
aHobs, observed heterozygosity; bHexp, expected heterozygosity;
cdf, degree of freedom; dP, significance for deviation; NS, non-significant.
Table 4. Genetic diversity within the West, the South and the East Seas of Korea populations at each locus
Locus Population Genetic diversity
EJ2
EJ9
EJ27.1
EJ27.2
EJ35
EJ41.1
West South East West South East West South East West South East West South East West South East
0.924 0.957 0.978 0.985 0.915 0.938 0.968 0.924 0.955 0.961 0.933 0.952 0.932 0.962 0.975 0.927 0.939 0.924
Within-population gene-diversity is shown in Table 4. The genetic diversity of West, South and East populations ranged from 0.924 in EJ2 to 0.985 in EJ9, 0.915 in EJ9 to 0.962 in EJ35 and 0.924 in EJ41.1 to 0.978 in EJ2, respectively. In all loci, the West Sea population was similar genetic diversity compared with that of South and East Seas populations. In
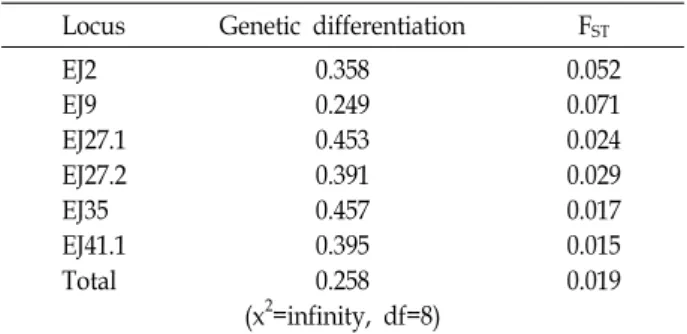
Table 5. Analyses of genetic differentiation between the West and the South/the East Seas of Korea populations Locus Genetic differentiation FST
EJ2 EJ9 EJ27.1 EJ27.2 EJ35 EJ41.1 Total
0.358 0.249 0.453 0.391 0.457 0.395 0.258 (x2=infinity, df=8)
0.052 0.071 0.024 0.029 0.017 0.015 0.019
FST, genetic distance.
addition, the mean number of the pairwise difference of al- leles also was similar in all populations (1.412 in West Sea population vs. 1.392 in South Sea population vs. 1.377 in East Sea population). Genetic differentiation between West and South and East Sea populations is presented in Table 5. Statistically significant differentiation was not observed in all loci (p>0.05), but higher values of 0.457 and 0.453 in EJ35 and EJ 27.1 respectively were shown. Estimates of the genetic distance based on FST showed a distance with no statistical significance in all loci (FST=0.015-0.071; p>0.05), a combined estimate of six loci resulted in also no significant distance between three populations (FST=0.019; p>0.05).
It is known that microsatellite DNA loci have high levels of polymorphism and are abundant in fish genomes [19].
To effectively manage fish populations and identify fish stock, microsatellite has been applied to the fishery pop- ulation structure. Our microsatellite DNA analysis of three populations is noteworthy in two aspects of population ge- netic structure: one is the high average number of alleles per locus and the other is no genetic differentiation between Wes, South and East Sea populations. The high allele num- ber per locus may be associated with the large effective pop- ulation size of the Japanese anchovy and taken to screen for polymorphic loci. Six loci used in this study contributed considerably polymorphic, which will play an important role in analyzing population genetic structure in Korean pe- lagic fish. Kim et al. [10] suggested that Japanese anchovy populations in Korea using 12S rRNA gene sequence were not genetically isolated, but form a large, closely related ge- netic group. Furthermore, Cho and Kim [8] suggested that the overall anchovy population in the Korean peninsula in- ferred from mitochondrial DNA control region caused con- siderable migration due to the mitochondrial high gene flow between inshore and offshore to form a genetically homoge-
nous structure. In this present study, our microsatellite DNA analysis of the Japanese anchovy also shows that all the pop- ulations in Korean waters are genetically connected and makes for clear evidence described by two previous reports [8,10]. Consequently, it is understood that the Japanese an- chovy in Korea has a large monophyletic population, no ge- netic subdivision and high level of genetic relationship over geographic area.
Yu et al. [20] suggested that spawning populations in Taiwan using six microsatellite DNA loci belonged to two separate stocks, but the level of geographic differentiation was weak. A significantly different result between our pres- ent study and Yu et al. [20] is found to spawning population, although the use of microsatellite DNA loci and specimens is the same. Numerous researchers have reported genetically distinct populations in the analysis of population genetic structure of pelagic fish [2,4,12,13,15]. The main reason was explained by variable environmental conditions.
Consequently, it is assumed that heterogeneous environ- ments between Korea and Taiwan cause different ecological characteristics in terms of spawning.
Acknowledgement
This work was funded by a grant from the National Fisheries Research and Development Institute (RP-2008- FR-032). The constructive comments from the two reviewers improved the paper.
References
1. Asahida, T., T. Kobayashi, K. Saitoh, and I. Nakayama. 1996.
Tissue preservation and total DNA extraction from fish stor- ed at ambient temperature using buffers containing high concentration of urea. Fish Sci. 62, 727-730.
2. Bembo, D. G., G. R. Carvalho, M. Snow, N. Cingolani, and T. J. Pitcher. 1995. Stock discrimination among European anchovies, Engraulis encrasicolus, by means of PCR-ampli- fied mitochondrial DNA analysis. Fish Bull. 75, 31-40.
3. Bembo, D. G., G. R. Carvalho, N. Cingolani, and T. J.
Pitcher. 1996b. Electrophoretic analysis of stock structure in northern Mediterranean anchovies, Engraulis encrasicolus.
ICES J. Mar. Sci. 75, 115-128.
4. Bembo, D. G., G. R. Carvalho, N. Cingolani, E. Arneri, g.
Giannetti, and T. J. Pitcher. 1996a. Allozymic and morpho- metric evidence for two stocks of the European anchovy Engraulis encrasicolus in Adriatic waters. Mar. Biol. 75, 529-538.
5. Borsa, P. 2002. Allozyme, mitochondrial-DNA, and mor-
phometric variability indicate cryptic species of anchovy (Engraulis encrasicolus). Biol. J. Linn. Soc. 75, 261-270.
6. Borsa, P., A. Collet, and J. D. Durand. 2004. Nuclear-DNA markers confirm the presence of two anchovy species in the Mediterranean. C.R. Biologies 327, 1113-1123.
7. Chiu, T. S., Y. J. Lee, S. W. Huang, and H. T. Yu. 2002.
Polymorphic microsatellite markers for stock identification in Japanese anchovy (Engraulis japonica). Mol. Ecol. Notes 2, 49-50.
8. Cho, E. S. and J. I. Kim. 2006. Mitochondrial DNA poly- morphism of the Japanese anchovy (Engraulis japonicus Temminck & Schlegel) collected from the Korean offshore and inshore waters. J. Life Sci. 16, 812-827.
9. Excoffier, L., P. E. Smouse, and J. M. Quattro. 1992. Analysis of molecular variance inferred from metric distances among DNA haplotypes: application to human mitochondrial DNA restriction data. Genetics 131, 479-491.
10. Kim, J. Y., E. S. Cho, and W. J. Kim. 2004. Population genetic structure of Japanese anchovy (Engraulis japonicus) in Korean waters based on mitochondrial 12S ribosomal RNA gene sequence. J. Life Sci. 14, 938-950.
11. Landi, M., F. Garoia, C. Piccinetti, and F. Tinti. 2005.
Isolation of polymorphic microsatellite loci from the European anchovy, Engraulis encrasicolus. Mol. Ecol. 5, 266-268.
12. Magoulas, A., N. Tsimenides, and E. Zouros. 1996.
Mitochondrial DNA phylogeny and the reconstruction of the population history of a species: the case of the European anchovy (Engraulis encrasicolus). Mol. Biol. Evol. 13, 178-190.
13. Raymond, M. and F. Rousset. 1995. GENEPOP: a pop- ulation genetics software for exact test and ecumencism. J.
Hered. 86, 248-249.
14. Schneider, S., J. M. Kueffer, D. Roessli, and L. Excoffier.
1996. Arlequin: a software package for population genetics.
Genetics and Biometry Lab., Dept. of Anthropology, University of Geneva.
15. Spanakis, E., N. Tsimenides, and E. Zouros. 1989. Genetic differences between populations of sardine, Sardina pilchar- dus, and anchovy, Engraulis encrasicolus, in the Aegean and Ionian Seas. J. Fish Biol. 75, 417-437.
16. Tudela, S. 1999. Morphological variability in a Mediterranean, genetically homogeneous population of the European anchovy, Engraulis encrasicolus. Fish Res. 42, 229-243.
17. Tudela, S. and I. Palomera. 1997. Trophic ecology of the European anchovy, Engraulis encrasicolus, in the Catalan Sea (north-west Mediterranean). Mar. Ecol. Prog. Ser. 160, 121-134.
18. Tudela, S., J. L. Garcia-Marin, and C. Pla. 1999. Genetic structure of the European anchovy, Engraulis encrasicolus 1., in the north-west Mediterranean. J. Exp. Mar. Biol. Ecol. 234, 95-109.
19. Wright, J. M. and P. Bentzen. 1994. Microsatellites: genetic markers for the future. Rev. Fish. Biol. Fish 4, 384-388.
20. Yu, H. T., Y. J. Lee, S. W. Huang, and T. S. Chiu. 2002.
Genetic analysis of the populations of Japanese anchovy (Engraulidae: Engraulis japonicus) using microsatellite DNA.
Mar. Biotechnol. 4, 471-479.
초록:Microsatellite을 이용한 서해, 남해 및 동해 멸치 계군 분석
오택윤․김주일․서영일․조은섭*
(국립수산과학원 남해수산연구소)
본 연구는 2006년 8월경에 어획된 서해, 남해 및 동해 멸치집단을 분석하기 위하여 6종류의 microsatellite로 하였다. 서해멸치의 경우, 샘플수 72마리에 대한 allele 범위가 19-41로 평균 28.5를 보였다. 특히 EJ9 locus에서 평균보다 약 1.4배 많은 41를 나타내었다. 남해멸치의 평균 allele는 24.5로 서해보다는 적었고, EJ2, EJ9, EJ27.1 loci는 평균보다 높은 29-37의 범위를 보였다. 동해멸치는 평균 allele가 25.0으로 EJ35를 제외하면 대부분의 loci에서 평균 이상을 보였다. 그러나 서해, 남해 및 동해멸치의 allele 빈도율은 대부분 0.24 이하로 나타났다. 또한 Hobs보다 Hexp에서 0.5 정도 높은 값을 보였으나 유의성은 없었다(p>0.05). 유전적 다양성도 0.9 이상으로 매우 높은 값을 보였다. 6종류의 microsatellite에 대한 지역간의 유전적 차이 및 거리는 0.258과 0.019로 유의적으로 차이는 없었다 (p>0.05). 따라서 서해, 남해 및 동해 멸치계군은 유전적으로 동일한 집단을 형성하고 있는 것으로 판단된다.