Effects of cranberry powder on serum lipid profiles and biomarkers of oxidative stress in rats fed an atherogenic diet
Mi Joung Kim 1 , Ha Na Jung 2 , Ki Nam Kim 1 and Ho-Kyung Kwak 2§
1
Department of Food and Nutrition, College of Human Ecology, Chungbuk National University, 410 Sungbong-ro, Heungduk-gu Cheongju 351-736, Korea
2
Department of Home Economics, Korea National Open University, 169 Donsung-dong, Chongno-gu, Seoul 110-791, Korea
Received August 8,2008; Revised September 1, 2008; Accepted September 9, 2008
Abstract
This study investigated that the antioxidative effect of freeze-dried cranberry powder against protein and lipid oxidation and ameliorative effect of serum lipid profile in rat fed atherogenic diet. Six weeks old male Sprague-Dawley rats were divided into the following four groups: normal diet group with 5% corn oil (control), atherogenic diet group with 5% corn oil, 10% lard, 1% cholesterol, and 0.5% sodium cholate (HFC), atherogenic plus 2% cranberry powder diet group (HFC + C2), and atherogenic plus 5% cranberry powder diet group (HFC + C5), and respective diet and water were fed daily for 6 weeks. After the experimental period, the serum lipid profile, such as total cholesterol, HDL-cholesterol, LDL-cholesterol, and triglyceride, ferric reducing ability of plasma (FRAP), plasma phenolics content, superoxide dismutase (SOD) activity, serum protein carbonyl and thiobarbituric acid reactive substances (TBARS) levels were examined. Total phenolic compound and total flavonoid levels in freeze-dried cranberry powder were 9.94 mg/g and 8.12 mg/g, respectively. Serum total cholesterol and LDL-cholesterol levels were not significantly different for cranberry powder treatment, but serum HDL-cholesterol level was significantly increased in HFC + C5 group compared with HFC group. Plasma FRAP value tended to be increased by cranberry powder treatment though there was no significant difference. Plasma total phenol concentrations and SOD activities were not significantly different among all groups. Serum protein carbonyl and TBARS levels were significantly decreased in HFC + C5 group compared with HFC group. Overall results suggested that freeze-dried cranberry powder might have the serum lipid improving effect, as well as antioxidative effect demonstrated by its protective effect against protein and lipid oxidation.
Key Words: Antherogenic diet, protein carbonyl, TBARS, FRAP, cranberry powder
Introduction 3)
In recent years, there has been increasing interest in health and disease prevention in relation to oxidative stress. Enhanced oxidative stress was shown to cause general damage on cells by promoting the oxidation of protein and DNA and lipid peroxidation (Cadenas & Davies, 2000). Several studies have found that biomarkers of oxidative stress were improved by various plant food materials such as tea (Sriram et al., 2008), cocoa (Ramiro-Puig et al., 2007), red wine (Das et al., 2007), and grape juice (Dani et al., 2008), which are known to be high in phenolic compounds. In addition, polyphenolic constituents of wines and grapes juices have been reported to act as free radical scavengers and antimicrobial agents (Sanchez-Moreno et al., 1999; Shahidi & Wanasundara, 1992).
Cranberry has been shown to prevent urinary tract infections, inhibit peptic ulcer-associated bacterium, Helicobacter pylori, and induce apoptosis of carcinoma cell (Gotteland et al., 2008;
Kontiokari et al., 2001; Krestry et al., 2008). In addition, cranberry was known to have antioxidant properties as shown
in plasma antioxidant status, protection of RBC against hemolysis and a cellular antioxidant activity (Villarreal et al., 2007; Wolfe
& Liu, 2007).
Cranberry is rich in phenolic phytochemicals such as phenolic acids, flavonoids and ellagic acid. These phytochemicals act as antioxidants, and showed health benefits including reduction of oxidative damage that can cause cancer, heart disease, and other degenerative diseases (Çelik et al., 2008; Vattem et al., 2005).
Chu and Liu (2005) reported that phytochemicals in cranberries could inhibit LDL oxidation and induce expression of LDL receptors. Mckay and Blumberg (2007) also reported that cranberry reduced the risk of cardiovascular disease (CVD) by inhibition of LDL oxidation and platelet aggregation, and reducing blood pressure via other anti-thrombotic and anti- inflammatory mechanisms.
Typical forms of cranberry found in markets are dried and ground whole fruits or dried juice. Recently, freeze-dried cranberry powder and 100% cranberry juice are available and introduced their health benefit on prevention of urinary tract infections (UTIs). Piljac-Žegarac et al. (2008) reported that total
§
Corresponding Author: Ho-Kyung Kwak, Tel. 82-2-3668-4649, Fax. 82-2-3668-4188, Email. [email protected]
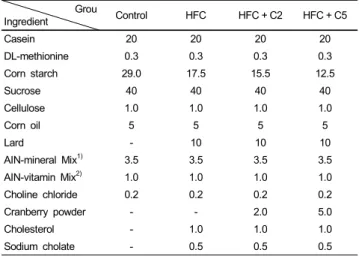
Table 1. Composition of control and experimental diet (%) Grou
Ingredient Control HFC HFC + C2 HFC + C5
Casein 20 20 20 20
DL-methionine 0.3 0.3 0.3 0.3
Corn starch 29.0 17.5 15.5 12.5
Sucrose 40 40 40 40
Cellulose 1.0 1.0 1.0 1.0
Corn oil 5 5 5 5
Lard - 10 10 10
AIN-mineral Mix
1)3.5 3.5 3.5 3.5
AIN-vitamin Mix
2)1.0 1.0 1.0 1.0
Choline chloride 0.2 0.2 0.2 0.2
Cranberry powder - - 2.0 5.0
Cholesterol - 1.0 1.0 1.0
Sodium cholate - 0.5 0.5 0.5
Control: normal diet control group, HFC: atherogenic diet control group,
HFC + C2: atherogenic plus 2% cranberry power diet group, HFC + C5: atherogenic plus 5% cranberry power diet group.
1)
Composition of AIN-76 salt mixture
2)
Composition of AIN-76 vitamin mixture
phenolics level in cranberry juice was 1546.9 mg/L and Chen et al. (2001) reported that cranberry juice had 400 mg/L of total phenolics. Vinson et al. (2008) reported that the amount of total phenols in cranberry foods was higher in dried or frozen products than in 100% cranberry juices.
However, most studies used cranberry extract or juice for testing its in vivo antioxidant function. In addition, it is limited that investigators studied freeze-dried cranberry powder and its antioxidant and cardiovascular protective effects. Therefore, we employed freeze-dried cranberry powder and investigated its possible health benefits using animal model. In the present paper, we report the antioxidative effect against protein and lipid oxidation and serum lipid profile ameliorative effect of freeze- dried cranberry powder in rats fed atherogenic diet.
Materials and Methods
Animals and diet
Six-week-old, 30 male Sprague-Dawley rats, weighing 160-190 g, were obtained from Animals Co. (Daehan, Korea) and maintained under a specific condition with a temperature-controlled (23 ±
2℃) and humidity-controlled (50 ± 10%). After a 7-day acclima- tion period, animals were divided into the following four groups on the basis of comparable mean body weight: 5% corn oil normal diet group (Control, n=7), atherogenic diet group containing 5%
corn oil, 10% lard, 1% cholesterol, and 0.5% sodium cholate (HFC, n=7), atherogenic plus 2% cranberry powder diet group (HFC + C2, n=8), and atherogenic plus 5% cranberry powder diet (HFC + C5, n=8). Freeze-dried cranberry powder was purchased from Mastertaste Co. (USA) and all diets were the modified AIN-76 (American Institute of Nutrition, 1977) (Table 1). The experimental
diets and water were fed ad libitum for 6 weeks from the beginning of the experiment. Food intake was recorded daily and the body weight was measured weekly. The end of the experimental period, the animals anesthetized with ethyl ether after 12 hours fasting and blood from the saphenons vein and the liver samples were collected. Blood samples were collected in vacuum tube (Becton-Dickinson, Meylan, France) without anticoagulant for lipid profiles and biochemical analysis, and with heparin for erythrocyte lysate preparation. All blood samples were immediately centrifuged (3,000 rpm, 20 min, 4℃) for the separation of serum, plasma, and erythrocyte. Erythrocyte samples were lysed in 4 times with ice cold HPLC-grade water and centrifuged (10,000 g, 15 min, 4℃), and the supernatant (erythrocyte lysate) was collected for erythrocyte superoxide dismutase (SOD) activity analysis. All samples were stored at -80℃ and thawed only once, just before analysis.
Lipid profiles
Serum total cholesterol, HDL-cholesterol, and triglyceride were detected by enzymatic assay using automatic biochemical analyzing system (Vitalab Selectra E, Vital Scientific N.V., the Netherlands). LDL-cholesterol level was calculated by a formula of Friendewald et al. (1972).
Ferric reducing ability of plasma (FRAP)
Plasma antioxidant status was evaluated using ferric reducing ability of plasma (FRAP) assay (Benzie & Strain, 1996). At low pH, the ferric-tripyridyltriazine (Fe(III)-TPTZ) complex is reduced to ferrous tripyridyltriazine (Fe(II)-TPTZ), which is color marker, depends on the ability of sample. Two hundred seventy μ l of pre-warmed (at 37℃) freshly prepared FRAP reagent (25 ml of 300 mM sodium acetate buffer pH 3.6, 2.5 ml of 10 mM 2,4,6-tri(2-pyridil)-s-triazine (TPTZ) in 40 mM HCl, 2.5 ml of 20 mM ferric chloride solution) were mixed with 30 μl of plasma diluents. After 15 min incubation at 37℃, absorbance was read at 550 nm. FRAP values are measured by detection of the absorbance change of test sample as the reducing power of antioxidants present in the plasma comparing with that of trolox standard.
Total phenolics and total flavonoid assay
The total soluble phenolic compounds were determined in
cranberry powder and plasma with the Folin-Ciocalteu reagent
according to the method of Singleton et al. (1965) using gallic
acid as standard. Mixture of 50 μl sample (plasma or 100 mg
freeze-dried cranberry powder in 1 ml of distilled water) and
865 μl distilled water was incubated with 75 μl Folin-Ciocalteu
reagent at room temperature for 5 min. Two hundred twenty five
μ l of 20% Na
2CO
3and 285 μl of distilled water were added
to the reaction mixture which was incubated at room temperature
for 2 hours, and the absorbance was read at 760 nm. The total
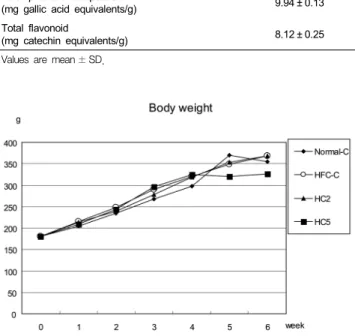
Table 2. Total phenolic compound and total flavonoid levels in cranberry powder Content Total phenolic compound
(mg gallic acid equivalents/g) 9.94 ± 0.13
Total flavonoid
(mg catechin equivalents/g) 8.12 ± 0.25
Values are mean ± SD.
Fig. 1. Change of body weights in rat. Values are mean.
phenolic content is expressed as gallic acid equivalent (GAE) in mM of plasma and milligrams per gram of dried sample.
The total flavonoid level in freeze-dried cranberry powder was measured by spectropotometric method using catechin as standard (Jia et al., 1999). Five hundred μl of diluted sample with distilled water and 75 μl of 5% NaNO
2solution were mixed and incubated at room temperature for 5 min. This mixture was added 150 μl of 10% AlCl
3and allowed to stand for a further 5 min before 0.5 ml of 1 M NaOH was added. The solution was measured the absorbance at 510 nm. The results were expressed as catechin equivalent in milligrams per gram of freeze-dried cranberry powder.
Plasam and erythrocyte lysate superoxide dismutase (SOD) activity Superoxide dismutase (SOD) activities of plasma and erythrocyte lysate were measured by microplate assay method based on the detection of superoxide radicals generated by xanthine oxidase and hypoxanthine using the commercial kit (Cayman chemical superoxide dismutase assay kit, Cayman Chemical Co., USA).
Serum protein carbonyl and thiobarbituric acid reactive substances levels
Serum protein carbonyl levels were determined by enzyme linked immunosorbent assay (ELISA) based on the detection of protein hydrazones form from the reaction of dinitrophenylhydrazine (DNP) with protein carbonyl using the Biocell PC test kit ( BioCell Corp., Ltd., New Zealand).
Serum thiobarbituric acid reactive substances (TBARS), which is the important marker of lipid peroxidation, was determined by spectrophotometric method using the OXItek TBARS kit (ZeptoMetrix Co., USA).
Statistical analysis
Statistical programs available in SAS program (version 9.1, SAS Inc, Cary, NC, USA) were utilized for data analysis. The significance of difference among the groups was assessed using one-way analysis of variance and Duncan’s multiple range tests.
Values are presented as the mean ± standard deviation, and a significance test on all results was conducted at level of p<0.05 unless otherwise stated.
Results
Total phenolics and total flavonoids in cranberry powder Total phenolic compound and total flavonoid levels in freeze-dried cranberry powder were 9.94 mg/g and 8.12 mg/g respectively (Table 2).
Weights and food intake
Weight gains, mean of food intake, and food efficiency ratio (FER) are shown in Table 3 and body weight change are shown in Fig. 1. Body weights were gradually increased in all groups, and the weight gains and mean of food intake were decreased in HFC + C5 group (146.2 g, 13.5 g/day) compared with control (182.5 g, 15.5 g/day) or HFC groups (194.5 g, 15.4 g/day), but FER was not significant difference between HFC + C5 (0.25 g/100 g body weight) and control (0.26 g/100 g body weight) or HFC group (0.31 g/100 g body weight).
The final body weight also was decreased in HFC + C5 group compared with control or HFC groups (Table 3). The liver weight and relative liver weight were significantly increased in all atherogenic diet groups than in normal diet group, but the liver weight was decreased in HFC + C5 group (17.8 g) compared with the HFC group (23.0 g) (Table 3).
Lipid profiles
The results about the effect of cranberry powder on serum lipid
profiles are shown in Table 4. Average of serum triglyceride
level in control group was significantly higher than that in all
atherogenic diet groups. Serum total cholesterol and LDL-
cholesterol levels were significantly increased by atherogenic
diets, but there was no significant difference for cranberry powder
treatment. Serum HDL-cholesterol level and HDL/LDL ratio
were significantly decreased in all atherogenic diet groups
compared with normal diet group. However serum HDL-
Table 4. Effects of cranberry powder on serum lipid profiles in diet-induced hyperlipidemia rat
1)Group (n) Triglyceride (mg/dl) Total cholesterol (mg/dl) HDL-cholesterol (mg/dl) LDL-cholesterol (mg/dl) HDL/LDL ratio
Control (7) 112.5 ± 49.2
a200.5 ± 20.8
b62.9 ± 3.3
a113.3 ± 14.1
b0.535 ± 0.040
aHFC (7) 51.9 ± 15.6
b456.1 ± 82.5
a38.7 ± 8.3
c407.0 ± 81.8
a0.098 ± 0.023
bHFC + C2 (8) 71.3 ± 35.2
b468.8 ± 170.3
a36.6 ± 6.1
c417.9 ± 171.2
a0.098 ± 0.036
bHFC + C5 (7) 70.0 ± 29.2
b504.1 ± 99.1
a49.7 ± 12.6
b436.3 ± 95.5
a0.106 ± 0.046
bn: number of animals,
Control: normal diet control group, HFC: atherogenic diet control group,
HFC + C2: atherogenic plus 2% cranberry power diet group, HFC + C5: atherogenic plus 5% cranberry power diet group.
1)
Values are mean excluding one of the data over 2SD ± SD,
Means with the different superscripts are significantly different at p<0.05 by Duncan's multiple range test.
Table 3. Effects of cranberry powder on food intake, food intake efficiency ratio (FER), weight gains, final body weight, liver weight, and relative liver weight in diet-induced hyperlipidemia rat
Group (n) Food intake
(g/day)
FER
2)(g/100 g body weight)
Weight gains
3)(g)
Final body weight (g)
Liver weight (g)
Relative liver weight (g/100 g body weight)
Control (7) 15.5 ± 0.6
a0.26 ± 0.03
ab182.5 ± 16.3
a362.5 ± 19.6
a12.4 ± 1.6
c3.42 ± 0.36
bHFC (7) 15.4 ± 0.9
a0.31 ± 0.04
ab194.5 ± 34.4
a374.5 ± 34.5
a23.0 ± 3.6
a6.13 ± 0.42
aHFC + C2 (8) 14.7 ± 0.5
b0.31 ± 0.06
a192.9 ± 38.7
a372.9 ± 40.0
a21.3 ± 3.9
a5.66 ± 0.53
aHFC + C5 (8) 13.5 ± 0.5
c0.25 ± 0.06
b146.2 ± 28.5
b326.3 ± 24.8
b17.8 ± 2.5
b5.48 ± 0.86
an: number of animals,
Control: normal diet control group, HFC: atherogenic diet control group,
HFC + C2: atherogenic plus 2% cranberry power diet group, HFC + C5: atherogenic plus 5% cranberry power diet group.
1)
Values are mean ± SD,
Means with the different superscripts are significantly different at p<0.05 by Duncan's multiple range test.
2)
FER: food intake efficiency ratio
3)
Total body weight gains for 6 weeks
Table 5. Effects of cranberry powder on plasma FRAP and total phenolic levels in diet-induced hyperlipidemia rat
1)Group (n) FRAP
2)(μM)
Total phenolic level (mM gallic acid equivalents)
Control (7) 172.9 ± 54.2
NS6.08 ± 0.20
NSHFC (6) 180.6 ± 59.0 6.27 ± 0.17
HFC + C2 (8) 228.8 ± 82.5 6.16 ± 0.39
HFC + C5 (8) 217.4 ± 64.2 6.06 ± 0.30
n: number of animals,
Control: normal diet control group, HFC: atherogenic diet control group,
HFC + C2: atherogenic plus 2% cranberry power diet group, HFC + C5: atherogenic plus 5% cranberry power diet group.
1)
Values are mean ± SD,
Means with the different superscripts are significantly different at p<0.05 by Duncan's multiple range test.
2)
FRAP: the ferric reducing ability of plasma
Table 6. Effects of cranberry powder on plasma and erythrocyte lysate SOD activity in diet-induced hyperlipidemia rat
1)Group (n) SOD
2)activity in plasma (U/ml)
SOD activity in erythrocyte (U/ml)
Control (7) 23.1 ± 9.8
NS653.6 ± 338.1
NSHFC (7) 27.0 ± 12.3 657.8 ± 218.1
HFC + C2 (8) 29.0 ± 10.9 578.7 ± 273.4
HFC + C5 (8) 26.2 ± 8.1 422.7 ± 205.4
n: number of animals,
Control: normal diet control group, HFC: atherogenic diet control group,
HFC + C2: atherogenic plus 2% cranberry power diet group, HFC + C5: atherogenic plus 5% cranberry power diet group.
1)
Values are mean ± SD,
Means with the different superscripts are significantly different at p<0.05 by Duncan's multiple range test.
2)
SOD: superoxide dismutase
cholesterol was significantly increased in HFC + C5 group (49.7 mg/dl) compared with HFC group (38.7 mg/dl) (Table 4).
Plasma FRAP, total phenolics levels and SOD activity Plasma FRAP and total phenolics levels were detected to examine the effects of cranberry powder on antioxidant status.
Average of plasma FRAP value shown tended to be increased by cranberry powder treatment, but there was no significant difference (control; 172.9 μM, HFC; 180.6 μM, HFC + C2; 228.8 μM, HFC + C5; 217.4 μM). Plasma total phenolic content was
not significantly different for atherogenic diet or cranberry powder treatment (Table 5).
Plasma SOD activity was also not significantly different by atherogenic diet or cranberry powder treatment, but erythrocyte SOD activity showed a tendency to be decreased by cranberry powder treatment although there was not significant (Table 6).
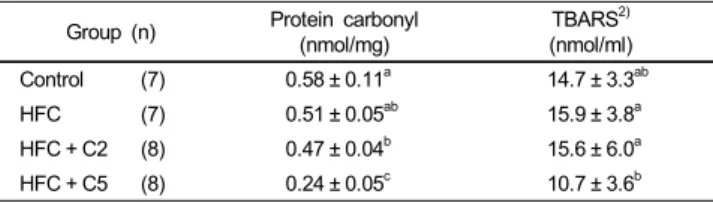
Serum protein carbonyls and TBARS levels
Serum protein carbonyl and TBARS levels were measured to
investigate the antioxidant effects of cranberry powder against
Table 7. Effects of cranberry powder on serum protein carbonyl and TBARS levels in diet-induced hyperlipidemia rat
1)Group (n) Protein carbonyl (nmol/mg)
TBARS
2)(nmol/ml)
Control (7) 0.58 ± 0.11
a14.7 ± 3.3
abHFC (7) 0.51 ± 0.05
ab15.9 ± 3.8
aHFC + C2 (8) 0.47 ± 0.04
b15.6 ± 6.0
aHFC + C5 (8) 0.24 ± 0.05
c10.7 ± 3.6
bn: number of animals,
Control: normal diet control group, HFC: atherogenic diet control group,
HFC + C2: atherogenic plus 2% cranberry power diet group, HFC + C5: atherogenic plus 5% cranberry power diet group.
1)
Values are mean ± SD,
Means with the different superscripts are significantly different at p<0.05 by Duncan's multiple range test.
2)