pISSN 1976-1457 eISSN 2005-6168
Nutritional education for management of osteodystrophy (NEMO) trial: Design and patient characteristics, Lebanon
Mirey Karavetian§, Saade Abboud, Hafez Elzein, Sarah Haydar and Nanne de Vries Department of Health Promotion, Maastricht University, 6200 MD Maastricht, Netherlands
Abstract
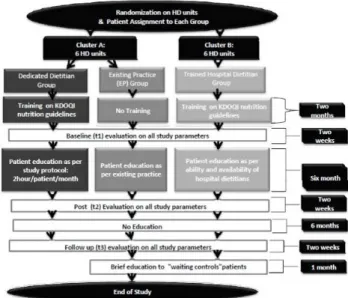
This study aims to determine the effect of a trained dedicated dietitian on clinical outcomes among Lebanese hemodialysis (HD) patients: and thus demonstrate a viable developing country model. This paper describes the study protocol and baseline data. The study was a multicenter randomized controlled trial with parallel-group design involving 12 HD units: assigned to cluster A (n = 6) or B (n = 6). A total of 570 patients met the inclusion criteria. Patients in cluster A were randomly assigned as per dialysis shift to the following: Dedicated Dietitian (DD) (n = 133) and Existing Practice (EP) (n = 138) protocols. Cluster B patients (n = 299) received Trained Hospital Dietitian (THD) protocol. Dietitians of the DD and THD groups were trained by the research team on Kidney Disease Outcomes Quality Initiative nutrition guidelines. DD protocol included: individualized nutrition education for 2 hours/month/HD patient for 6 months focusing on renal osteodystrophy and using the Trans-theoretical theory for behavioral change.
EP protocol included nutrition education given to patients by hospital dietitians who were blinded to the study. The THD protocol included nutrition education to patients given by hospital dietitian as per the training received but within hospital responsibilities, with no set educational protocol or tools. Baseline data revealed that 40% of patients were hyperphosphatemics (> 5.5 mg/dl) with low dietary adherence and knowledge of dietary P restriction in addition to inadequate daily protein intake (58.86% ± 33.87% of needs) yet adequate dietary P intake (795.52 ± 366.94 mg/day).
Quality of life (QOL) ranged from 48-75% of full health. Baseline differences between the 3 groups revealed significant differences in serum P, malnutrition status, adherence to diet and P chelators and in 2 factors of the QOL: physical and social functioning. The data show room for improvement in the nutritional status of the patients. The NEMO trial may be able to demonstrate a better nutritional management of HD patients Key Words: Hemodialysis, osteodystrophy, nutrition, education, Lebanon
Introduction14)
The prevalence of chronic kidney disease (CKD) is increasing worldwide [1], and the situation is not different in Lebanon. The number of hemodialysis (HD) patients rose from 2,500 in 2010 [2] to 3,625 in 2013 [3], a considerable increase for a small population of 4.14 million [4].
The lack of adherence to medical nutrition therapy (MNT) among HD patients is related to a wide range of complications such as hyperphosphatemia, Chronic Kidney Disease- Mineral and Bone Disorder (CKD-MBD), cardiovascular disease, morbidity, and considerable loss of quality of life, just to name a few [5].
This in turn produces increased health care costs [5]. Literature shows that only 36% of the HD patients are able to adhere to the MNT guidelines [6] and as low as 43% in one important aspect: phosphorus (P) intake recommendations [5]. A study conducted in Lebanon on 122 HD stable patients showed that 57% of them has a serum P > 5.5 mg/dl indicating the lack of adherence [7]. Reported predictors of non-adherence were gender, age, years on dialysis, patient and staff education level, physical
limitations, financial limitations, inadequate staffing, and the patient’s willingness to cooperate with the staff [8].
Self-management focused counseling (SMFC), an individua- lized intervention based on the cognitive behavioral therapy approach, has been shown to increase patient adherence to nutritional and medical therapy [8]. Success of such program depends on its integration in the usual practical care of the dialysis units and staff. Moreover, a recent evidence based guideline highlighted the necessity of “minimum dietitian-patient” time of two hours per month for up to one year to achieve adequate self-management for all aspects of medical nutrition therapy (MNT) for HD [9].
HD units in Lebanon are exclusively hospital based, and the dietetic services in these units are provided by the general hospital dietitians who are overloaded with the hospital work and not trained for the specific needs of HD patients [10].
Resource and compensation limitations inadvertently force the decision not to have a dedicated renal dietitian, a situation prevalent in most developing countries [11].
The objective of the Nutritional Education for Management
This work was supported by the National Council for Scientific Research (CNRS), Lebanon.
§Corresponding Author: Mirey Karavetian, Tel. 971-562446865, Fax. 971-44021018, Email. [email protected] Received:January 22, 2013, Revised: December 26, 2013, Accepted: December 26, 2013
ⓒ2014 The Korean Nutrition Society and the Korean Society of Community Nutrition
This is an Open Access article distributed under the terms of the Creative Commons Attribution Non-Commercial License (http://creativecommons.org/licenses/by-nc/3.0/) which permits unrestricted non-commercial use, distribution, and reproduction in any medium, provided the original work is properly cited.
of Osteodystrophy (NEMO) trial was to determine the value of a trained dedicated dietitian in the HD unit on patient clinical outcomes and the quality of life parameters in Lebanon, compared to 2 situations: 1) existing practice; 2) the practice of trained hospital dietitian who are occupied with hospital duties, with the goal of providing a basis for national health care policy change in nutritional management of HD patients. In this paper, we will explain the study design, methodology and present baseline patient characteristics.
Subjects and Methods
The study was a multicenter randomized controlled trial with parallel-group interventions. Study implementation involved three steps: (1) Sample determination and randomization of HD units and patients; (2) Staff training and development of patient education material; (3) Conduct of study and data collection. This paper will elaborate on the first two steps and present baseline results from the third step. The study had 3 protocols applied in 2 clusters of dialysis units. Cluster A consisted of 2 protocols:
Dedicated Dietitian (DD) management of Osteodystrophy compared to Existing Practice (EP). Cluster B consisted of Trained Hospital Dietitian (THD) Management of Osteodystrophy.
Cluster A: The aim of this cluster was to identify the effect of a dedicated competent dietitian, externally assigned to the study HD unit, on the dietary behaviour of HD patients related to CKD-MBD management. Patients in each HD unit of Cluster A were randomly divided as per their HD shifts and assigned to the DD or the EP group. This cluster based randomization method has been proven to be adequate for patient oriented education studies in HD centres, since it minimizes diffusion of information from one group to another and prevents contami- nation [12]. Hospital staff (physicians, dietitians, nurses) were conveyed the general aim of the study protocol for ethical reasons, but they were blinded to the specific patient oriented dietary education, outcome assessors and data analysis. The EP group was considered as the waiting controls. The research team planned to provide them with the intervention educational material after the completion of all the phases of the study.
Details of the DD protocol are explained later in the paper.
Cluster B: The aim of this cluster was to assess whether providing equal training on MNT standards of CKD-MBD to the hospital dietitian can be a viable low cost alternative for having a dedicated dietitian; thus, the study group was labelled as THD, bearing in mind that the hospital dietitian had many responsibilities set by the hospital other than the management of the HD patients. There was no control group in this cluster, as it is not ethical to expect the hospital dietitian to offer two different standards of care within the same institution
Randomization of the HD units recruited to the study was done in a way to represent the situation of Lebanon. As per the ministry of public health in Lebanon, HD units are divided into 3 pools
based on their size: small (30-49 patients), medium (50-99 patients) and large (≥ 100 patients). Thus, units were randomly selected such that all 3 pools were represented in each of the two clusters A and B: one large, two medium and three small.
This step was intended to adjust for potential institutional, practice, logistic, staffing and economic issues that may differ by unit size.
Sample determination and randomization of HD units and patients
Sample size was determined according to change in serum P, the main objective outcome of this study. We based our calcula- tions on the data retrieved from our pilot study [7] where serum P changed significantly from 6.54 to 5.39 mg/dl ( ± 2.0 mg) in the DD intervention group and from 6.16 to 6.51 mg/dl ( ± 1.5 mg) in the control group with no statistical significance. To generate a similar significant effect of the prior in Cluster A of this study, a sample size of 50 patients in each of the intervention and control groups was estimated to achieve 80% power at a 5% alpha. As for cluster B group, we multiplied the above number of patients by 2, expecting a drop in effect size in this protocol.
Subsequently, the sample size for each group was multiplied by 3 to account for the 3 different sizes of the participant HD units, and by an additional 20% to compensate for refusals, loss to follow up, and drop-outs. This summed up to a sample of n = 360 for cluster A divided into (Dedicated Dietitian group:
n = 180 and EP group: n = 180) and another 360 patients for THD group and thus, a theoretical total sample size of 720 patients.
Inclusion criteria: HD patient of Lebanese origin, free of life-threatening acute disease, with a life expectancy > 6 months, on HD ≥ 3 months, adult (age: ≥ 18 years), at their full capacity of cognitive, psychiatric and physical ability for self-care and communication, capable to communicate either verbally or through writing, fully aware of the procedure of the study, and able to provide a consent form. Patients who did not meet all inclusion criteria were excluded.
The NEMO trial was conducted according to the guidelines laid down in the Declaration of Helsinki and all procedures involving human subjects were approved by the institutional review board approvals by each participating institution. The consent also included permission to review the medical chart for demographic information and current laboratory values.
Confidentiality and anonymity were maintained by use of coding.
Staff Training
DD group: Five research dietitians of graduate level were externally recruited and trained by the principal investigator (PI) during a 2 months period on MNT standards for HD patients according to KDOQI nutrition standards. Details of the training will be described in future publications by our team.
Fig. 1. Flow chart of study design
EP group: Hospital dietitians of the HD units assigned to this group blinded to the study continued to provide routine dietetic care.
THD group: Hospital dietitians of HD units assigned to this group received the same 2 months training by the PI as that of the DD group.
Patient Education Material Development
Patient education material was developed on the basis of the Trans-theoretical Model (TTM) [13] and designed as proposed in the study of Finckenor et al. [14]. It was divided into 3 sections: pre-action (pre-contemplation, contemplation, and preparation), action and maintenance. Each section included many lessons, which were repeated in each section with a different approach. Materials used were: pamphlets, posters, booklet of alternatives to high P foods and recipe books. Details of the educational material will be described in a different paper by the same authors in the near future.
Conduct of study and data collection
DD Group: Each patient in this group received an indivi- dualized, twice a week, 15 minute education for 6 months, to a total of 12 hours of education in accordance with the 2 hour per months recommendation by the Academy cd Nutrition and dietetics [9]. The education was provided by the 5 research renal dietitians in 6 HD units. Two of the units had less than 30 patients for which 1 dietitian was sufficient to manage both units.
EP Group: Patients of this group continued to receive education from hospital dietitians as per existing practice. These dietitians were blinded to the study.
THD Group: Patients in this group received education by the hospital dietitian as per the latter’s availability. The hospital dietitian, after being trained by the PI, was left free to provide education during the 6 months of the study on her own initiative and was informed that her visits documented in the patient files would be monitored by the PI.
The study had 3 phases: baseline (t1), intervention (t2) and follow-up (t3) where each of the latter 2 had 6 months duration.
The aim of the 6 months duration of the intervention was to facilitate behavioral change to take place as per the recommen- dation of Prochaska [13] and the aim of the 6 months follow up post intervention was to determine whether the patients had maintained their stage of behavioral change or relapsed. The 6 months follow up period is the duration of follow up in most nutrition education intervention studies in CKD (medium term) and considered to be effective [15]. During the follow up period the research team had no contact with any of the participants.
Data collection
The study was evaluated using objective and subjective tools.
The objective ones included data from the medical chart: demo- graphics, biochemical markers (calcium, phosphorus, parathyroid hormone) and the frequency of dietitian’s visits per patient (Diet Consults). All of these parameters, except the demographics, were collected and monitored at 3 time points: Baseline (t1: average of 6 months preceding the education), post-intervention (t2: average of 5 months during the education and 1 month immediately after the education) and follow up (t3: average of 6 months after the education). The protocol of the study is illustrated in Fig. 1.
As for subjective tools, 5 questionnaires were used in this study. Each questionnaire was conducted for each patient at 3 different times during the study (t1, t2, t3). Only two questionnaires were administered per visit to each patient in order to prevent answering bias.
The Knowledge questionnaire (KnQ) was adapted from Ford et al. [16]. With 18 questions, it assessed the patient’s knowledge about kidney disease, renal diet, phosphate binders, vitamin D therapy and their perception of the importance of diet in their treatment. The total score ranged from 0-18 which was converted into a percentage, where a cut-off score of 60 % indicated sufficient knowledge.
Dietary non-adherence questionnaire (DnAQ) was adapted from the SPAN (School Physical Activity and Nutrition) [17].
It consisted of 12 items that reflect the patients’ dietary intake of high phosphorus foods for the past day. The total score ranged from 0 to 36, with higher scores indicating lower adherences.
Stages of Behavioral Change (SBehCh) towards P restricted diet (SBehCh-P) and for P binder (SBehCh-PB) intake were assessed using the decision tree as described in the trans- theoretical model, adopted from Welch [18]with no translation.
Only the components were modified to address P issues; a dietary P intake between 800-1,000 mg and a P/protein ratio < 13, in addition to having a serum P between 3.5 and 5.49 mg/dl, was
Fig. 2. Attrition data of the study
set as the criterion of adherence. The tool assigned patients to one of the following stages with their respective scores:
pre-contemplation (1), contemplation (2), preparation (3), action (4) or maintenance (5); the higher the score was for each patient, the more readiness to change on their part.
Dietary P and protein intake: The actual dietary phosphorus (mg) and the protein (g) intake was collected by a 3 time 24 hour recall and calculated using the renal exchange system and the USDA database. The mean of the 3 times was used to estimate the actual intake.
Daily Protein (%) Consumed: The daily protein need was calculated (1.2 g/kg SBW) after which the % protein intake was estimated (actual protein (g) intake /daily protein (g) needs *100).
Malnutrition Inflammation Score (MIS): This is a compr- ehensive scoring system [19] with significant associations with prospective hospitalization and mortality as well as measures of nutrition, inflammation, and anemia in HD. MIS has 10 components, each with four levels of severity from 0 (normal) to 3 (severely abnormal). The sum of all 10 MIS components ranges from 0 (normal) to 30 (severely abnormal); a higher score reflects more severe degree of malnutrition and inflammation.
The scoring sheet consists of four sections
Quality of life (QOL) was measured with the short-form health survey (SF-36) [20]. It assessed 8 health concepts: physical functioning, usual role and social activities, bodily pain, general mental health and general health. Patients were presented Likert scale type items. The final score for each concept ranges between 0 (death) and 100 (full life).
The Arabic, culture specific, and validated version of KQ, DNAQ [7] and QOL [21] was used.
None of the authors had any relationship with private companies with financial interest in the information contained in the manuscript.
Statistical analysis
All statistical analyses were conducted using the Statistical Package for the Social Sciences (SPSS). A .05 significance level was utilized for strength of association to guarantee 95%
confidence level. Descriptive analysis was conducted, categorical data were reported as frequencies and percentage counts: contin- uous data as means ± standard deviation (SD). Pearson’s Chi Square (Χ2) was used to show group differences for categorical variables. ANOVA and Duncan’s post hoc test was done to detect group differences for continuous data.
Results
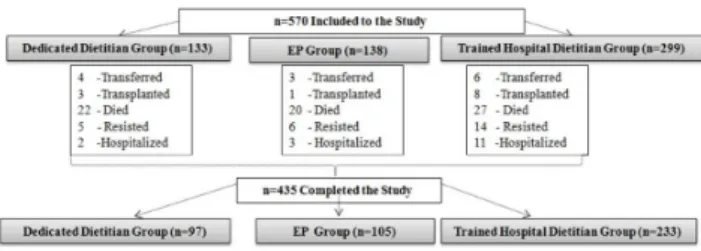
A total of 720 patients participated in the study; 570 of those met the inclusion criteria and were assigned to the 3 study groups:
DD (n = 133), EP (n = 138) and THD (n = 299). The number of participants who completed the study was 435; this attrition rate
was due to transfer of patients into another dialysis unit, transplantation, patient resistance, hospitalization, and death (Fig. 2).
Baseline Sample Characteristics
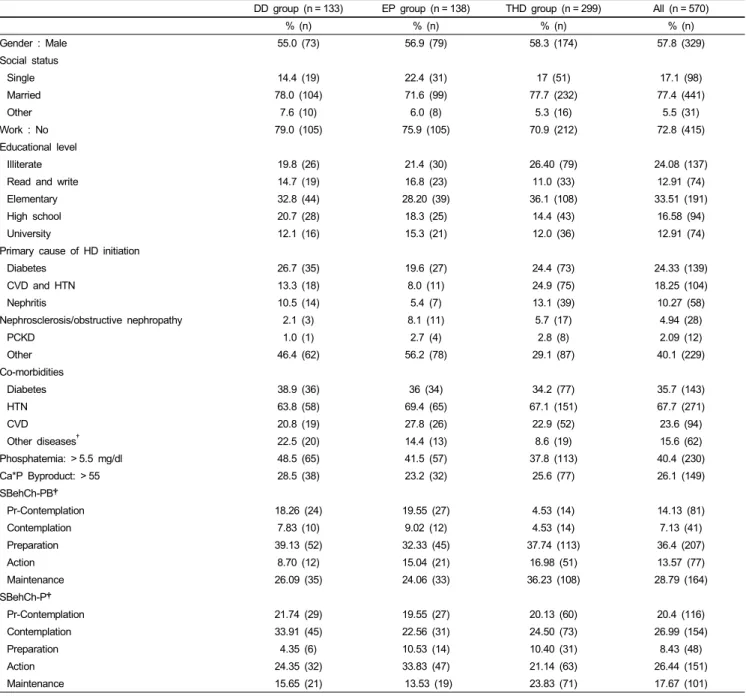
A descriptive analysis of baseline data (Tables 1 and 2) showed that 57.8% of the population was male with a mean age of 59.28 and mean BMI of 25 kg/m2.The majority of the patients were married (77.4%), unemployed (72.8%) with an elementary education level (33.5%). Most of the patients had hypertension (67.7%). Diabetes was the most common primary cause of HD initiation (24.4%) followed by CVD and hypertension (18.25%).
The average frequency of hospital dietitian’s visit was less than 1 time per patient within the 6 months prior to the study. The biochemical parameters showed that 40.4% of the population suffered from hyperphosphatemia and 26.1% had a Ca*P byproduct higher than 55 mg2/dl2. The mean value of PTH was also elevated. Our population consumed 58.9% of their daily protein needs and the mean dietary phosphorus intake was below the daily recommendations.
Baseline differences between the 3 study groups
A between group analysis showed a significant difference between the 3 groups at baseline (Tables 1 and 2) regarding the SBehCh-PB scores X2 (8) = 36.55, P < 0.001, and the SBehCh-P scores X2 (8) = 19.56, P < 0.05. A 2 by 2 group X2 comparison revealed that significant differences were caused by the THD.
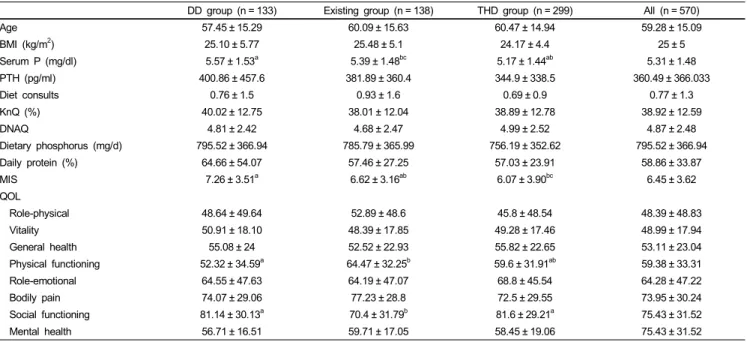
Among the comorbidities that the patients suffered from, there were no differences between the major categories (diabetes, hypertension, cardiovascular disease), but there was a significant difference in the “other disease” category, which were all the other infrequent conditions that the patients had, grouped into one group. Moreover, DD group had 3 significant differences compared to the other groups: serum P and MIS score was higher while QOL: Physical functioning (PF) was lower. The EP group had a significantly lower QOL: Social functioning (SF) score when compared to the rest of the study groups.
Discussion
The objective of the NEMO trial was to determine the role
DD group (n = 133) EP group (n = 138) THD group (n = 299) All (n = 570)
% (n) % (n) % (n) % (n)
Gender : Male 55.0 (73) 56.9 (79) 58.3 (174) 57.8 (329)
Social status
Single 14.4 (19) 22.4 (31) 17 (51) 17.1 (98)
Married 78.0 (104) 71.6 (99) 77.7 (232) 77.4 (441)
Other 7.6 (10) 6.0 (8) 5.3 (16) 5.5 (31)
Work : No 79.0 (105) 75.9 (105) 70.9 (212) 72.8 (415)
Educational level
Illiterate 19.8 (26) 21.4 (30) 26.40 (79) 24.08 (137)
Read and write 14.7 (19) 16.8 (23) 11.0 (33) 12.91 (74)
Elementary 32.8 (44) 28.20 (39) 36.1 (108) 33.51 (191)
High school 20.7 (28) 18.3 (25) 14.4 (43) 16.58 (94)
University 12.1 (16) 15.3 (21) 12.0 (36) 12.91 (74)
Primary cause of HD initiation
Diabetes 26.7 (35) 19.6 (27) 24.4 (73) 24.33 (139)
CVD and HTN 13.3 (18) 8.0 (11) 24.9 (75) 18.25 (104)
Nephritis 10.5 (14) 5.4 (7) 13.1 (39) 10.27 (58)
Nephrosclerosis/obstructive nephropathy 2.1 (3) 8.1 (11) 5.7 (17) 4.94 (28)
PCKD 1.0 (1) 2.7 (4) 2.8 (8) 2.09 (12)
Other 46.4 (62) 56.2 (78) 29.1 (87) 40.1 (229)
Co-morbidities
Diabetes 38.9 (36) 36 (34) 34.2 (77) 35.7 (143)
HTN 63.8 (58) 69.4 (65) 67.1 (151) 67.7 (271)
CVD 20.8 (19) 27.8 (26) 22.9 (52) 23.6 (94)
Other diseases† 22.5 (20) 14.4 (13) 8.6 (19) 15.6 (62)
Phosphatemia: > 5.5 mg/dl 48.5 (65) 41.5 (57) 37.8 (113) 40.4 (230)
Ca*P Byproduct: > 55 28.5 (38) 23.2 (32) 25.6 (77) 26.1 (149)
SBehCh-PB†
Pr-Contemplation 18.26 (24) 19.55 (27) 4.53 (14) 14.13 (81)
Contemplation 7.83 (10) 9.02 (12) 4.53 (14) 7.13 (41)
Preparation 39.13 (52) 32.33 (45) 37.74 (113) 36.4 (207)
Action 8.70 (12) 15.04 (21) 16.98 (51) 13.57 (77)
Maintenance 26.09 (35) 24.06 (33) 36.23 (108) 28.79 (164)
SBehCh-P†
Pr-Contemplation 21.74 (29) 19.55 (27) 20.13 (60) 20.4 (116)
Contemplation 33.91 (45) 22.56 (31) 24.50 (73) 26.99 (154)
Preparation 4.35 (6) 10.53 (14) 10.40 (31) 8.43 (48)
Action 24.35 (32) 33.83 (47) 21.14 (63) 26.44 (151)
Maintenance 15.65 (21) 13.53 (19) 23.83 (71) 17.67 (101)
Data are expressed in frequencies and parentages.
†Indicates a difference between the groups.
HD, hemodialysis; CVD, cardiovascular disease; HTN, hypertension; PCKD, polycystic kidney disease; Ca * P, calcium - phosphorus product; SBehCh-PB, stages of behavioral change towards phosphate binders; SBehCh-P, stages of behavioral change towards phosphorus restricted diet.
Pearson’s chi-square was used to show between group differences of the categorical data. Significance taken at P< 0.05.
Table 1. Baseline profile of study sample and groups
of a trained and dedicated dietitian in the HD unit on patient clinical outcomes and the quality of life parameters in Lebanon.
Thus, it was important to know the patient characteristics of the main intervention group and its comparators selected for our study, in addition to the presence of baseline differences between the study groups.
According to the baseline characteristics, the mean age of the population was around 60 years reflecting the aging of the dialysis population in Lebanon; this was in line with the literature
in other populations [22-24].The fact that almost 70% of our patients had a maximum of elementary level education could be a determinant of low adherence; this correlation was confirmed in Kugler et al. [25] but not found by Lam et al. [26]. The majority of the population was married, which might have given a support system to facilitate adherence to the regimen. Kaveh and Kimmel [27] showed that married HD patients had improved adherence with protein restriction but not with a low potassium diet.
DD group (n = 133) Existing group (n = 138) THD group (n = 299) All (n = 570)
Age 57.45 ± 15.29 60.09 ± 15.63 60.47 ± 14.94 59.28 ± 15.09
BMI (kg/m2) 25.10 ± 5.77 25.48 ± 5.1 24.17 ± 4.4 25 ± 5
Serum P (mg/dl) 5.57 ± 1.53a 5.39 ± 1.48bc 5.17 ± 1.44ab 5.31 ± 1.48
PTH (pg/ml) 400.86 ± 457.6 381.89 ± 360.4 344.9 ± 338.5 360.49 ± 366.033
Diet consults 0.76 ± 1.5 0.93 ± 1.6 0.69 ± 0.9 0.77 ± 1.3
KnQ (%) 40.02 ± 12.75 38.01 ± 12.04 38.89 ± 12.78 38.92 ± 12.59
DNAQ 4.81 ± 2.42 4.68 ± 2.47 4.99 ± 2.52 4.87 ± 2.48
Dietary phosphorus (mg/d) 795.52 ± 366.94 785.79 ± 365.99 756.19 ± 352.62 795.52 ± 366.94
Daily protein (%) 64.66 ± 54.07 57.46 ± 27.25 57.03 ± 23.91 58.86 ± 33.87
MIS 7.26 ± 3.51a 6.62 ± 3.16ab 6.07 ± 3.90bc 6.45 ± 3.62
QOL
Role-physical 48.64 ± 49.64 52.89 ± 48.6 45.8 ± 48.54 48.39 ± 48.83
Vitality 50.91 ± 18.10 48.39 ± 17.85 49.28 ± 17.46 48.99 ± 17.94
General health 55.08 ± 24 52.52 ± 22.93 55.82 ± 22.65 53.11 ± 23.04
Physical functioning 52.32 ± 34.59a 64.47 ± 32.25b 59.6 ± 31.91ab 59.38 ± 33.31
Role-emotional 64.55 ± 47.63 64.19 ± 47.07 68.8 ± 45.54 64.28 ± 47.22
Bodily pain 74.07 ± 29.06 77.23 ± 28.8 72.5 ± 29.55 73.95 ± 30.24
Social functioning 81.14 ± 30.13a 70.4 ± 31.79b 81.6 ± 29.21a 75.43 ± 31.52
Mental health 56.71 ± 16.51 59.71 ± 17.05 58.45 ± 19.06 75.43 ± 31.52
Data are expressed as mean ± SD.
abcValues in the same row with the different superscripts are significantly different at P< 0.05 based on one way ANOVA and Duncan’s post hoc test.
BMI, body mass index; pth, parathyroid hormone; KnQ, knowledge questionnaire; DNAQ, dietary non-adherence questionnaire; MIS, malnutrition inflammation score.
Table 2. Study parameters of the 3 groups
Unemployment rate was quite high (70%) among our patients, for which the patients explained to be due to the lack of support from employers on work shifts that would include frequent absenteeism due to HD session; this was also reported in the literature [28]. In addition to factors specific to the Lebanese culture, whereby the sick and the old are immediately considered the responsibility of the family; there is no health care system that covers their needs. Moreover Muehrer et al. [28] reported that existing co-morbid conditions and symptoms associated with renal failure can negatively affect a person’s ability to work.
The majority of our patients had a Ca*P byproduct higher than the normal range set by the KDOQI guideline. Even though this finding was in line with other studies [29,30] , it was in contrast with a study done on a small sample of Asian population [31]
whereby the authors contributed the controlled serum Ca*P byproduct to the over suppression of PTH by the medical team.
It is worth mentioning that elevated Ca*P byproduct is associated with morbidities such as cardiovascular and systemic calcification [32,33]. Almost 40% of patients in all study groups suffered from hyperphosphatemia which can be considered an indicator of poor management of osteodystrophy, as suggested by Qunibi [32].
This poor management was even more evident with the elevated mean value of PTH of our sample when compared to the normal range (150-300 pg/ml) set by the KDOQI guidelines; this situation was in line with the literature [30,23].The consequences of high PTH are bone demineralization, increasing risk of fractures and extra-skeletal calcification [34]. The fact that the DD group had a significantly higher serum P than EP and THD group indicates that they could require more effort to normalize, hence a higher challenge to demonstrate the effectiveness of the
intervention. This difference was not known by the study team until after the intervention period was over and half way through the follow up, so it should not impact any bias in the conduct of intervention.
The lack of sufficient dietetic counseling by the hospital dietitians for each patient was explained by Karavetian et al.
[10], where it was evident that dietetic services in all Lebanese HD units were provided by general hospital dietitians who were:
1) not trained to the specific needs of HD patients, 2) had inadequate knowledge of the nutrition management guidelines of HD patients, 3) were not required by their job description to be fully dedicated to these patients, 4) were understaffed and 5) had a high load of other nutritional and dietetic duties in the hospital.
The results of the KnQ showed that the 3 groups of the study had an insufficient knowledge which was in line with the findings of other studies [35,36]. However, this was in contrast to the finding of a cross-sectional study in Portugal in which the patients’ knowledge score was found to be adequate (79%). The main difference of this group to the population of most studies was the relatively young age (mean 49 years) and higher education (mean 7 years of schooling) [37].
Study participants scored low on the DNAQ indicating sufficient adherence to phosphorus intake recommendations. We speculate that these results were false positive. Our patients had trouble meeting their daily protein needs (< 60% of daily protein needs) and since P is found in foods rich in protein, our patients unintentionally consumed a diet low in P (mean < 800 mg/d).
Inadequate protein intake among HD patients is directly correlated with malnutrition; a dangerous, yet highly prevalent condition
among HD patients [38-40]. The ideal method of managing this protein to P balance is choosing foods high in protein yet low in P [41], which can be achieved only by special education. In the literature, low adherence to diet restrictions, in particular to phosphorus, was prevalent [5,6].
As for SBehCh towards P restricted diet and for P binder intake, our patients were mainly in the pre-action stage which was in line with the findings of other studies [14,42], whereby the majority of patients with a problem in health behavior were in the pre-action stage (pre-contemplation, contemplation, prepara- tion). This may be explained by the fact that in traditional education programs, all patients are given instructions on how to change their lifestyle, without assessing whether they are ready to change, which results in resistance on part of the patient to the program and the lack of progress in the behavioral [14].
Moreover, the analysis for between group differences revealed that the THD group was significantly different from the other 2 groups in SBehCH-P and SBehCH-PB outcomes. This diffe- rence could be attributed to the higher percentage and frequency of patients I the “maintenance stage” in this group for both variables. Even though the selection of units was done through a randomization process, after entering the hospitals and meeting the staff, the research team noticed that out of the 6 HD units in this cluster, 3 were much better managed by their medical team than all the other units in the study in both clusters;
moreover, one of these 3 units had the highest rate of transplant in the country. One of the major eligibility criteria for renal transplant is for the patient to achieve optimal blood profile. The high rate of renal transplant of this unit may propose that 1) the patient management techniques of this one unit were significantly better, 2) thus the patients had higher compliance to therapy indicated by higher “maintenance stage”. These 3 units may have pushed up the rates of “maintenance” patients in the cluster B.
The results of the MIS showed that the population was mildly malnourished. Our patients were not different from the ones reported in the literature, where it was evident that the malnutrition-inflammation syndrome is common among HD patients and may correlate with increased morbidity and mortality [19,43]. In cross-sectional study conducted in an HD unit in Jordan, 38.2% of patients were well nourished; the authors noted older age and HD vintage to be inversely correlated with nutritional status [44].
Globally, low QOL is prevalent among HD patients with a rate of 40-70% of full health [45] while a rate of 38-53% is prevalent in Iran, a neighboring country [46]. Our patients' QOL ranged from 48-75%, indicating similarity with the general population of the published studies, thus facilitating future comparisons. Multiple co-morbidities, polypharmacy and dialysis vintage have been shown to depress QOL [47,48]
This study can serve as a developing country model. The baseline findings reveal a room for improvement among the Lebanese HD patients regarding osteodystrophy management and
relevant biochemical, clinical and the quality of life outcomes, justifying an effort to improve nutritional advice. Moreover, differences among the 3 study groups at baseline were minimal, showing adequate randomization , low risk of bias between groups and homogenousity of medical management of these patients across different HD units. Finally, our patients’ charac- teristics seem to be comparable to patients of the literature, which would facilitate evaluation of 18 months long full scale study, according to which a possible platform can be built for future improvement in policies governing dietetic management of HD patients in Lebanon.
Acknowledgments
The study was under the patronage of the Lebanese Ministry of Public Health. The project was supported by the National Council for Scientific Research, Lebanon. The nutrition department of faculty of sciences in Lebanese University provided graduate students who helped with data collection. Ahmad Abdallah developed software to facilitate data entry. Special thanks to the staff and patients in each participating unit for facilitating the process.
References
1. Lebanese National Kidney Registry (LB). Lebanese National Kidney Registry [Internet]. Lebanon: Lebanon Society of Nephro- logy and Hypertension; 2012 [cited 2014 Jan 15] Available from:
http://kidneyregistrylb.com/pages/wp-content/uploads/2013/09/Up load-NKRCh319Sep13.pdf.
2. Eknoyan G, Lameire N, Barsoum R, Eckardt KU, Levin A, Levin N, Locatelli F, MacLeod A, Vanholder R, Walker R, Wang H.
The burden of kidney disease: improving global outcomes.
Kidney Int 2004;66:1310-4.
3. Mallat S, Hatoum A, Kabalan S, Elzein H, Abdallah A. 183 demographic and clinical profile of patients initiated on hemo- dialysis in lebanon. Am J Kidney Dis 2011;57:B62.
4. Central Intelligence Agency (US). The World Factbook [Internet].
Washington D.C.: Central Intelligence Agency; 2012 [cited 2014 Jan 15]. Available from: https://www.cia.gov/library/publications/
the-world-factbook/geos/le.html.
5. Denhaerynck K, Manhaeve D, Dobbels F, Garzoni D, Nolte C, De Geest S. Prevalence and consequences of nonadherence to hemodialysis regimens. Am J Crit Care 2007;16:222-35.
6. Lee SH, Molassiotis A. Dietary and fluid compliance in Chinese hemodialysis patients. Int J Nurs Stud 2002;39:695-704.
7. Karavetian M, Ghaddar S. Nutritional education for the manage- ment of osteodystrophy (nemo) in patients on haemodialysis: a randomised controlled trial. J Ren Care 2013;39:19-30.
8. Richard CJ. Self-care management in adults undergoing hemo- dialysis. Nephrol Nurs J 2006;33:387-94.
9. American Dietetic Association's Evidence Analysis Library (US).
Is MNT Provided by a Registered Dietitian for Chronic Kidney Disease (CKD) in Adults Effective?. Chicago (IL): American Dietetic Association's Evidence Analysis Library; 2010.
10. Karavetian M, Elzein H, Hwalla N, de Vries N. Dietetic practices in hemodialysis units in lebanon and their conformity with KDOQI nutrition guidelines. Int J Health Nutr 2013; 4:1-8.
11. Gregory MC. Cost-effective dialysis for the developing world.
Ethn Dis 2009;19:S1-65-7.
12. Griva K, Mooppil N, Seet P, Krishnan DS, James H, Newman SP. The NKF-NUS hemodialysis trial protocol - a randomized controlled trial to determine the effectiveness of a self mana- gement intervention for hemodialysis patients. BMC Nephrol 2011;12:4.
13. Prochaska JO. Decision making in the transtheoretical model of behavior change. Med Decis Making 2008;28:845-9.
14. Finckenor M, Byrd-Bredbenner C. Nutrition intervention group program based on preaction-stage-oriented change processes of the Transtheoretical Model promotes long-term reduction in dietary fat intake. J Am Diet Assoc 2000;100:335-42.
15. Mason J, Khunti K, Stone M, Farooqi A, Carr S. Educational interventions in kidney disease care: a systematic review of randomized trials. Am J Kidney Dis 2008;51:933-51.
16. Ford JC, Pope JF, Hunt AE, Gerald B. The effect of diet education on the laboratory values and knowledge of hemo- dialysis patients with hyperphosphatemia. J Ren Nutr 2004;14:
36-44.
17. Hoelscher DM, Day RS, Kelder SH, Ward JL. Reproducibility and validity of the secondary level School-Based Nutrition Moni- toring student questionnaire. J Am Diet Assoc 2003;103:186-94.
18. Welch JL. Hemodialysis patient beliefs by stage of fluid adherence. Res Nurs Health 2001;24:105-12.
19. Kalantar-Zadeh K, Kopple JD, Block G, Humphreys MH. A malnutrition-inflammation score is correlated with morbidity and mortality in maintenance hemodialysis patients. Am J Kidney Dis 2001;38:1251-63.
20. Ware JE Jr, Sherbourne CD. The MOS 36-item short-form health survey (SF-36). I. Conceptual framework and item selection. Med Care 1992;30:473-83.
21. Sabbah I, Drouby N, Sabbah S, Retel-Rude N, Mercier M.
Quality of life in rural and urban populations in Lebanon using SF-36 health survey. Health Qual Life Outcomes 2003;1:30.
22. Shaw-Stuart NJ, Stuart A. The effect of an educational patient compliance program on serum phosphate levels in patients recei- ving hemodialysis. J Ren Nutr 2000;10:80-4.
23. Reddy V, Symes F, Sethi N, Scally AJ, Scott J, Mumtaz R, Stoves J. Dietitian-led education program to improve phosphate control in a single-center hemodialysis population. J Ren Nutr 2009;19:314-20.
24. Rambod M, Peyravi H, Shokrpour N, Sareban MT. Dietary and fluid adherence in Iranian hemodialysis patients. Health Care Manag (Frederick) 2010;29:359-64.
25. Kugler C, Maeding I, Russell CL. Non-adherence in patients on chronic hemodialysis: an international comparison study. J Nephrol 2011;24:366-75.
26. Lam LW, Twinn SF, Chan SW. Self-reported adherence to a therapeutic regimen among patients undergoing continuous ambulatory peritoneal dialysis. J Adv Nurs 2010;66:763-73.
27. Kaveh K, Kimmel PL. Compliance in hemodialysis patients:
multidimensional measures in search of a gold standard. Am J Kidney Dis 2001;37:244-66.
28. Muehrer RJ, Schatell D, Witten B, Gangnon R, Becker BN, Hofmann RM. Factors affecting employment at initiation of dialysis. Clin J Am Soc Nephrol 2011;6:489-96.
29. Ashurst Ide B, Dobbie H. A randomized controlled trial of an educational intervention to improve phosphate levels in hemodialysis patients. J Ren Nutr 2003;13:267-74.
30. Sun CY, Chang KC, Chen SH, Chang CT, Wu MS. Patient education: an efficient adjuvant therapy for hyperphosphatemia in hemodialysis patients. Ren Fail 2008;30:57-62.
31. Lim S, Gun NT. Secondary hyperparathyroidism and calcium phosphate control in a hemodialysis population. Acta Med Indones 2007;39:71-4.
32. Qunibi WY. Consequences of hyperphosphatemia in patients with end-stage renal disease (ESRD). Kidney Int Suppl 2004:S8-12.
33. Block GA, Klassen PS, Lazarus JM, Ofsthun N, Lowrie EG, Chertow GM. Mineral metabolism, mortality, and morbidity in maintenance hemodialysis. J Am Soc Nephrol 2004;15:2208-18.
34. Mayne TJ, Benner D, Ricketts K, Burgess M, Wilson S, Poole L, Smyth M, Colson C, Krishnan M. Results of a pilot program to improve phosphorus outcomes in hemodialysis patients. J Ren Nutr 2012;22:472-9.
35. Cupisti A, Ferretti V, D'Alessandro C, Petrone I, Di Giorgio A, Meola M, Panichi V, Conti P, Lippi A, Caprioli R, Capitanini A. Nutritional knowledge in hemodialysis patients and nurses:
focus on phosphorus. J Ren Nutr 2012;22:541-6.
36. Durose CL, Holdsworth M, Watson V, Przygrodzka F. Knowl- edge of dietary restrictions and the medical consequences of noncompliance by patients on hemodialysis are not predictive of dietary compliance. J Am Diet Assoc 2004;104:35-41.
37. Nerbass FB, Morais JG, dos Santos RG, Krüger TS, Koene TT, da Luz Filho HA. Adherence and knowledge about hyperphos- phatemia treatment in hemodialysis patients with hyperphos- phatemia. J Bras Nefrol 2010;32:149-55.
38. Andrew NH, Engel B, Hart K, Passey C, Beaden S. Micronu- trient intake in haemodialysis patients. J Hum Nutr Diet 2008;21:375-6.
39. Locatelli F, Fouque D, Heimburger O, Drüeke TB, Cannata- Andía JB, Hörl WH, Ritz E. Nutritional status in dialysis patients: a European consensus. Nephrol Dial Transplant 2002;
17:563-72.
40. Morais AA, Silva MA, Faintuch J, Vidigal EJ, Costa RA, Lyrio DC, Trindade CR, Pitanga KK. Correlation of nutritional status and food intake in hemodialysis patients. Clinics (Sao Paulo) 2005;60:185-92.
41. CKD mineral and bone disorder. In: McCann L, editor. Pocket Guide to Nutrition Assessment of the Patient with Chronic Kidney Disease. 4th ed. New York (NY): National Kidney Foundation; 2009. p.8.8-9.
42. Mochari-Greenberger H, Terry MB, Mosca L. Does stage of change modify the effectiveness of an educational intervention to improve diet among family members of hospitalized cardiova- scular disease patients? J Am Diet Assoc 2010;110:1027-35.
43. Rambod M, Bross R, Zitterkoph J, Benner D, Pithia J, Colman S, Kovesdy CP, Kopple JD, Kalantar-Zadeh K. Association of Malnutrition-Inflammation Score with quality of life and mortality in hemodialysis patients: a 5-year prospective cohort study. Am J Kidney Dis 2009;53:298-309.
44. Tayyem RF, Mrayyan MT. Assessing the prevalence of malnu- trition in chronic kidney disease patients in Jordan. J Ren Nutr 2008;18:202-9.
45. Kimmel PL, Emont SL, Newmann JM, Danko H, Moss AH.
ESRD patient quality of life: symptoms, spiritual beliefs, psycho- social factors, and ethnicity. Am J Kidney Dis 2003;42:713-21.
46. Aghakhani N, Samadzadeh S, Mafi TM, Rahbar N. The impact of education on nutrition on the quality of life in patients on hemodialysis: a comparative study from teaching hospitals. Saudi J Kidney Dis Transpl 2012;23:26-30.
47. Covic A, Seica A, Gusbeth-Tatomir P, Gavrilovici O, Goldsmith
DJ. Illness representations and quality of life scores in haemo- dialysis patients. Nephrol Dial Transplant 2004;19:2078-83.
48. Han H, Burrowes JD, Houser R, Chung MC, Dwyer JT. What is the impact of nutritional status on health-related quality of life in hemodialysis patients? J Ren Nutr 2012;22:237-43.