http://e-nrp.org
Associations of dietary intake and metabolic syndrome risk parameters in Vietnamese female marriage immigrants in South Korea: The KoGES follow-up study
Hyesu Yang
1*, Hyesook Kim
1*, Ji-Myung Kim
2, Hye Won Chung
3and Namsoo Chang
1§1Department of Nutritional Science and Food Management, Ewha Womans University, 52, Ewhayeodae-gil, Seodaemun-gu, Seoul 03760, Korea
2Food and Nutrition Major, Division of Food Science and Culinary Arts, Shinhan University, Gyeonggi 11644, Korea
3Department of Obstetrics and Gynecology, Ewha Womans University School of Medicine, Seoul 03760, Korea
BACKGROUND/OBJECTIVES: This study was conducted to compare the overall changes in dietary intake and metabolic syndrome risk parameters in Vietnamese marriage-based female immigrants over time.
SUBJECTS/METHODS: The subjects of this study were 581 Vietnamese marriage-based female immigrants, who were recruited from local clinical centers in Korea. Baseline data were collected from 2006-2011 and the follow-up data were collected from 2012-2014. Dietary food intake was assessed by a 1-day 24-hour recall method.
RESULTS: Compared to the baseline, the mean body weight, body mass index, waist circumference, high density lipoprotein (HDL)-cholesterol, systolic blood pressure and diastolic blood pressure increased while the fasting blood sugar, triglycerides and low density lipoprotein-cholesterol decreased at follow-up. The total consumption of foods such as vegetables/fruits/
seaweeds/mushrooms, oil and fat, and eggs decreased during the follow-up period, whereas the consumption of sugars, beverages and meats increased. Partial correlation between the rate of change [(Follow-up - Baseline) / Baseline × 100] in metabolic syndrome risk parameters and food intake after controlling for confounding factors showed that the waist circumference was positively correlated with either the total plant food intake (r = 0.1042, P = 0.0129) or the total food intake (r = 0.0880, P = 0.0359). The plasma levels of total cholesterol (r = -0.1918, P = 0.0289) and HDL-cholesterol (r = -0.1424, P = 0.0007) were negatively correlated with the percentage of total intake from plant food, and HDL-cholesterol levels were positively correlated with the intake of total animal food (r = 0.0980, P = 0.0217). The serum C-reactive protein levels were positively correlated with the total intake of animal food (r = 0.2374, P < 0.0001) or the percentage of total intake from animal food (r = 0.1346, P = 0.0016).
CONCLUSIONS: These results suggest that the change rate of dietary intake such as total plant food or animal food is associated with the change rates of metabolic syndrome risk parameters.
Nutrition Research and Practice 2016;10(3):313-320; doi:10.4162/nrp.2016.10.3.313; pISSN 1976-1457 eISSN 2005-6168
Keywords: Vietnamese immigrants, dietary change, lipid profile, metabolic syndrome, follow-up study
INTRODUCTION
9)International marriage migration has increased dramatically in Korea since the 1990s. The international marriage rate peaked at 13.6% of total marriages in 2005 and has since decreased to 8.3% in 2013. Recently, the nationalities of foreign women marrying Korean men have expanded to include women not only from China and Southeast Asian countries but also from Russia and Uzbekistan. However, Chinese women (33.1%) and Vietnamese women (31.5%) still made up the majority of these immigrant women in 2013 [1].
Immigrants face a lot of problems and culture shock is a large problem due to the language, disparate living conditions, and
the differences caused by maladjustment and discrimination, which can easily lead to emotional stress such as depression [2-5]. Such distressful situations for migrants can bring about changes in food consumption (higher energy density food intake such as snacks, lower intake of grains, and overall decreased food consumption [6]) and dietary habits (eating irregular meals and skipping breakfast [7]). In addition, many studies have reported that dietary patterns in immigrants change through acculturation [8-11] although this may not be related to stress.
These dietary changes in immigrant women are an important issue because inadequate nutritional status in women of reproductive age affects women’s health status, pregnancy and
This work was supported by the Research Program funded by the Korean Centers for Disease Control and Prevention (2006-E71017-00, 2007-E71007-00, 2008-E71002-00, 2009-E71003-00, 2010-E71002-00, 2011-E71003-00, 2012-E71006-00, 2013-E71002-00, 2014-E71001-00) and Brain Korea 21 Plus.
§Corresponding Author: Namsoo Chang, Tel. 82-2-3277-3468, Fax. 82-2-3277-2862, Email. [email protected] Received: August 21, 2015, Revised: January 19, 2016, Accepted: January 21, 2016
* These authors contributed to this article equally.
This is an Open Access article distributed under the terms of the Creative Commons Attribution Non-Commercial License (http://creativecommons.org/licenses/by-nc/3.0/) which permits unrestricted non-commercial use, distribution, and reproduction in any medium, provided the original work is properly cited.
childbirth, and increases the risk of nerve damage to the fetus, premature birth and low birth weight [12]. Multiparity was associated with an increased risk of metabolic syndrome and related features [13]. Also, unhealthy eating habits are connected with the risk of metabolic obesity despite normal weight [14].
Female immigrants will become an important part of the future of Korea, in addition to being wives and mothers who will likely be responsible for their families’ diets, as they perform the primary role in maintaining the health of their children.
Despite this importance, only one follow-up study involving Vietnamese female immigrants to Korea [15] investigated changes in their dietary intake (consumption of cereal, vegetables, fruits, and total food decreased over time, whereas consump- tion of milk and dairy products increased) between baseline and follow-up periods. This previous study [15] also reported changes in anthropometric and biochemical variables such as mean skeletal muscle mass decreased, plasma high density lipoprotein-cholesterol (HDL-cholesterol) increased, and high sensitivity C-reactive protein (hs-CRP) decreased at follow-up.
However, the study did not investigate the association between changes in food intake and biochemical variables. The purpose of this study was to compare the overall changes in dietary intake, anthropometric variables and blood profiles over time, and to investigate the association between changes in food intake and metabolic syndrome risk parameters in Vietnamese female immigrants living in Korea.
SUBJECTS AND METHODS
Study subjectsThe subjects were Vietnamese marriage-based female immigrants who voluntarily participated in the Cohort of Intermarried Women in Korea. The Cohort of Intermarried Women in Korea is an ongoing, prospective, epidemiological study that is a part of the Korean Genome and Epidemiology Study (KoGES) established in November 2006 [7, 15-17]. The baseline data (n = 2,875) was collected from 2006-2011, and follow-up data was collected in 2012-2014. A total of 1,105 subjects participated during both periods (baseline and follow-up) at local clinical centers in Korea. Among these participants, 208 women of childbearing potential who did not measure the anthropometric parameters were excluded from the study. Of the remaining 897 immigrant women, subjects with the following conditions were also excluded: insufficient data on dietary intake (n = 154); energy consumption of less than 400 kcal (n = 18) or more than 3,500 kcal (n = 3); pregnant (n = 136), and outliers (n = 5). A total of 581 Vietnamese female immigrants were therefore eligible for this study. This study protocol was approved by the Human Investigation Review Board of Ewha Womans University College of Medicine (ECT 200-18 200-19).
General characteristics
The subjects were individually interviewed by trained technicians for general characteristics, and by graduate students trained in nutrition for dietary consumption and behaviors using standard protocols at baseline and follow-up. Vietnamese translators helped in the process when needed. The questi-
onnaire developed for this study also included variables for age, education, occupation, income, current alcohol consumption, smoking status, exercise and physical activity. Education status was categorized as elementary school completion or less, middle school completion, high school completion or less, and high school completion or more. Household monthly income status was classified as < $1,000, $1,000-$1,500, and > $1,500.
Alcohol drinking status was classified into current and non- drinkers. A regular exerciser was defined as a person who performed exercise regularly enough to induce sweating.
Anthropometric parameters
Anthropometric measurements were obtained by trained nurses or medical personnel. Standing height and body weight were measured using an automatic height/weight measuring instrument (Dong Sahn Jenix, Seoul, Korea). Body mass index (BMI) was calculated as kg/m2. Waist and hip circumferences were measured with a tape measure (Anthropometric tape, Preston 5193, Seoul, Korea). Body composition was assessed with an INBODY 230 (Biospace Co, Seoul, Korea). These measure- ments were taken once.
Blood profiles and blood pressure
Blood samples were obtained by medical technologists after an 8-hour overnight fast, collected in ethylenedianmine tetraacetic acid-containing tubes, and centrifuged at 3,500 rpm for 10 minutes at 4°C. Plasma samples were stored at -70°C until analysis was performed. Fasting blood sugar levels, total cholesterol, high density lipoprotein-cholesterol, and triglycerides were also measured with an autoanalyzer (ADVIA 1550, Bayer Diagnostics, Tarrytown, NY). Low density lipoprotein- cholesterol (LDL-cholesterol) was calculated as described by Friedewald as follows: LDL-cholesterol = total cholesterol - HDL-cholesterol - (triglycerides/5) [18]. Serum hs-CRP was measured with an ADVIA 1650 using an hs-CRP-Latex (II) X2 kit (Seiken Laboratories Ltd., Tokyo, Japan). Systolic and diastolic blood pressure was measured using an automatic blood pressure calculator (Jawon Medical, Gyeongsan, Korea) and read by attending medical doctors after a 10-minute rest in the sitting position. The average of two measurements was used.
Dietary intake
The dietary intake of each participant was assessed using a 1-day, 24-hour recall method by a trained interviewer who had majored in nutrition. The interviewer asked for a detailed summary of the subjects’ food and drink consumption in the last 24 hours. Food models were used to estimate portion size.
Food and nutrient intake data were analyzed using the Computer Aided Nutritional Analysis program version 3.0 software [19].
Statistical analysis
The data were expressed as the mean with standard error (continuous) or as frequencies and percentages (categorical).
Blood profiles were log transformed in order to normalize their
distributions before analysis. The differences in the categorical
variables of general characteristics between the baseline and
follow-up period were evaluated using the McNemar test. The
paired t-test was used to compare the general characteristics,
All (n = 581)
P-value Baseline Follow-up
Age (yrs) 24.7 ± 0.2 28.8 ± 0.2 < 0.00012)
Length of residence in Korea (yrs) 3.0 ± 0.1 5.2 ± 0.03 < 0.0001 Duration of follow-up (yrs) 4.1 ± 0.01
Education
≤ Elementary school 200 (34.4)
Middle school 215 (37.0)
≥ High school 156 (26.9)
No-response 10 (1.7)
Occupation
No 499 (85.9) 239 (41.1)
< 0.00013)
Yes 65 (11.2) 333 (57.3)
No-response 17 (2.9) 9 (1.6) Household monthly income (US$)
< 1,000 314 (54.0) 217 (37.4)
< 0.0001
1,000-1,500 219 (37.7) 271 (46.6)
> 1,500 30 (5.2) 77 (13.3)
No-response 18 (3.1) 16 (2.8)
Alcohol drinking
Non-drinker 548 (94.3) 467 (80.4)
< 0.0001
Current drinker 26 (4.5) 113 (19.5)
No-response 7 (1.2) 1 (0.2) Smoking status
Non-smoker 398 (68.5) 579 (99.7)
-4) Current smoker 0 (0) 1 (0.2)
No-response 183 (31.5) 0 (0.2)
Exercise
No 448 (77.1) 452 (73.2)
0.0331
Yes 124 (21.3) 154 (26.5)
No-response 9 (1.6) 2 (0.3) Physical activity
Sedentary 107 (18.4) 118 (20.3)
< 0.0001
Active 286 (49.2) 450 (77.5)
No-response 188 (32.4) 13 (2.2)
1)Values are the mean ± SE or frequency (%).
2)Measured by a paired t-test between baseline and follow-up.
3)Measured by the McNemar test.
4)Statistical tests were not conducted.
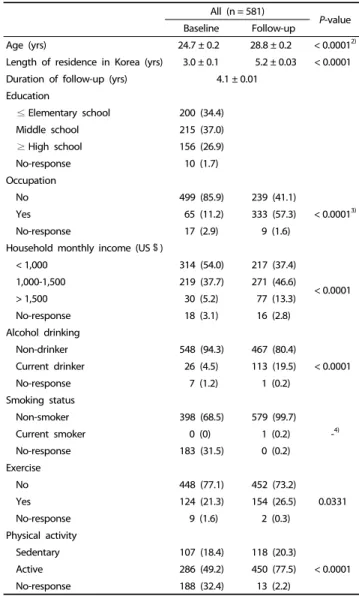
Table 1. General characteristics of Vietnamese marriage-based female immigrants at baseline and follow-up1)
daily food intake, anthropometric parameters, and blood profiles between the baseline and follow-up period. Partial correlation test was used to analyze correlations between the rate of change [(Follow-up - Baseline) / Baseline × 100] in daily food intake and blood profiles after adjustment for age, BMI, occupation, income, alcohol drinking and exercise at baseline.
All analyses were performed using the SAS 9.3 software (SAS Inc., Cary, NC, USA). All reported probability tests were two- sided, and the differences were considered significant at the 5% level.
RESULTS
General characteristics
The mean length of residence in Korea was 3.0 ± 1.2 and 5.2
± 0.9 years at baseline and follow-up, respectively. The cohort observation duration for the 581 Vietnamese subjects was 4.1
± 1.1 years. The mean age was 24.7 ± 4.0 years at baseline.
Almost 57.3 % of the subjects had a current job by the follow-up period, and the proportion was significantly higher than at baseline (11.2%, P < 0.0001). Most of the follow-up subjects had a monthly household income of $ 1,000-$ 1,500 (46.6%, P <
0.0001) (Table 1). The women included in the study did not differ from those excluded with regard to the general characteristics (data not shown).
Anthropometric parameters, blood profiles, and blood pressure
There were significant differences in the mean weight (P <
0.0001), waist circumference (P < 0.0001), and BMI (P < 0.0001).
The fasting blood sugar (P = 0.0004), triglycerides (P < 0.0001) and LDL-cholesterol (P < 0.0001) were significantly decreased during the follow-up period. In contrast, the HDL-cholesterol (P < 0.0001) was significantly increased at the follow-up. The mean systolic blood pressure (P = 0.0004) and diastolic blood pressure (P < 0.0001) were significantly increased during the follow-up period. The proportion of overweight women (BMI
≥ 23.0 kg/m
2) was 18.9 % and 23.1% at baseline and follow-up, respectively. The proportion of women with abnormal parameters (fasting blood sugar ≥ 100 mg/dl, triglycerides ≥ 150 mg/dl, total-cholesterol > 200 mg/dl, LDL-cholesterol > 130 mg/dl, HDL-cholesterol < 50 mg/dl, and C-reactive protein > 1 mg/dl) significantly decreased at follow-up, as shown in Table 2.
Daily food intake
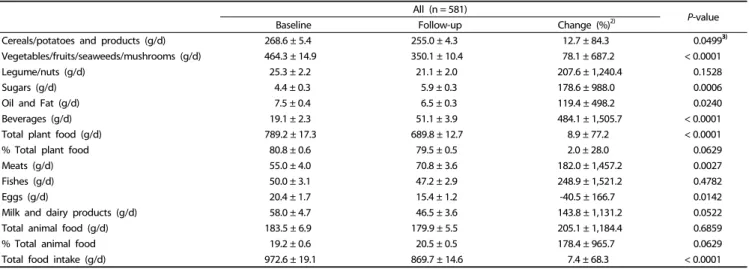
The daily food intake for the Vietnamese subjects is described in Table 3. The average total daily food intake was 972.6 ± 460.1 g/d at baseline and 869.7 ± 351.0 g/d at follow-up, showing a significant decrease during the follow-up period (P < 0.0001).
The consumption of cereals/potatoes and related products (P
= 0.0499), vegetables/fruits/seaweeds/mushrooms (P < 0.0001), oil and fat (P = 0.0240) and eggs (P = 0.0142) was significantly decreased, whereas the consumption of sugars (P = 0.0006), beverages (P < 0.0001) and meats (P = 0.0027) was significantly increased at the follow-up.
Correlation between the rate of change in daily food intake and metabolic syndrome risk parameters
We examined the correlations between food intake and
metabolic syndrome risk parameters at baseline and follow-up, respectively, after adjusting for age and BMI. At baseline, a significant positive correlation was observed between BMI and total cholesterol, triglycerides, LDL-cholesterol and serum CRP levels. This correlation was maintained during the follow-up period. Waist circumference was positively correlated with total cholesterol, triglycerides and serum CRP levels only at baseline.
Serum CRP level was negatively correlated with the percentage
of total intake from plant food and was positively correlated
with the percentage of total intake from animal food only at
baseline. Waist circumference was positively correlated with the
intake of either total plant food or total food while HDL-
cholesterol level was positively correlated with the intake of
total animal food or the percentage of total intake from animal
food only at follow-up (data not shown). There were no correla-
tions for the rate of change in anthropometric parameters,
All (n = 581)
P-value
Baseline Follow-up Change (%)2)
Cereals/potatoes and products (g/d) 268.6 ± 5.4 255.0 ± 4.3 12.7 ± 84.3 0.04993)
Vegetables/fruits/seaweeds/mushrooms (g/d) 464.3 ± 14.9 350.1 ± 10.4 78.1 ± 687.2 < 0.0001
Legume/nuts (g/d) 25.3 ± 2.2 21.1 ± 2.0 207.6 ± 1,240.4 0.1528
Sugars (g/d) 4.4 ± 0.3 5.9 ± 0.3 178.6 ± 988.0 0.0006
Oil and Fat (g/d) 7.5 ± 0.4 6.5 ± 0.3 119.4 ± 498.2 0.0240
Beverages (g/d) 19.1 ± 2.3 51.1 ± 3.9 484.1 ± 1,505.7 < 0.0001
Total plant food (g/d) 789.2 ± 17.3 689.8 ± 12.7 8.9 ± 77.2 < 0.0001
% Total plant food 80.8 ± 0.6 79.5 ± 0.5 2.0 ± 28.0 0.0629
Meats (g/d) 55.0 ± 4.0 70.8 ± 3.6 182.0 ± 1,457.2 0.0027
Fishes (g/d) 50.0 ± 3.1 47.2 ± 2.9 248.9 ± 1,521.2 0.4782
Eggs (g/d) 20.4 ± 1.7 15.4 ± 1.2 -40.5 ± 166.7 0.0142
Milk and dairy products (g/d) 58.0 ± 4.7 46.5 ± 3.6 143.8 ± 1,131.2 0.0522
Total animal food (g/d) 183.5 ± 6.9 179.9 ± 5.5 205.1 ± 1,184.4 0.6859
% Total animal food 19.2 ± 0.6 20.5 ± 0.5 178.4 ± 965.7 0.0629
Total food intake (g/d) 972.6 ± 19.1 869.7 ± 14.6 7.4 ± 68.3 < 0.0001
1)Values are the mean ± SE.
2)Rate of change (%) : [(Follow-up - Baseline) / Baseline] × 100
3)Measured by a paired t-test between baseline and follow-up.
Table 3. Daily food intake of Vietnamese marriage-based female immigrants at baseline and follow-up1) All (n = 581)
P-value
Baseline Follow-up Change (%)4)
Height (cm) 154.6 ± 0.22) 154.7 ± 0.2 0.1 ± 0.8 0.00275)
Weight (kg) 50.3 ± 0.3 51.5 ± 0.3 2.5 ± 7.6 < 0.0001
Waist circumference (cm) 70.9 ± 0.3 72.4 ± 0.3 2.4 ± 9.2 < 0.0001
Waist to hip ratio 0.8 ± 0.0 0.8 ± 0.0 2.4 ± 9.2 < 0.0001
Body mass index (kg/m2) 21.0 ± 0.1 21.5 ± 0.1 2.4 ± 7.8 < 0.0001
< 18.5 76 (13.1)3) 45 (7.8)
< 0.00016)
18.5 ≤ BMI < 23 395 (68.0) 402 (69.2)
≥ 23 110 (18.9) 134 (23.1)
Fasting blood sugar (mg/dl) 87.6 ± 0.4 86.3 ± 0.4 -1.0 ± 10.7 0.0004
< 100 542 (93.3) 563 (96.9)
0.0010
≥ 100 39 (6.7) 18 (3.1)
Triglycerides (mg/dl) 88.7 ± 2.0 79.1 ± 1.5 1.0 ± 50.6 < 0.0001
< 150 530 (91.2) 548 (94.3)
0.0244
≥ 150 51 (8.8) 33 (5.7)
Total cholesterol (mg/dl) 173.3 ± 1.4 171.0 ± 1.3 0.1 ± 15.8 0.0971
≤ 200 483 (83.1) 502 (86.4)
0.0393
> 200 98 (16.9) 79 (13.6)
LDL-cholesterol (mg/dl) 108.9 ± 1.2 99.7 ± 1.1 -6.3 ± 21.4 < 0.0001
≤ 130 469 (80.7) 515 (88.6)
< 0.0001
> 130 112 (19.3) 66 (11.4)
HDL-cholesterol (mg/dl) 46.7 ± 0.4 55.5 ± 0.5 21.7 ± 24.9 < 0.0001
> 45 293 (50.4) 464 (79.9)
< 0.0001
≤ 45 288 (49.6) 117 (20.1)
C-reactive protein (mg/dl) 1.3 ± 0.1 1.1 ± 0.1 194.2 ± 1130.2 0.0738
≤ 1 383 (65.9) 431 (74.2)
0.0004
> 1 198 (34.1) 150 (25.8)
Systolic blood pressure (mmHg) 108.7 ± 0.5 110.7 ± 0.4 2.9 ± 13.1 0.0004
< 120 479 (82.4) 472 (81.2)
0.5663
≥ 120 102 (17.6) 109 (18.8)
Diastolic blood pressure (mmHg) 63.7 ± 0.4 65.8 ± 0.3 5.4 ± 19.5 < 0.0001
< 80 550 (94.7) 545 (93.8)
0.4658
≥ 80 31 (5.3) 36 (6.2)
1)Blood profile data are log transformed.
2)Values are the mean ± SE.
3)Values are frequency (%).
4)Rate of change (%) : [(Follow-up - Baseline) / Baseline] × 100
5)Measured by a paired t-test between baseline and follow-up.
6)Measured by the McNemar test.
Table 2. Anthropometric parameters, blood profiles and blood pressure of Vietnamese marriage-based female immigrants at baseline and follow-up1)
Body mass index (kg/m2)
Waist circum- ference (cm)
Total cholesterol
(mg/dl) (n = 273)
Triglycerides (mg/dl)
LDL cholesterol
(mg/dl) HDL cholesterol
(mg/dl)
HDL/LDL ratio
C-reactive protein (mg/dl)
Systolic blood pressure (mmHg)
Diastolic blood pressure (mmHg)
Total plant food (g/d) (n = 575)
% Total plant food
(n = 575) Total animal food (g/d)
(n = 551)
% Total animal
food (n = 551)
Total food intake (g/d) (n = 575) Body mass
index (kg/m2)
r1 - 0.6361**** 0.3202**** 0.2181**** 0.3132**** -0.0390 -0.2629**** 0.0401 0.1515*** 0.1472*** 0.0505 -0.0324 -0.0083 -0.0025 0.0558 r2 - 0.6357**** 0.3179**** 0.2189**** 0.3103**** -0.0410 -0.2613**** 0.0398 0.1529*** 0.1512*** 0.0491 -0.0325 -0.0090 -0.0037 0.0547
r3 - - - - - - - - - - - - - - -
r4 - 0.6361**** 0.3183**** 0.2184**** 0.3116**** -0.0382 -0.2607**** 0.0373 0.1518*** 0.1443*** 0.0451 -0.0270 -0.0097 -0.0018 0.0472 Waist circum-
ference (cm)r1 - - 0.2051**** 0.1913**** 0.1922**** -0.0773 -0.2136**** 0.0093 0.0333 0.0271 0.1079** 0.0372 -0.0320 -0.0300 0.0920 r2 - - 0.2038**** 0.1916**** 0.1906**** -0.0784 -0.2127**** 0.0091 0.0339 0.0290 0.1072* 0.0371 -0.0324 -0.0307 0.0914*
r3 - - 0.1752**** 0.1768**** 0.1795**** -0.0969* -0.2176**** 0.0015 0.0355 0.0270 0.1096** 0.0380 -0.0348 -0.0315 0.0949*
r4 - - 0.1792**** 0.1772**** 0.1821**** -0.0928* -0.2163**** 0.0017 0.0264 0.0183 0.1042* 0.0373 -0.0339 -0.0263 0.0880*
Total cholesterol (mg/dl) (n = 273)
r1 - - - 0.1848**** 0.8736**** 0.4483**** -0.3493**** 0.0163 0.0855* 0.1088** 0.0224 -0.0892* 0.0389 0.0337 0.0531 r2 - - - 0.1856**** 0.8731**** 0.4473**** -0.3479**** 0.0159 0.0870* 0.1130** 0.0209 -0.0895* 0.0384 0.0326 0.0518 r3 - - - 0.1745**** 0.8749**** 0.4430**** -0.3516**** 0.0108 0.0885* 0.1125** 0.0207 -0.0907* 0.0379 0.0332 0.0531 r4 - - - 0.1730**** 0.8755**** 0.4483**** -0.3526**** 0.0110 0.0877* 0.1115** 0.0195 -0.0918* 0.0378 0.0320 0.0529 Triglycerides
(mg/dl) r1 - - - - -0.0238 -0.2614**** -0.1617**** 0.2990 0.1142** 0.1459*** 0.0059 0.0680 -0.0331 -0.0208 -0.0242 r2 - - - - -0.0233 -0.2613**** -0.1621**** 0.0299 0.1141** 0.1457*** 0.0061 0.0680 0.0061 -0.0331 -0.0208 r3 - - - - -0.0299 -0.2692**** -0.1625**** 0.0271 0.1148** 0.1453*** 0.0059 0.0682 -0.0339 -0.0208 -0.0238 r4 - - - - -0.0334 -0.2657**** -0.1577*** 0.0274 0.1121** 0.1421*** 0.0027 0.0665 -0.0340 -0.0213 -0.0263 LDL
cholesterol (mg/dl)
r1 - - - - - 0.1988**** -0.6155**** -0.0056 0.0357 0.0421 0.0246 -0.0665 0.0117 0.0129 0.0384
r2 - - - - - 0.1969**** -0.6148**** -0.0061 0.0375 0.0471 0.0226 -0.0668 0.0109 0.0114 0.0367
r3 - - - - - 0.1929**** -0.6162**** -0.0086 0.0378 0.0464 0.0225 -0.0670 0.0105 0.0115 0.0371
r4 - - - - - 0.2009**** -0.6153**** -0.0088 0.0360 0.0445 0.0209 -0.0700 0.0091 0.0102 0.0365
HDL cholesterol (mg/dl)
r1 - - - - - - 0.5829**** 0.0290 0.0162 0.0363 0.0022 -0.1420*** 0.0945* 0.0690 0.0724
r2 - - - - - - 0.5850**** 0.0288 0.0170 0.0385 0.0013 -0.1422*** 0.0947* 0.0684 0.0717
r3 - - - - - - 0.5867**** 0.0266 0.0172 0.0378 0.0012 -0.1425*** 0.0946* 0.0687 0.0721
r4 - - - - - - 0.5806**** 0.0286 0.0234 0.0487 0.0069 -0.1424*** 0.0980* 0.0695 0.0797
HDL/LDL
ratio r1 - - - - - - - 0.0301 -0.0122 -0.0041 -0.0218 -0.0524 0.0609 0.0342 0.0215
r2 - - - - - - - 0.0304 -0.0130 -0.0066 -0.0208 -0.0524 0.0614 0.0351 0.0224
r3 - - - - - - - 0.0305 -0.0130 -0.0065 -0.0208 -0.0524 0.0614 0.0351 0.0224
r4 - - - - - - - 0.0324 -0.0070 0.0034 -0.0155 -0.0508 0.0650 0.0360 0.0291
C-reactive protein (mg/dl)
r1 - - - - - - - - 0.0076 -0.0453 -0.0279 -0.0355 0.2390**** 0.1360** 0.0092
r2 - - - - - - - - 0.0078 -0.0450 -0.0281 -0.0355 0.2389**** 0.1358** 0.0090
r3 - - - - - - - - 0.0079 -0.0454 -0.0282 -0.0356 0.2388**** 0.1359** 0.0092
r4 - - - - - - - - 0.0081 -0.0486 -0.0266 -0.0305 0.2374**** 0.1346** 0.0082
Systolic blood pressure (mmHg)
r1 - - - - - - - - - 0.5561**** 0.0316 0.0674 -0.0181 -0.0180 0.0091
r2 - - - - - - - - - 0.5560**** 0.0322 0.0674 -0.0176 -0.0172 0.0096
r3 - - - - - - - - - 0.5561**** 0.0322 0.0674 -0.0176 -0.0172 0.0096
r4 - - - - - - - - - 0.5560**** 0.0281 0.0650 -0.0176 -0.0143 0.0051
Diastolic blood pressure (mmHg)
r1 - - - - - - - - - - 0.0057 0.0183 -0.0157 0.0200 -0.0107
r2 - - - - - - - - - - 0.0074 0.0185 -0.0148 0.0218 -0.0093
r3 - - - - - - - - - - 0.0073 0.0185 -0.0149 0.0218 -0.0093
r4 - - - - - - - - - - -0.0009 0.0238 -0.0159 0.0247 -0.0219
Total plant food (g/d) (n = 577)
r1 - - - - - - - - - - - 0.3660**** 0.0260 -0.0933* 0.8879****
r2 - - - - - - - - - - - 0.3661**** 0.0258 -0.0938* 0.8879****
r3 - - - - - - - - - - - 0.3661**** 0.0257 -0.0938* 0.8879****
r4 - - - - - - - - - - - 0.3679**** 0.0268 -0.0921* 0.8884****
% Total plant food (n = 577)
r1 - - - - - - - - - - - - -0.2395**** -0.2578**** -0.0302
r2 - - - - - - - - - - - - -0.2393**** -0.2579**** -0.0303
r3 - - - - - - - - - - - - -0.2396**** -0.2579**** -0.0303
r4 - - - - - - - - - - - - -0.2395**** -0.2590**** -0.0270
Total animal food (g/d) (n = 553)
r1 - - - - - - - - - - - - - 0.9246**** 0.1795****
r2 - - - - - - - - - - - - - 0.9246**** 0.1793****
r3 - - - - - - - - - - - - - 0.9246**** 0.1793****
r4 - - - - - - - - - - - - - 0.9254**** 0.1799****
% Total animal food (n = 553)
r1 - - - - - - - - - - - - - - 0.0142
r2 - - - - - - - - - - - - - - 0.0138
r3 - - - - - - - - - - - - - - 0.0138
r4 - - - - - - - - - - - - - - 0.0160
Total food intake (g/d) (n = 577)
r1 - - - - - - - - - - - - - - -
r2 - - - - - - - - - - - - - - -
r3 - - - - - - - - - - - - - - -
r4 - - - - - - - - - - - - - - -
1)Rate of change (%) : [(Follow-up - Baseline) / Baseline] × 100
2)r1 : Significantly different by Pearson's correlation analysis (*P< 0.05, **P< 0.01, ***P< 0.001, ****P< 0.0001)
3)r2 : Significantly different by partial analysis adjusted for age at baseline (*P< 0.05, **P< 0.01, ***P< 0.001, ****P< 0.0001)
4)r3 : Significantly different by partial analysis adjusted for age and body mass index at baseline (*P< 0.05, **P< 0.01, ***P< 0.001, ****P< 0.0001)
5)r4 : Significantly different by partial analysis adjusted for age, body mass index, occupation, income, alcohol drinking and exercise at baseline (*P< 0.05, **P< 0.01, ***P
< 0.001, ****P< 0.0001)
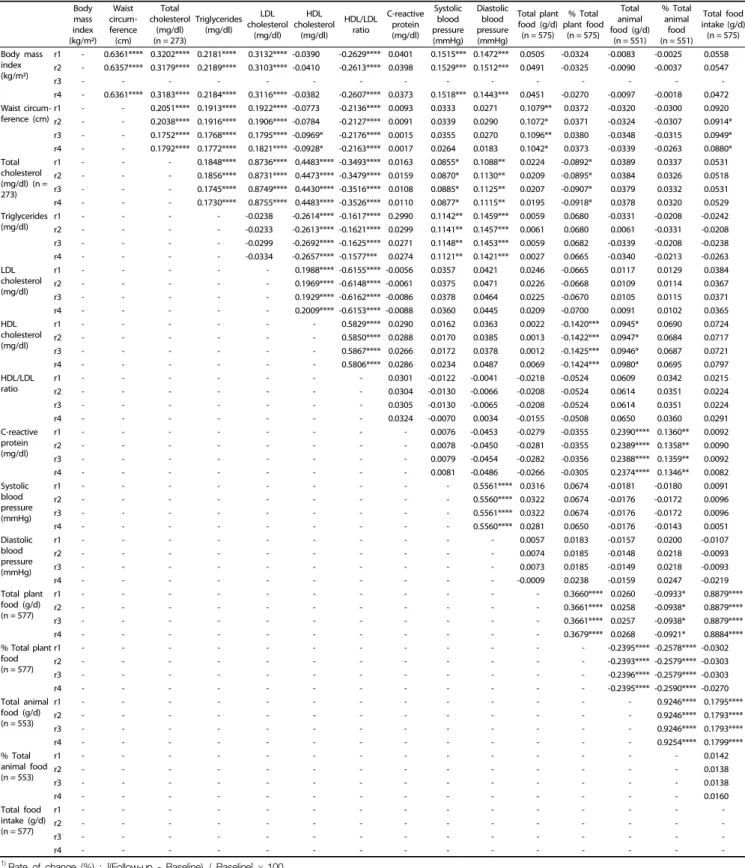
Table 4. Correlation coefficients between rate of change1) in metabolic syndrome risk parameters and food intake2-5) (n = 581)
blood profiles, blood pressure and daily food intake with the length of residence in Korea (data not shown).
Table 4 presents the partial correlation between the rate of change in food intake and metabolic syndrome risk parameters in the Vietnamese subjects. After adjusting for age, BMI, occupation, income, alcohol drinking and exercise at baseline, the waist circumference was positively correlated with the intake of either total plant food (r = 0.1042, P = 0.0129) or total food (r = 0.0880, P = 0.0359). The plasma levels of total cholesterol (r = -0.0918, P = 0.0289) and HDL-cholesterol (r = -0.1424, P = 0.0007) were negatively correlated with the percentage of total intake from plant food. In addition, HDL-cholesterol was positively correlated with the total intake of animal food (r =
0.0980, P = 0.0217). The serum CRP levels were positively correlated with the total intake of animal food (r = 0.2374, P
< 0.0001) or the percentage of total intake from animal food (r = 0.1346, P = 0.0016).
DISCUSSION
The purpose of the present study was to compare changes in dietary intake and metabolic syndrome risk parameters between baseline and follow-up after 4.1yr, and to investigate the association between changes in biochemical variables and food intake in Vietnamese marriage-based female immigrants in Korea.
We found that the consumption of total food including vegetables/fruits/seaweeds/mushrooms, oil and fat and eggs by the Vietnamese subjects was lower at the follow-up period compared to that at the baseline, whereas the consumption of sugars, beverages and meats increased. Despite insufficient total dietary intake, increased intake of sugars, beverages, and meats provide excessive saturated fats and calories. Sugar consumption is increasing in Korea. These eating habits can lead to dietary diseases such as obesity and metabolic syndrome.
Several studies [8, 20-23] have reported a relationship between the acculturation of immigrants and unhealthy changes, for instance, the high intake of sweets, salty snacks, and fat, and the lower intake of fruits and vegetables by highly adaptable immigrants from Mexico living in the US [20,21]. Chinese immigrants to the US with high western dietary acculturative scores had a higher consumption of animal products, sweets and fats [22,23]. Regev-Tobias et al. [8] reported that more than 80% of Ethiopian female immigrants living in Israel decreased their intake of fruits, vegetables and dairy products and increased the consumption of grains and simple sugar. However, other immigrant studies have reported positive changes in diet [9-11]. The high acculturation of Mongolians in Korea led to a higher intake of rice and vegetables, and a lower intake of potatoes, meat, and flour products compared with low accul- turated Mongolian immigrants [10]. Chinese immigrants decreased their fat intake after immigrating to Canada [9], and more than 50% of Chinese immigrants increased their fruit and vegetable consumption, and gained increased knowledge of healthy food habits [11].
In our subjects, the mean body weight, BMI and waist circumference as well as the average HDL-cholesterol, SBP and DBP increased while the fasting blood sugar, triglycerides and
LDL-cholesterol decreased during the follow-up period of 4.1 yr. Among the metabolic syndrome risk parameters, 2 parameters (waist circumference, SBP and DBP) increased and 3 parameters (Low HDL-C, BG, TG) decreased but remained within the normal ranges. Our results showed increases in waist circumference and BMI coupled with high consumption of energy (sugar and beverages) and saturated fat (meat). Also, the increase in SBP and DBP might be affected by the high sodium diet characteristic of Korean traditional foods. In a previous study of Vietnamese female immigrants in Korea, the intake of total food including cereals, vegetables, and fruits as well as mean skeletal muscle mass decreased, while plasma HDL-cholesterol and serum CRP levels increased from baseline to follow-up of 28.1 months [15]. Migration of Koreans to the US results in changes in the diet and an increased risk of chronic diseases over time. The length of residence was also positively associated with the prevalence of thyroid disease and inversely associated with digestive disease as well as with intake of rice and rice dishes in women [2]. Mohan et al. [24] indicated that immigration to developed countries results in increased weight.
Indeed, increased chances for employment increases the frequency of dining out. Lee et al. [25] showed that female immigrants who had lived for more than 5 years in Australia had increased waist circumference and BMI, and high consumption of energy and saturated fat. Asian immigrant women in Korea gained weight after their arrival and the prevalence of being over- weight or obese increased with long term residence in Korea.
[16,26] These reports are consistent with our results.
We found a positive association between the intake of total animal food and CRP, a biomarker for subclinical inflammation, at baseline and follow-up. Also, we found a significant associa- tion between total food intake, total animal or plant food intake and metabolic syndrome risk parameters (waist circumference, LDL, and HDL/LDL) at follow-up. We controlled for confounding factors. These results are explained as follows: according to a cross sectional study that evaluated the association between meat consumption and metabolic syndrome, subjects in the upper quartile of meat consumption had higher HDL- cholesterol than those in the low quartile [27]. Connor et al.
[28] reported that the plasma cholesterol had a significant negative association with vegetable fat and vegetable protein and a positive association with total fat, animal fat, eggs and animal protein. Hong et al. [29] reported that the dairy and fruit pattern was associated with reduced blood glucose and metabolic syndrome risk parameters.
According to the 2013 Korean Health and Nutrition Exami- nation Survey (KNHANES Ⅵ-1) [30], the total food consumption of Korean women was 1,336 g/d. However, the total food intake of our subjects was lower than that of Korean women at both baseline (972.6 g) and follow-up (869.7 g). Additionally, their energy intake was 1,449.1 kcal at baseline and 1,385.8 kcal at follow-up, respectively (data not shown), which is lower than that of Korean women (1,779 kcal) [30] and also lower than the energy intake requirements for a Vietnamese female [31].
These results reflect a lack of dietary diversity due to imbalanced dietary intake for marriage-based immigrant women.
We investigated the rate of change in intra-individual
parameters (including food intake and metabolic parameters)
between baseline and follow-up to figure out the intra- individual changes. All parameters, except for fasting blood sugar, LDL and eggs, showed growth. In other words, despite a decrease in the mean total food intake after follow-up, intra-individual total food intake increased. Also, intra-individual total food intake and total plant or animal food intake were positively associated with intra-individual changes in waist circumference, total cholesterol, HDL and CRP. These results indicate that increasing food consumption is associated with future development of metabolic syndrome. Therefore, nutrition education programs should be linked to health improvement as well as poverty reduction and social development.
Our study had some limitations. Firstly, a 1-day 24-hour recall may not be sufficient to estimate normal daily intake due to the large intra-individual variability in food and nutrient intakes.
However, trained registered dietitians using standard protocols were employed to help the subjects reflect on their daily diet to minimize bias. Secondly, there were some communication problems. Although Vietnamese translators, fluent in both Korean and Vietnamese, assisted when needed, there were still some communication problems, particularly with immigrants who had lived in Korea for a relatively short time and had a low level of education. Thirdly, physical activity is one of the factors that affect anthropometric parameters and blood profiles. Although levels of physical activity were not thoroughly investigated, it can be said that reduction in hard labor farming, transport by foot and other physical activities, coupled with increased consumption of sugar and other beverages after migration from Vietnam may influence metabolic syndrome risk parameters in the long run.
Despite these limitations, this study has some strengths. This is the first follow-up study on the association between food intake and metabolic syndrome risk parameters in Vietnamese female immigrants living in Korea. This study was part of the International Collaboration Study for the Construction of Asian Cohort of the Korean Genome and Epidemiology Study (KoGES) performed on a large scale, and the latest data for the analysis of changes in the nutritional status and blood profiles during the follow-up period were used. Moreover, information on the identified and potential confounding factors was included in the analysis.
In conclusion, these results suggest that the change rate of dietary intake such as total plant food or animal food is associated with the change rates of metabolic syndrome risk parameters. Despite insufficient dietary intake, a few metabolic syndrome risk parameters (waist circumference and blood pressure) might be affected by eating habits such as sugar, beverage and meat as well as total food intake in Vietnamese marriage-based female immigrants. Food security and dietary diversity are necessary for these women as well as the practice of healthy dietary habits. The results of this study may be helpful to registered dietitians for the development and impleme- ntation of nutritional and health programs for Vietnamese female immigrants living in Korea, and can be the basis for further study on marriage-based immigrants and multiethnic families. Further study is needed to assess the association between changes in nutritional status and chronic disease in Vietnamese marriage-based female immigrants.
REFERENCES
1. Statistics Korea. Survey of foreign residents in Korea [Internet].
Seoul: Ministry of Security and Public Administration; 2014 [cited 2015 August 13] Available from: http://kostat.go.kr.
2. Yang EJ, Chung HK, Kim WY, Bianchi L, Song WO. Chronic diseases and dietary changes in relation to Korean Americans' length of residence in the United States. J Am Diet Assoc 2007;107:942-50.
3. Kim YP, Kim S, Joh JY. Family adaptability and cohesion in families consisting of Asian immigrant women living in South Korea: a 3-year longitudinal study. Asia-Pac Psychiatry 2015;7:206-14.
4. Berry JW. Immigration, acculturation, and adaptation. Appl Psychol 1997;46:5-34.
5. Chae SM, Park JW, Kang HS. Relationships of acculturative stress, depression, and social support to health-related quality of life in Vietnamese immigrant women in South Korea. J Transcult Nurs 2014;25:137-44.
6. Tseng M, Fang CY. Stress is associated with unfavorable patterns of dietary intake among female chinese immigrants. Ann Behav Med 2011;41:324-32.
7. Hwang JY, Lee SE, Kim SH, Chung HW, Kim WY. Psychological distress is associated with inadequate dietary intake in Vietnamese marriage immigrant women in Korea. J Am Diet Assoc 2010;110:
779-85.
8. Regev-Tobias H, Reifen R, Endevelt R, Havkin O, Cohen E, Stern G, Stark A. Dietary acculturation and increasing rates of obesity in Ethiopian women living in Israel. Nutrition 2012;28:30-4.
9. Kwok S, Mann L, Wong K, Blum I. Dietary habits and health beliefs of Chinese Canadians. Can J Diet Pract Res 2009;70:73-80.
10. Tserendejid Z, Hwang J, Lee J, Park H. The consumption of more vegetables and less meat is associated with higher levels of acculturation among Mongolians in South Korea. Nutr Res 2013;33:
1019-25.
11. Rosenmöller DL, Gasevic D, Seidell J, Lear SA. Determinants of changes in dietary patterns among Chinese immigrants: a cross- sectional analysis. Int J Behav Nutr Phys Act 2011;8:42.
12. Nguyen PH, Strizich G, Lowe A, Nguyen H, Pham H, Truong TV, Nguyen S, Martorell R, Ramakrishnan U. Food consumption patterns and associated factors among Vietnamese women of reproductive age. Nutr J 2013;12:126.
13. Wu J, Xu G, Shen L, Zhang Y, Song L, Yang S, Yang H, Yuan J, Liang Y, Wang Y, Wu T. Parity and risk of metabolic syndrome among Chinese women. J Womens Health (Larchmt) 2015;24:602-7.
14. Edyta S, Dorota K, Elzbieta C, Stanislaw G. Association between dietary patterns and metabolic syndrome in individuals with normal weight: a cross-sectional study. Nutr J 2015;14:1-10.
15. Hwang JY, Lee H, Ko A, Han CJ, Chung HW, Chang N. Dietary changes in Vietnamese marriage immigrant women: the KoGES follow-up study. Nutr Res Pract 2014;8:319-26.
16. Lyu JE, Yang YJ, Lee SE, Chung HW, Kim MK, Kim WY. Nutritional status of Vietnamese female marriage immigrants to Korea in relation to length of residence in Korea. Ann Nutr Metab 2009;55:
317-24.
17. Kim SH, Kim WY, Lyu JE, Chung HW, Hwang JY. Dietary intakes and eating behaviors of Vietnamese female immigrants to Korea through marriage and Korean spouses and correlations of their diets. Korean J Community Nutr 2009;14:22-30.
18. Friedewald WT, Levy RI, Fredrickson DS. Estimation of the concen-
tration of low-density lipoprotein cholesterol in plasma, without use of the preparative ultracentrifuge. Clin Chem 1972.18:499-502.
19. The Korean Nutrition Society. Nutritional assessment program, 'Can-pro 3.0' [CD-ROM]. Seoul: The Korean Nutrition Society; 2006.
20. Neuhouser ML, Thompson B, Coronado GD, Solomon CC. Higher fat intake and lower fruit and vegetables intakes are associated with greater acculturation among Mexicans living in Washington State. J Am Diet Assoc 2004;104:51-7.
21. Batis C, Hernandez-Barrera L, Barquera S, Rivera JA, Popkin BM. Food acculturation drives dietary differences among Mexicans, Mexican Americans, and Non-Hispanic Whites. J Nutr 2011;141:1898-906.
22. Lv N, Cason KL. Dietary pattern change and acculturation of Chinese Americans in Pennsylvania. J Am Diet Assoc 2004;104:771-8.
23. Satia JA, Patterson RE, Kristal AR, Hislop TG, Yasui Y, Taylor VM.
Development of scales to measure dietary acculturation among Chinese-Americans and Chinese-Canadians. J Am Diet Assoc 2001;101:548-53.
24. Mohan V. Why are Indians more prone to diabetes? J Assoc Physicians India 2004;52:468-74.
25. Lee WP, Lingard J, Bermingham M. Change in diet and body mass
index in Taiwanese women with length of residence in Australia.
Asia Pac J Clin Nutr 2007;16:56-65.
26. Yang SJ, Choi HY, Chee YK, Kim JA. Prevalence and correlates of obesity and overweight among Asian immigrant women in Korea.
Asia Pac J Public Health 2012;24:620-30.
27. Azadbakht L, Esmaillzadeh A. Red meat intake is associated with metabolic syndrome and the plasma C-reactive protein concentra- tion in women. J Nutr 2009;139:335-9.
28. Connor WE, Cerqueira MT, Connor RW, Wallace RB, Malinow MR, Casdorph HR. The plasma lipids, lipoproteins, and diet of the Tarahumara indians of Mexico. Am J Clin Nutr 1978.31:1131-42.
29. Hong S, Song Y, Lee KH, Lee HS, Lee M, Jee SH, Joung H. A fruit and dairy dietary pattern is associated with a reduced risk of metabolic syndrome. Metabolism 2012;61:883-90.
30. Ministry of Health and Welfare, Korea Centers for Disease Control and Prevention. Korea Health Statistics 2013: Korea National Health and Nutrition Examination Survey (KNHANES VI-1). Cheongju: Korea Centers for Disease Control and Prevention; 2014.
31. Khan NC, Hoan PV. Vietnam recommended dietary allowances 2007.
Asia Pac J Clin Nutr 2008;17 Suppl 2:409-15.