606 http://dx.doi.org/10.9713/kcer.2016.54.5.606
PISSN 0304-128X, EISSN 2233-9558
The Prediction of Minimum Miscible Pressure for CO
2EOR using a Process Simulator
Felicia Salim, Seojin Kim, Dadan D.S.M. Saputra*, Wisup Bae*, Jaihyo Lee**,† and In-Won Kim†
Department of Chemical Engineering, Konkuk University, 120, Neungdong-ro, Gwangjin-gu, Seoul, 05029, Korea
*Department of Mineral Resources Engineering, Sejong University, 209, Neungdong-ro, Gwangjin-gu, Seoul, 05006, Korea
**Department of Mechanical Engineering, Konkuk University, 120, Neungdong-ro, Gwangjin-gu, Seoul, 05029, Korea (Received 3 September 2015; Received in revised form 24 March 2016; accepted 11 July 2016)
Abstract − Carbon dioxide injection is a widely known method of enhanced oil recovery (EOR). It is critical for the CO2 EOR that the injected CO2 to reach a condition fully miscible with oil. To reach the miscible point, a certain level of pressure is required, which is known as minimum miscibility pressure (MMP). In this study, a MMP prediction method using a process simulator is proposed. To validate the results of the simulation, those are compared to a slim tube exper- iment and several empirical correlations of previous literatures. Aspen HYSYS is utilized as the process simulator to create a model of CO2/crude oil encounter. The results of the study show that the process simulator model is capable of predicting MMP and comparable to other published methods.
Key words: Minimum miscibility pressure, CO2 enhanced oil recovery, Process simulator, Slim tube experiment, MMP prediction
1. Introduction
Enhanced oil recovery is an advanced step of oil recovery effort which has been actively pursued in the past few years. One of the most popular methods of EOR is gas injection in which gases are injected into mature reservoir fields. Flue gases, light hydrocar- bon, nitrogen, methane and carbon dioxide are some of the prefera- ble injection fluids. The selection of the injected fluid is decided by considering the reservoir characteristics, oil composition and eco- nomical value of the said fluid.
In 1952, a patent for enhanced oil recovery method of injection of CO2 was granted to Whorton et al. [1]. CO2 has high displace- ment efficiency and is available at lower cost, which makes it a favorable choice. Furthermore, injecting CO2 into the oil reservoir has a potential for environmental benefits through storing the greenhouse gas at subsurface.
To reach maximum recovery potential, the encounter of injected fluid and oil should happen in such condition where both elements are miscible with each other. The minimum flooding pressure required to reach the miscibility point is also known as minimum miscibility pressure (MMP) [2]. MMP required for CO2 injection depends on the CO2 purity, oil composition and reservoir tempera- ture [3]. To achieve the highest recovery, it is necessary for the res- ervoir to be pressured to be maintained at or above the MMP.
Therefore, the prediction of MMP is a crucial part in oil recovery effort.
2. Minimum Miscible Pressure (MMP)
Minimum miscible pressure is the lowest pressure needed to achieve miscible state of the system. There are three main parame- ters affecting MMP: gas injection composition, intermediate com- ponent (C5+) of crude oil and reservoir temperature. Based on the amount of contact needed to achieve the MMP, there are two kinds of miscibility: first contact miscibility (FCM) and multiple contact miscibility (MCM). We can differentiate the process by observing the ternary diagram of the crude oil system. The example of first contact miscibility is a reaction between ethanol and water [4].
They will form one phase of fluid without observable interface (no interface, IFT = 0).
Other MMP definitions from several researchers are as follows:
1. Maximum oil recovery at 1.2 pore volumes (PV) of CO2 injected [5].
2. The pressure that causes 80% oil recovery at CO2 injection process and 94% of oil in place ultimately recovered [6].
3. The pressure that causes 90 % oil recovery at 1.2 PV of CO2 injected [7].
There are two different mechanisms that could happen in misci- bility process, which are vaporizing and condensing mechanism [8]:
2-1. Vaporizing mechanism
The light component of crude oil is vaporized by CO2 and it will continue until CO2 becomes more like the oil, and thus becomes easier to be soluble in the oil. Upon contact with the oil, light and intermediate molecular-weight hydrocarbon transfer from the oil into the gas phase, thus vaporizing into the gas. Formation of misci- bility may require several contacts between gas containing vaporized components and fresh reservoir oil.
†To whom correspondence should be addressed.
E-mail: [email protected], [email protected]
This is an Open-Access article distributed under the terms of the Creative Com- mons Attribution Non-Commercial License (http://creativecommons.org/licenses/by- nc/3.0) which permits unrestricted non-commercial use, distribution, and reproduc- tion in any medium, provided the original work is properly cited.
2-2. Condensing mechanism
The rich gas is injected into the oil with less intermediate carbon fraction, but has the more heavier fraction in the component. The crude oil will take the intermediate fraction from the gas (the gas is condensed into the oil) until the crude oil will be similar in compo- nent with richer gas. That is when the miscibility will happen.
However, both mechanisms described are too simple for an enriched-solvent displacement. Zick [9] considers oil-solvent sys- tem to be composed of four groups of components: lean components (CH4, N2, CO2), light intermediate (C2-C4), middle intermediate (C4- C10), and everything else (heavy non-vaporizable components). In condensing/vaporizing process, light intermediates condense from the injection solvent into the oil while the middle intermediates are being stripped from the oil into the solvent. Oil located further from the injection point will have contact with the equilibrium sol- vent, which is saturated in the light intermediates and contain a small amount of middle intermediates from the oil over which it passed. Those intermediates condense when the solvent have contacts with fresh oil downstream. The solvent develops just enough rich- ness by the vaporization part of the mechanism so that it nearly generates a condensing mechanism.
3. MMP Determination Methods
MMP prediction has been carried through laboratory experiment and analytical techniques over the years. In 1987, Christiansen and Haines [10] reported that MMP can be determined rapidly by observ- ing the miscibility development between a gas bubble and oil through the rising bubble apparatus (RBA). Wu and Batycky [11] experi- mented on slim tube to analyze the effect of effluent gas composi- tion and pressure drop on miscibility pressure. A study done to compare both RBA and slim tube method was done by Elsharkawy et al. [12] with the conclusion that RBA is a faster and more reli- able method than the slim tube for determining MMP. A more cur- rent method of MMP determination known as vanishing interfacial tension (VIT) is reported later in several studies [12,13]. The VIT technique is based on the concept that the interfacial tension between the gas and crude oil phases at reservoir temperature must reduce to zero as these two phases approach the point of miscibility [14].
A correlation determines the optimum displacement pressure of CO2 is developed by Holm and Josendal [6]. This correlation is based on the temperature of the reservoir and molecular weight of C5+
and presented in a graphical form. In 1976, the National Petroleum Council [15] proposed a correlation that predicts CO2 MMP according to reservoir temperature and API gravity of the reservoir oil, which gives a rough estimation of the required MMP. Lee [16] reported a model that predicts CO2 MMP according to the CO2 pressure vapor.
Yellig and Metcalfe [5] established a correlation of reservoir tem- perature and the required MMP by running a slim tube experiment on various pressures. Stalkup [17] followed up Cronquist’s [18]
work and completed a correlation for CO2 MMP based on the res-
ervoir temperature and the molecular weight of C5+ fraction. Orr and Jensen [19] formulated correlation by extrapolating vapor pressure to predict the MMP for reservoirs with low temperature. Glass [20]
related CO2 MMP to reservoir temperature, mole percent methane in the injected CO2, molecular weight of the intermediates (C2-C6) in the gas, and the molecular weight of C7+ of the oil. Enick et al.
[21] developed an equation of state (EOS) and a correlation to pre- dict the MMP of pure and impure CO2 injection dependent to the reservoir temperature and C5+ molecular weight. In this method, molecular weight of C5+ is modeled as a single alkane of equiva- lent molecular weight.
In 1988, Harmon and Grigg [22] described a rapid experimental method, which utilizes the solving properties of CO2 and the actual stock-tank oil to predict CO2 MMP. Another correlation is presented based on the difference in solubility parameter between the crude oil and the injected gas to determine CO2 MMP by Lange [23]. Wang and Orr [24] proposed an analytical MMP calculation method for one-dimensional, dispersion-free flow of a randomly chosen num- ber of component mixtures in the injected gas and oil.
An artificial neural network (ANN) model applicable to the esti- mation of MMP for pure and impure CO2 injection was established by Huang et al. [25] in 2003. The said model considers the molecular weight of C5+ fraction, concentrations of methane and intermediate hydrocarbons (C2-C4) fractions in the oil for pure CO2 injection.
To predict the impurities factor in the CO2 stream, this model cor- relates the concentration of contaminants (N2, C1, H2S and SO2) and their critical temperatures. In 2005, Yuan et al. [26] developed an analytical model to estimate MMP for pure and impure CO2 injec- tion from equations of state which is based solely on the reservoir temperature, the percentage of intermediate (C2-C6) and the molec- ular weight of C7+ in the oil.
Shokir [3] used an alternating conditional expectation (ACE) algorithm to predict the pure and impure CO2 injection MMP based on the reservoir temperature, oil compositions and CO2 impurities.
The results of the study were compared to the commonly used pure and impure CO2 - oil MMP correlations to check the efficiency of the model. In 2013, Shokrollahi et al. [27] proposed a model named least-squares support vector machine (LSSVM) to estimate MMP of CO2 injection method using molecular weight of C5+ in the oil, reservoir temperature, and impurities of injected CO2 stream (H2S and N2 concentration) as input parameters of the model.
The use of correlations to predict required MMP in EOR process has been considered to be efficient. It is simple, inexpensive and gives a fairly accurate result depends on the quality of data supplied to the correlation.
4. Slim Tube Experiment
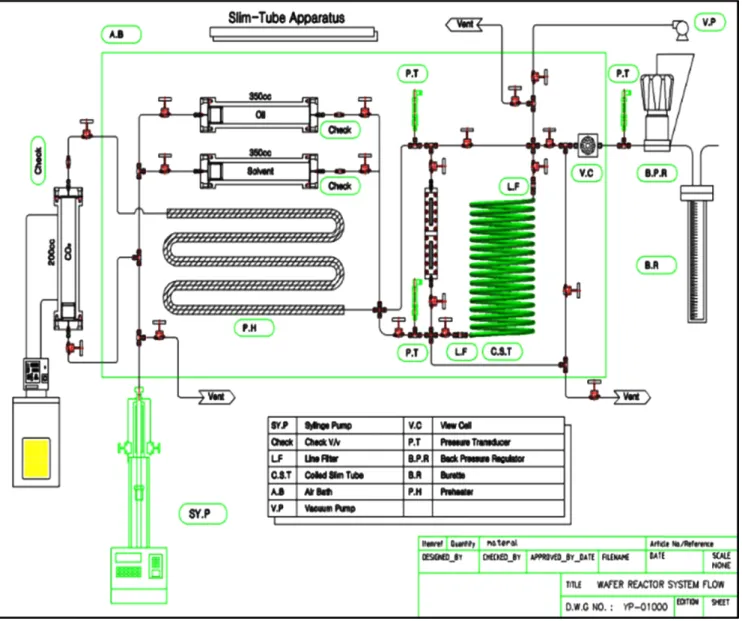
MMP (minimum miscible pressure) is examined by using slim tube apparatus, the technique which has already considered as indus- trial standard to measure the MMP. The slim tube schematic dia-
gram that was used in the experiment can be observed at Fig. 1.
The specification of the slim tube is presented in Table 1.
The saturation fluid process is performed by injecting crude oil into the slim tube with low rates (0.1~0.5 cc/minute) until it reaches 2 PV of crude oil injected (it was assumed that the slim tube is already completely saturated with the crude oil. The back pressure regulator (BPR) in the apparatus is set into experimental pressure
by injecting gas through the line. CO2 is then injected from the upper part of slim tube with low injection rate (0.1~0.2 cc/minute) in order to reduce the viscous fingering effect by using an ISCO pump until it reaches 1.2 of PV injected. Then the volume of oil that was collected in the outlet of the apparatus was measured and dead volume of the outlet flow line was subtracted from it. The same procedure was repeated at various set pressures to collect required data from which MMP is inferred.
The experiment was done in two temperature ranges. The first experiment was done at temperature 70 °C (158°F), the second experi- ment set was at 66 °C (150°F) and the third one at 65 °C (149°F).
To represent the slim tube experiment results, the results of the first experiment can be observed in Table 2 and Fig. 2.
There are three ways to determine the MMP. First, defining the break-over point which was created by the meeting point of the two slopes in the curves. Second, the MMP is defined as pressure when the oil recovery reaches 90%. MMP can also be defined as pres- sure at 95% of oil recovery. Based on the break-over point MMP Fig. 1. Schematic Diagram of Slim Tube Apparatus.
Table 1. Specification of slim tube apparatus Specification
Material Stainless Steel (316SS)
Slim Tube Length 12.35 m
OD Slim Tube 0.25 in. = 0.635 cm
ID Slim Tube 0.457 cm
Bulk Volume 202.7 cm3
Pore Volume 92.0 cm3
Porosity 45.38%
Sand pack material Hama #8 (60/70 mesh)
measurement, it was shown that the MMP of the system is 1940 psi (13.38 MPa) for the first experiment (at 70 °C), 1700 psi (11.72 MPa) for the second experiment (at 66 °C) and 1680 psi (11.58 MPa) for the third experiment (at 65 °C). Based on 90% total oil recovery definition, the MMP is 1840, 1640 and 1620 psi for first, second and third experiment, respectively (or 12.69 MPa, 11.31 MPa, and 11.17 Mpa, respectively). Alternatively, for the last definition of MMP often used by people in the oil industry, using 95% total oil recovery, the MMP is 1920 psi (13.24 MPa) for the first experiment, 1840 psi (12.69 MPa) for the second experiment and 1820 psi (12.55 MPa) for the third experiment.
5. MMP Prediction Using Process Simulator
Modeling the encountering process of CO2/crude oil until they reach miscibility can be done in the process modeling simulator. This study presents a simple method of predicting MMP using Aspen HYSYS. The Aspen HYSYS provides steady state and dynamic process simulation in an integrated environment that utilizes case scenario tool to optimize designed process. Results of simulation are then compared to results of slim-tube experiment and existed correlations.
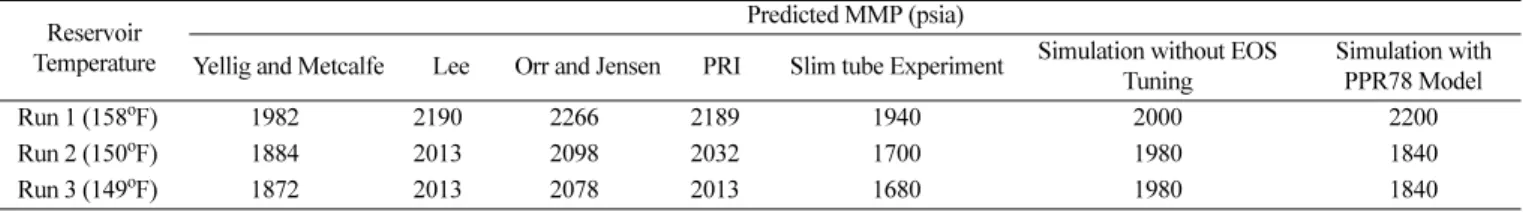
Slim tube MMP experimental results based on the break-over point are utilized to help validate the simulation model. Peng-Rob- inson equation of state is chosen in the simulator to solve the simu- lation model with reservoir temperature and crude oil composition as known variable. To get more accurate data, calibration of EOS
used to is required. In this study, the binary interaction parameters (Kij) for the Peng-Robinson equation of state (EOS) are estimated using the PPR78 model (predictive 1978, Peng-Robinson EOS) [28,29]. Published correlations by Petroleum Recovery Institute (PRI), Lee, Yellig & Metcalfe and Orr & Jensen are also used to validate the simulation results before and after the EOS calibration along with the slim tube experiment result.
A simulation environment was created to emulate a situation of which CO2 and crude oil encounter each other in a certain pressure and temperature. The injected CO2 and crude oil were set as the inlet and goes into the mixer at certain injection pressure. The pres- sure of the crude oil flow wa set to the pressure of the reservoir while the temperature was adjusted to the experiment temperature.
The mixture then flowed to the heater to be heated to the reservoir temperature before then being separated to vapor and liquid flows.
The temperature of the mixture was set to 67oC. The simulation model can be observed in Fig. 3.
After the model was set, the next step taken was to run a case study to find the MMP. The injection pressure, which is the pres- sure of the CO2 flow, was set as the independent variable while the separated vapor and liquid were set as the dependent variable. In this study, MMP is defined as a condition where the mole fraction of CO2 in the mixture is equivalently available in vapor and liquid phase. In the said condition, it is assumed that CO2 is well dis- persed in the mixture and reached miscibility with the crude oil. A result of one of the case studies is presented in Fig. 4. As observed, Table 2. Results of slim tube experiment at 150oF
Pressure, Psi RF (%)
1,365 71.74
1,210 66.30
1,707 92.39
1,070 58.70
1,840 94.57
1,940 95.65
2,077 96.74
1,430 78.26
Fig. 2. Recovery Factor vs Pressure at 150°F using Slim Tube Appa- ratus.
Fig. 3. Process Flow Diagram of Simulation in Aspen HYSYS Design.
Fig. 4. CO2 Mole Fraction in Separated Liquid and Vapor against Pressure.
the CO2 mole fraction in the separated liquid increased concur- rently with increasing pressure, indicating a process of CO2 disper- sion into the liquid phase or crude oil.
Results from the simulation were then compared to results of the correlation mentioned earlier in this part. Petroleum Recovery Institute (PRI), Lee, Yellig & Metcalfe and Orr & Jensen correlations were chosen because these correlations consider the reservoir tempera- ture as the main variable in predicting MMP. Thus, it is considered to be well suited as comparator to the simulation system where the main adjustable variable is the temperature of the reservoir.
A comprehensive comparison of simulation results, slim tube experiment and other published correlations is presented in Table 3. It is evident that the Aspen HYSYS simulation results showing comparably higher results than that of the slim tube experiment.
Results of the slim tube experiment show a deviation ranging from 3~18% to the simulation without EOS calibration; the simulation with PPR78 binary coefficient estimation shows closer results with 8~12% deviation. Comparison results of simulation and other cor- relations indicated various ranges of difference with Orr & Jen- sen’s correlation showing the highest deviation, while Yellig &
Metcalfe’s equation showing the closest results to the simulation results.
The similarities of the results presumably happened because Yellig
& Metcalfe’s correlation considered similar variables that are used to perform calculations in the simulation program and the slim tube experiment method. While most correlations are primarily depen- dent on temperature and less on oil composition, Yellig & Metcalfe added extra attention to bubble point pressure correction. In addition, Yellig & Metcalfe’s correlation model is constructed on numerous CO2 MMP data. These qualities are considered to be the reason for how Yellig & Metcalfe’s provided the most similar prediction to the simulation and slim tube experiment results.
6. Conclusions
MMP is a prominent factor that may decide a successful CO2 EOR process. To determine the MMP, simple, fast and economical methods are constantly researched. From this study, it is proven that the process simulator can provide a shortcut in the MMP pre- dicting process, using the information of reservoir temperature and oil characteristics. The results of the study show that the simulation model has more resemblance to Yellig and Metcalfe’s correlation.
The process simulator model shows a great potential as an efficient
tool for predicting MMP. It has a fair accuracy yet swift and simple to use.
Acknowledgement
This work was supported by the Energy Resources R&D pro- gram of the Korea Institute of Energy Technology Evaluation and Planning (KETEP) grant funded by the Korea government Ministry of Trade, Industry and Energy (No. 20158510030780). This paper was written as part of Konkuk University’s research support program for its faculty on sabbatical leave in 2014.
References
1. Whorton, L. P., U.S. Patent No. 2,623,596. Washington, DC:
U.S. Patent and Trademark Office (1952).
2. NETL. CO2-EOR primer: Carbon dioxide enhanced oil recovery.
Retrieved August 2014, from http://www.netl.doe.gov/file%20li- brary/research/oil-gas/CO2_EOR_Primer.pdf. (2010).
3. Shokir, E. M. E. M., “CO2-oil Minimum Miscibility Pressure Model for Impure and Pure CO2 Streams,” Journal of Petroleum Science and Engineering, 58(1), 173-185(2007).
4. Jarrell, P. M., “Practical aspects of CO2 flooding. Richardson, Tex.: Henry L. Doherty Memorial Fund of AIME,” Society of Petro- leum Engineers (2002).
5. Yellig, W. F. and Metcalfe, R. S., “Determination and Prediction of CO2 Minimum Miscibility Pressures (includes associated paper 8876),” Journal of Petroleum Technology, 32(01), 160- 168(1980).
6. Holm, L. W. and Josendal, V. A., “Mechanisms of Oil Displace- ment by Carbon Dioxide,” Journal of petroleum Technology, 26(12), 1-427(1974).
7. Williams, C. A., Zana, E. N. and Humphrys, G. E., “Use of the Peng-Robinson Equation of State to Predict Hydrocarbon Phase Behavior and Miscibility for Fluid Displacement. In SPE/DOE Enhanced Oil Recovery Symposium,” Society of Petroleum Engi- neers (1980).
8. Holm, L. W., “Miscibility and Miscible Displacement,” Journal of Petroleum Technology, 38(08), 817-818(1986).
9. Zick, A. A., A Combined Condensing/Vaporizing Mechanism in the Displacement of Oil by Enriched Gases. Presented at the SPE Annual Technical Conference and Exhibition, New Orleans, 5-8 October. SPE-15493-MS. http://dx.doi.org/10.2118/15493- MS (1986).
10. Christiansen, R. L. and Haines, H. K., “Rapid Measurement of Minimum Miscibility Pressure with the Rising-bubble Appara- tus,” SPE Reservoir Engineering, 2(04), 523-527(1987).
Table 3. Comparison of simulation, slim tube experiment and published correlations results Reservoir
Temperature
Predicted MMP (psia)
Yellig and Metcalfe Lee Orr and Jensen PRI Slim tube Experiment Simulation without EOS Tuning
Simulation with PPR78 Model
Run 1 (158oF) 1982 2190 2266 2189 1940 2000 2200
Run 2 (150oF) 1884 2013 2098 2032 1700 1980 1840
Run 3 (149oF) 1872 2013 2078 2013 1680 1980 1840
11. Wu, R. S. and Batycky, J. P., “Evaluation of Miscibility from Slim Tube Tests,” Journal of Canadian Petroleum Technology, 29(06), (1990).
12. Elsharkawy, A. M., Poettmann, F. H. and Christiansen, R. L.,
“Measuring CO2 Minimum Miscibility Pressures: Slim-tube or Rising-bubble Method,” Energy & Fuels, 10(2), 443-449(1996).
13. Rao, D. N., “A New Technique of Vanishing Interfacial Tension for Miscibility Determination,” Fluid Phase Equilibria, 139(1), 311-324(1997).
14. Rao, D. N. and Lee, J. I., “Application of the New Vanishing Interfacial Tension Technique to Evaluate Miscibility Conditions for the Terra Nova Offshore Project,” Journal of Petroleum Sci- ence and Engineering, 35(3), 247-262(2002).
15. Council, NP., Enhanced oil recovery - an analysis of the poten- tial for enhanced oil recovery from known fields in the United States - 1976-2000, Washington, DC; 1976.
16. Lee, J. I., “Effectiveness of Carbon Dioxide Displacement Under Miscible and Immiscible Conditions,” Report RR-40, Petroleum Recovery Inst., Calgary (1979).
17. Stalkup Jr, F. I., “Status of Miscible Displacement,” Journal of Petroleum Technology, 35(04), 815-826(1983).
18. Cronquist, C., “Carbon Dioxide Dynamic Miscibility with Light Reservoir Oils,” Proc. Fourth Annual U.S. DOE Symposium, Tulsa, 28-30(1978).
19. Orr Jr, F. M. and Jensen, C. M., “Interpretation of Pressure-Compo- sition Phase Diagrams for CO2/Crude-oil Systems,” Society of Petroleum Engineers Journal, 24(5), 485-497(1984).
20. Glass, O., “Generalized Minimum Miscibility Pressure Correla- tion (includes associated papers 15845 and 16287),” Society of Petroleum Engineers Journal, 25(06), 927-934(1985).
21. Enick, R. M., Holder, G. D. and Morsi, B. I., “A Thermodynamic Correlation for the Minimum Miscibility Pressure in CO2 Flood-
ing of Petroleum Reservoirs,” SPE Reservoir Engineering, 3(01), 81-92(1988).
22. Harmon, R. A. and Grigg, R. B., “Vapor-density Measurement for Estimating Minimum Miscibility Pressure (includes associ- ated papers 19118 and 19500),” SPE reservoir engineering, 3(04), 1-215(1988).
23. Lange, E. A., “Correlation and Prediction of Residual Oil Satu- ration for Gas Injection EOR Processes,” In Symposium on improved oil recovery, 245-254(1996).
24. Wang, Y. adn Orr Jr, F. M., “Calculation of Minimum Miscibility Pressure,” Journal of Petroleum Science and Engineering, 27(3), 151-164(2000).
25. Huang, Y. F., Huang, G. H., Dong, M. Z. and Feng, G. M.,
“Development of An Artificial Neural Network Model For Pre- dicting Minimum Miscibility Pressure in CO2 Flooding,” Jour- nal of Petroleum Science and Engineering, 37(1), 83-95(2003).
26. Yuan, H., Johns, R. T., Egwuenu, A. M. and Dindoruk, B.,
“Improved MMP Correlation for CO2 Floods Using Analytical Theory,” SPE Reservoir Evaluation & Engineering, 8(05), 418- 425(2005).
27. Shokrollahi, A., Arabloo, M., Gharagheizi, F. and Mohammadi, A. H., “Intelligent Model for Prediction of CO2-Reservoir Oil Minimum Miscibility Pressure,” Fuel, 112, 375-384(2013).
28. Jaubert, J. N. and Mutelet, F., “VLE Predictions with the Peng- Robinson Equation of State and Temperature Dependent Kij Calculated Through a Group Contribution Method,” Fluid Phase Equilibria, 224(2), 285-304(2004).
29. Jaubert, J. N., Vitu, S., Mutelet, F. and Corriou, J. P., “Extension of the PPR78 model (predictive 1978, Peng-Robinson EOS with temperature dependent k ij calculated through a group contribu- tion method) to Systems Containing Aromatic Compounds,”
Fluid Phase Equilibria, 237(1), 193-211(2005).