610 https://doi.org/10.9713/kcer.2020.58.4.610
PISSN 0304-128X, EISSN 2233-9558
The Influence of Pressure, Temperature, and Addition of CO
2on the Explosion Risk of Propylene used in Industrial Processes
Yu-Jung Choi and Jae-Wook Choi†
Department of Fire Protection Engineering, Pukyong National University, 45, Yongso-ro, Nam-gu, Busan, 48513, Korea
(Received 12 June 2020; Received in revised from 2 August 2020; Accepted 25 August 2020)
Abstract − In process installations, chemicals operate at high temperature and high pressure. Propylene is used as a basic raw material for manufacturing synthetic materials in the petrochemical industry; However, it is a flammable substance and explosive in the gaseous state. Thus, caution is needed when handling propylene. To prevent explosions, an inert gas, carbon dioxide, was used and the changes in the extent of explosion due to changes in pressure and oxygen concentration at 25 °C, 100 °C, and 200 °C were measured. At constant temperature, the increase in explosive pressure and the rates of the explosive pressure were observed to rise as the pressure was augmented. Moreover, as the oxygen concentration decreased, the maximum explosive pressure decreased. At 25 °C and oxygen concentration of 21%, as the pressure increased from 1.0 barg to 2.5 bar, the gas deflagration index (Kg) increased significantly from 4.71 barg·m/s to 18.83 barg·m/s.
Key words: Propylene, Carbon dioxide, Explosion pressure, Pressure rise rate, Gas deflagration index (Kg)
1. Introduction
When designing a chemical process, it is imperative to accurately identify the properties of the inflammable chemicals being handled in order to prevent fires or explosions. An explosion occurs when a gas rapidly expands due to a sharp increase in pressure. It is a phenomenon that causes massive damage as strong shock waves hit surfaces along with sound and pressure waves. There are physical, chemical, electrical, and nuclear explosions. Most chemical explosions are caused when heat and energy are released through rapid oxidation and reduction reactions by chemical substances [1,2].
Factors affecting the intensity of chemical explosions include the initial temperature, pressure, and oxygen concentration. The strongest explosions occur near the stoichiometric ratio, which is the concentration ratio of fuel and air for which the fuel is completely burned. In addition, the higher the temperature and pressure, the higher the maximum explosion pressure and the speed at which the burst pressure increases, resulting in secondary damage, such as damage to human life and property [3-5].
Injection of nitrogen, argon, and carbon dioxide as inert gases to prevent explosion results in changes in propagation characteristics such as the explosive pressure of combustible gas, the pressure increase of explosion, and the combustion speed. Carbon dioxide as inert gas changes the physical properties of thermal diffusivity and heat capacity through the ability to disassemble within a flame
wire, consuming part of the heat from combustion [6,7].
As an explosion causes the destruction of its vessel, the National Fire Protection Association 68 [8] recommends the installation of explosion pressure outlets, such as rupture discs, to reduce this risk.
The gas deflagration index (Kg) required for the design of an explosion pressure outlet can be calculated using the maximum explosion pressure rise rate and the vessel volume [9-11]. Cong et al. [12] studied the dynamic reaction of oxidation of ethylene and propene under the presence of carbon dioxide and water vapor with variations in temperature at 1 atmosphere, while Chen et al. [13]
studied explosive characteristics such as blast pressure and maximum burst pressure of nitro-thinner with variations in initial temperature and initial pressure. In addition, Shen et al. [14] measured the maximum pressure rise rate and the burst index of a methane and air mixture.
However, propylene is used at high temperature and pressure, so secondary damage can be increased due to the increased pressure of the gas explosion in the event of an explosion accident. In addition, the explosion limit, burst pressure, explosion pressure rate, and gas explosion index are generally obtained through experimental studies, but existing studies are still insufficient to prevent explosions in industrial processes. In this study, the explosion pressure, the explosion pressure rise rate, and the gas deflagration index (Kg) of propylene were obtained with respect to the temperature (25 °C, 100 °C, and 200 °C) and the pressure (1.0, 1.5, 2.0, and 2.5 barg).
2. Theoretical Background
2-1. Ideal gas equation [15]
The ideal gas equation shows the relationship between pressure (P), volume (V), number of moles (n), and temperature (T) in a gas.
†To whom correspondence should be addressed.
E-mail: [email protected]
This is an Open-Access article distributed under the terms of the Creative Com- mons Attribution Non-Commercial License (http://creativecommons.org/licenses/by- nc/3.0) which permits unrestricted non-commercial use, distribution, and reproduc- tion in any medium, provided the original work is properly cited.
It can be expressed as in Eq. (1).
(1)
2-2. Dalton’s and Amagat’s equations [16,17]
It is important to be aware of the concentrations of the chemical components of a gas because the extent of an explosion depends upon those concentrations. Thus, the partial pressure of each component of the mixture can be calculated if only the total pressure and mole fractions are known and the required concentrations of chemicals can be calculated.
Dalton’s law of partial pressure states that for a mixture of gases in a vessel, the sum of the mole numbers of each gas equals the number of moles of the mixture, and each number of moles represents the amount of each gas. According to Amagat’s law of partial volume, the total volume of a non-reacting gas mixture at constant temperature and pressure equals the sum of the partial volumes of each constituent gas. The state equation for gas compounds can be predicted by the pressure addition law of Dalton’s Eq. (2) and the volume addition law of Amagat’s formula (3).
(2)
(3)
In the case of an actual gas mixture, Eqs. (2) and (3) are applied to Eq. (1) to account for the deviation from abnormal gas behavior.
This can be expressed as Eq. (4). If the total pressure and mole fraction of each gas in the mixture are known, then the partial pressure of the components in the mixture can be calculated through Eq. (4).
(4)
2-3. Gas deflagration index
Explosions vary depending on the type, temperature, pressure, concentration of the fuel, as well as the type of opening. NFPA 68 recommends the design of outlets, such as rupture plates, to prevent overpressure caused by explosions. The gas deflagration index, which is significantly affected by pressure, is obtained using the maximum explosion pressure rise rate and volume of the vessel. It is used in determining the size, thickness, and number of outlets required in confined spaces. It is calculated as shown in Eq. (5) [8].
where, is the maximum explosion pressure rise rate and V is the volume of the confined vessel (0.0011 m3).
(5) 3. Experiment
3-1. Experimental samples
Propylene, C3H6, is an olefinic hydrocarbon often used as a basic raw material to produce synthetic materials via addition polymerization
reaction in petrochemical and polymer industries. The samples used in this study were propylene (purity 99.9%) supplied from Seonggwang Special Gas, CO2 (purity 99.99%), an inert gas, and O2 (purity 99.99%) supplied from Cheon-ma Industrial Gas Co., Ltd.
3-2. Experimental setup
Fig. 1 shows an explosive device fabricated in accordance with the ASTM E 918-83 [18]. The inner volume of the explosive vessel is 1.1 L. The vessel includes thermocouples and pressure sensors for measuring temperature and pressure. The explosive vessel (outer diameter: 148 mm, inner diameter: 105 mm) was fabricated as an enclosure (length 400 mm × width 300 mm × height 330 mm) composed of insulating materials to maintain the set temperature.
A k-type Thermocouple (O.D 1.0 mm) was used to measure the temperature. As for the pressure sensor, Sejin Co. (S-1100) with a 0~100 barg measurement range was used on the side of the vessel.
Digital pressure gauges from Copal Electronics (PG-200-103GP-S with a 0~10 barg measurement range and PG-200-102VP-S with a –1~0 barg range) were installed to measure pressures during gas injection. At the bottom of the vessel, a vacuum pump (TRP-12) with a vacuum pressure of 0.4 Pa was used to inject and discharge gas. For the energy supply, a high-voltage device with a 0~10 kV measurement range (TOS 5101, Kikusui) was used.
The explosion was determined through an amplifier (Tokyo Sokki Kenkyujo, DA-16A) capable of amplifying the signal of the pressure sensor, and an oscilloscope (Tektronix, TDS 3014) capable of measuring the amplified signal. The obtained data were stored in a computer.
3-3. Experimental method
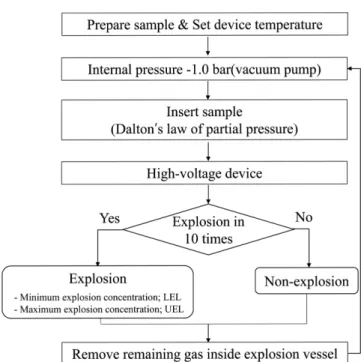
The experiment was conducted following the sequence shown in Fig. 2.
1. The propylene, oxygen, and carbon dioxide were prepared,
PV nRT m
M---RT
= =
Pt Pi
i 1=
∑
n=
Vt Vi
i 1=
∑
n=
Pi Pt ---- Vi
Vt ---- ni
nt ---- yi
= = =
Kg dp ---dt
⎝ ⎠⎛ ⎞
max V
13
× ---
=
Fig. 1. Schematic diagram of experimental apparatus for explosion measurement.
1. Control box 6. Oxygen bombe
2. Explosion vessel 7. High voltage transformer
3. Vacuum pump 8. Amplifier
4. Propylene bombe 9. Oscilloscope 5. Carbon dioxide bombe 10. Computer
and the temperature of the explosive vessel was established using a temperature control device.
2. A vacuum state with a -1.0 barg pressure was obtained inside the explosive device using a vacuum pump.
3. The amount of each gas to be injected was calculated using Dalton’s law of partial pressure. The gases were injected using a precision value (NV2H-4T) at the corresponding pressure values through the vacuum gauge installed at the top of the explosive device.
4. Once the mixing of the gases was complete, the ignition switch of the high-voltage device was operated and the result was observed. If an explosion occurred, the pressure was recorded on the oscilloscope through the amplifier.
5. The experiment was performed ten or more times at the same concentration. If at least one explosion occurred, the minimum concentration was established as the lower explosion limit and the maximum concentration was established as the upper explosion limit.
4. Results and Discussion
4-1. Explosion pressure and explosion pressure rise rate with respect to the oxygen concentration, temperature, and pressure
4-1-1. At 25 °C
The process of dropping the oxygen concentration below the minimum level by adding an inert gas to increase safety in transporting, storing, and handling materials and to prevent an explosion is referred to as inerting.
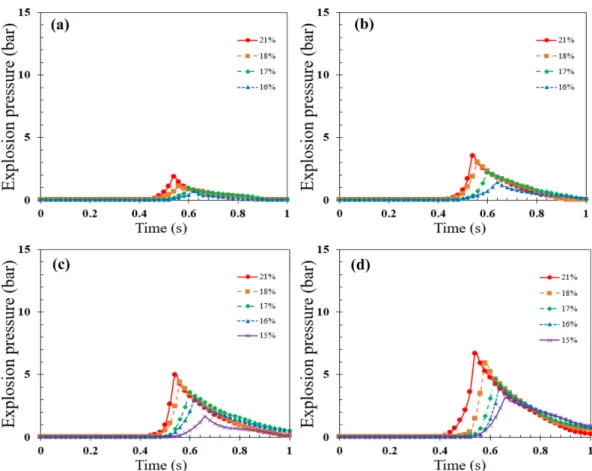
Fig. 3 and 4 show the results of the experiment in which the concentration of propylene was fixed at 5% and its pressure was Fig. 2. Flowchart of experimental method.
Fig. 3. Relationship between explosion pressure of propylene and time according to oxygen concentrations at 25°C. (a) 1.0 bar, (b) 1.5 bar, (c) 2.0 bar, (d) 2.5 bar.
increased from 1.0 to 2.5 barg using carbon dioxide, an inert gas, at 25 °C.
Fig. 3 shows the explosion pressures by a, b, c and d, and Figure 4 shows the explosion pressure rise rate by a', b', c', and d'.
When the oxygen concentration was 21% and the pressure was 1 barg, the explosion pressure at 0.50 s was 1.49 barg, and the maximum explosion pressure at 0.52 s was 2.40 barg, so demonstrated a pressure rise rate of 45.60 barg/s.
In addition, at 21% oxygen concentration, the maximum explosion pressure increased from 2.40 barg at a pressure of 1.0 barg to 8.26 barg at a pressure of 2.5 barg. In addition, the maximum explosion pressure rise rate increased from 45.6 barg/s to 182.4 barg/s as the pressure increased from 1.0 to 2.5 barg under the oxygen concentration of 21%.
The maximum explosion pressure and the maximum explosion pressure rise rate appear to have increased as the initial pressure increased because the number of collisions between molecules in the vessel increased.
4-1-2. At 100 °C
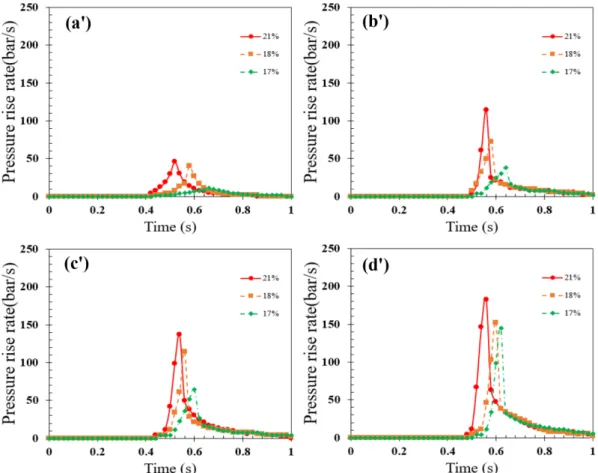
Fig. 5 and 6 show the results of the explosion pressure and pressure rise rate of propylene when the pressure varied from 1.0 to 2.5 barg under the same concentration at 100 °C. Fig. 5 shows the explosion pressures by a, b, c and d, and Fig. 6 shows the explosion
pressure rise rate by a', b', c', and d'. The maximum explosion pressure at 1.0 barg was 3.54 barg for an oxygen concentration of 21%, 3.01 barg for 18%, 2.25 barg for 17%, and 1.42 barg for 16%.
The maximum explosion pressure rise rate was 38.0 barg/s for an oxygen concentration of 21%, 22.8 barg/s for 18%, 20.9 barg/s for 17%, and 15.2 barg/s for 16%. When the oxygen concentration was 21% and the pressure rose from 1.0 barg to 2.5 barg, the maximum explosion pressure of propylene increased from 3.54 barg to 6.67 barg, and the maximum explosion pressure rise rate increased from 38.0 barg/s to 152.0 barg/s. This is considered to occur for the same reason as 25 °C.
4-1-3. At 200 °C
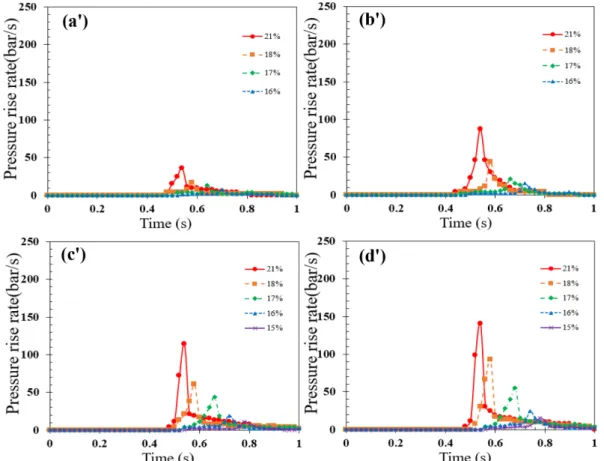
Fig. 7 and 8 show the results of the explosion pressure and pressure rise rate of propylene when the pressure varied from 1.0 to 2.5 barg under the same concentration at 200 °C. Under the oxygen concentration of 21%, the maximum explosion pressure increased from 3.47 barg to 5.14 barg as the maximum explosion pressure increased from 1.0 to 2.5 barg. The maximum explosion pressure rise rate increased from 36.1 to 140.6 barg/s. At constant temperature and pressure, the maximum explosion pressure time decreased as the oxygen concentration increased. This appears to be because the temperature and pressure of the flame propagation surface increased with the explosion due to the pressure wave reflected from the inner dp
---dt
Fig. 4. Relationship between explosion pressure rise rate of propylene and time according to oxygen concentrations at 25°C. (a') 1.0 bar, (b') 1.5 bar, (c') 2.0 bar, (d') 2.5 bar.
Fig. 5. Relationship between explosion pressure of propylene and time according to oxygen concentrations at 100°C. (a) 1.0 bar, (b) 1.5 bar, (c) 2.0 bar, (d) 2.5 bar.
Fig. 6. Relationship between explosion pressure rise rate of propylene and time according to oxygen concentrations at 100°C. (a') 1.0 bar, (b') 1.5 bar, (c') 2.0 bar, (d') 2.5 bar.
Fig. 7. Relationship between explosion pressure of propylene and time according to oxygen concentrations at 200°C. (a) 1.0 bar, (b) 1.5 bar, (c) 2.0 bar, (d) 2.5 bar.
Fig. 8. Relationship between explosion pressure rise rate of propylene and time according to oxygen concentrations at 200°C. (a') 1.0 bar, (b') 1.5 bar, (c') 2.0 bar, (d') 2.5 bar.
wall of the pressure vessel to the flame surface, and the chemical reaction accelerated due to the increase in the number of collisions between gas molecules.
4-2. Gas deflagration index with respect to the temperature and pressure
Tables 1, 2, and 3 show the gas deflagration index with respect to pressure at varied oxygen concentrations and temperatures, as per Eq. (5). The gas deflagration index for changes in oxygen concentration and pressure at 100 °C and 200 °C was calculated in the same manner as for the standard state. The gas deflagration index decreased by the maximum explosion pressure rise rate as the oxygen concentration decreased at the same temperature. The gas deflagration index increased as the pressure increased.
5. Conclusions
We measured the explosion pressure, the rate of explosion pressure rise and the deflagration index according to change in temperature (25 °C, 100 °C, 200 °C) and pressure (1.0 barg, 1.5 barg, 2.0 barg, 2.5 barg) using flammable gas propylene and inert gas carbon dioxide. Through this, we aimed to provide the basic data for prevention of fire and explosion in the processes using propylene.
First, at 21% oxygen concentration, the maximum explosion pressure increased from 2.40 barg at a pressure of 1.0 barg to 8.26 barg at a pressure of 2.5 barg. In addition, the maximum explosion pressure rise rate increased from 45.6 barg/s to 182.4 barg/s as the
pressure increased from 1.0 to 2.5 barg under the oxygen concentration of 21%. The degree of explosion risk can be determined through the explosion pressure and the speed at which the explosion pressure rises.
Second, at constant temperature and pressure, the maximum explosion delay time decreased as the oxygen concentration increased.
Third, the gas deflagration index (Kg) was calculated from the maximum explosion pressure rise rate and the volume of the vessel.
It decreased as the oxygen concentration decreased and increased as the pressure increased. The index is used in determining the size, thickness, and number of outlets required in confined spaces.
The conditions required in the petrochemical industry are diverse;
thus, it is judged that data on design, manufacture, and operation can be used based on the data presented in this study.
Nomenclature
P : Absolute pressure [kPa]
V : Volume [m3]
R : Gas constant [kPa·m3/kg·K]
T : Absolute temperature [K]
n : Number of moles [kmol]
M : Molecular mass [kg/kmol]
m : Mass [kg]
ni : Mole of component [mol]
nt : Total mole of all components [mol]
Vi : Volume of component [m3]
Vt : Total volume of all components [m3] Pi : Partial pressure of component [kPa]
Pt : Total pressure of all components [kPa]
Kg : Gas deflagration index [barg·m/s]
: Pressure rise rate [barg/s]
References
1. Daniel, A. C. and Louvar, J. F., Chemical Process Safety Fun- damentals with Applications, 2nd ed., Prentice Hall PTR, New Jersey, 252-266(2007).
2. Steen, H. and Hattwig, M., Handbook of Explosion Prevention and Protection, 1st ed., Wiley-VCH Verlag GmbH & Co. KGaA, Weinheim, Germany, 271-370(2004).
3. Hattwig, H. P. and Park, Y. J., Combustion Engineering, Hwasoo- mok, Korea, 259-261(2015).
4. Ha, D. M., “Measurement and Prediction of Fire and Explosion Properties of n-Ethylanilne,” Korean J. Chem. Eng. Res., 56(4), 474-478(2018).
5. Park, D. J. and Lee, Y. S., “Experimental Investigation of Explosion Pressures and Flame Propagations by Wall Obstruction Ratios and Ignition Positions,” Korean J. Chem. Eng. Res., 29, 139-144 (2012).
6. Giurcan, V., Mitu, M., Razus, D. and Oancea, D., “Influence of Inert Additives on Small-Scale Closed Vessel Explosions of Pro- dp
dt
--- Table 1. Kg; Gas deflagration index according to the pressure at 25 °C
Pressure [bar]
O2 [%]
Kg [bar·m/s]
1.0 bar 1.5 bar 2.0 bar 2.5 bar
21.0 4.71 11.77 14.12 18.83
18.0 4.12 7.45 11.77 15.69
17.0 1.18 3.92 6.67 14.91
Table 2. Kg; Gas deflagration index according to the pressure at 100 °C Pressure [bar]
O2 [%]
Kg [bar·m/s]
1.0 bar 1.5 bar 2.0 bar 2.5 bar
21.0 3.92 9.61 12.16 15.69
18.0 2.35 5.88 10.00 12.55
17.0 2.16 4.71 6.28 8.04
16.0 1.57 1.96 5.30 7.06
15.0 2.35 4.31
Table 3. Kg; Gas deflagration index according to the pressure at 200 °C Pressure [bar]
O2 [%]
Kg [bar·m/s]
1.0 bar 1.5 bar 2.0 bar 2.5 bar
21.0 3.73 9.02 11.77 14.51
18.0 1.77 4.51 6.28 9.61
17.0 1.37 2.16 4.51 5.69
16.0 0.78 1.57 1.96 2.55
15.0 1.18 1.57
pane-Air Mixture,” Fire Safety J., 111, 102939(2020).
7. Song, K. H., Han, S. E. and Park, K. H., “Heat Transfer Effect of Inert Gas on Multi-Tubular Reactor for Partial Oxidation Reac- tion,” Korean J. Chem. Eng. Res., 18(2), 184-189(2001).
8. National Fire Protection Association 68, Guide for Venting of Deflagrations, Quincy, MA: NFPA(1998).
9. Nassimi, A. M., Jafari, M., Farrokhpour, H. and Keshavarz, M.
H., “Constants of Explosive Limits,” Chem Eng Sci., 173, 384-389 (2017).
10. Lee, T. S., A Study on Explosion Characteristic of DEM-LPG Mixture, Dept. of Energy Safety Engineering, Graduate School of Energy and Environment, Seoul National University of Tech- nology, 11-13(2008).
11. Mitu, M., Prodan, M., Giurcan, V., Razus, D. and Oancea, D.,
“Influence of Inert Gas Addition on Propagation Indices of Meth- ane–Air Deflagrations,” Proc. Saf. Environ, 102, 513-522(2016).
12. Cong, T. L., Bedjanian, E. and Dagaut, P., “Oxidation of Eth- ylene and Propene in the Presence of CO2 and H2O: Experimen- tal and Detailed Kinetic Modeling Study,” Combustion Science
and Technology, 182, 4-6(2010).
13. Chen, S., Shen, H., Zhu, Q. and Liang, D., “Effect of Initial Temperature and Initial Pressure on Vapor Explosion Characteris- tics of Nitro-Thinner,” J. Loss Prevent. Proc., 61, 298-304(2019).
14. Shen, X., Zhang, B., Zhang, X. and Xiu, G., “Explosion Charac- teristics of Methane-Ethane Mixtures in Air,” J. Loss Prev. Pro- cess Ind., 45, 102-107(2017).
15. Leffler, W. L., Natural Gas Liquids: A Nontechnical Guide, Pen- nWell Books, Tulsa, Oklahoma, USA, 112-115(2014).
16. Cengel, Y. A. and Cimbala, J. M., Fluid Mechanics: Fundamen- tals and Applications 4 Edition in SI Units, Mc-Graw-Hill, New York, 40-42(2019).
17. Yan, X. T. and Xu, Y., Chemical Vapor Deposition: An Integrated Engineering Design for Advanced Materials, Springer, London, 29-30(2010).
18. American Society for Testing and Materials, ASTM E918–83:
Standard Practice for Determining Limits of Flammability of Chemicals at Elevated Temperature and Pressure, West Consho- hocken, PA, 2-3(2011).
![Fig. 1 shows an explosive device fabricated in accordance with the ASTM E 918-83 [18]](https://thumb-ap.123doks.com/thumbv2/123dokinfo/5403660.218110/2.892.464.823.834.1050/fig-shows-explosive-device-fabricated-accordance-astm-e.webp)
![Table 3. K g ; Gas deflagration index according to the pressure at 200 °C Pressure [bar]](https://thumb-ap.123doks.com/thumbv2/123dokinfo/5403660.218110/7.892.66.427.270.398/table-gas-deflagration-index-according-pressure-pressure-bar.webp)
