Rod-shaped nickel-ferrite (NiFe2O4) nanoparticles were synthesized using a coprecipitation method and were coated with dextran during the synthesis. Transmission electron microscope (TEM) images showed that the average length and width of these particles were 16.86 nm and 3.92 nm, respectively. The coating status of the dextran on the surface of the particles was confirmed by using Fourier-transform infrared spectroscopy. X-ray diffraction measurements showed that the particles had a spinel crystalline structure. The paramagnetic behavior of the particles provided the contrast effects in magnetic resonance imaging (MRI). The T1and the T2relaxivities were 2.05 mM−1·s−1 and 4.92 mM−1·s−1, respectively. The T2 relaxivity was more than twice the T1 relax- ivity. However, the T1 relaxivity value was still appropriate for the application of these particles as T1 contrast agents. These findings show that the rod-shaped particles fabricated in this research can be employed as both T1 and T2 MRI contrast agents.
PACS numbers: 75.20.-g, 81.05.-t, 75.50.Tt, 76.60.-k
Keywords: Nickel-ferrite nanoparticles, Dextran coating, Magnetic resonance imaging contrast agents
I. INTRODUCTION
Magnetic nanoparticles attract significant research in- terests, in particular, for biomedical applications where they can act as contrast agents in magnetic resonance imaging (MRI) [1,23], carriers in targeting drug delivery systems [4–6], heat generators in a magnetic hyperther- mia [7–9], etc. Commercial nanoparticle contrast agents are currently used for clinical applications. Several clin- ical applications of magnetic nanoparticles for a hyper- thermia treatment of cancer have been reported [10–12].
Various magnetic nanoparticles are studied for applica- tions in targeting drug delivery systems.
Ferrite nanoparticles are extensively investigated for biomedical applications. Ferrite has the chemical com- position of MFe2O4, where M is a metallic cation such
∗E-mail: [email protected]
as Fe2+, Mn2+, Co2+, Ni2+, etc. Among various forms of ferrites, the iron ferrite (magnetite, Fe3O4) nanopar- ticles have been widely used in biomedical applications owing to their simple synthesis and chemical stability.
Other ferrites are investigated for specific applications owing to their tailored characteristics. The ferrite has a cubic crystalline structure where 32 O2− ions form a face centered cubic (FCC) structure, 8 tetrahedral sites are occupied by Fe3+, 8 of the 16 octahedral sites are occupied by M2+, while the other 8 octahedral sites by Fe3+ ions. The directions of the magnetic moments of Fe3+ at tetrahedral sites and Fe+3 at octahedral sites are antiparallel, hence their magnetic moments are can- celled out. Therefore, the magnetic moment of ferrite is attributed to the M2+ ions. The ferrite has an inverse spinel crystalline structure [13,14].
Most of the magnetic nanoparticles are toxic, hence they cannot be directly used in a human body. For med- ical applications, the surface of the particle should be
This is an Open Access article distributed under the terms of the Creative Commons Attribution Non-Commercial License (http://creativecommons.org/licenses/by-nc/3.0) which permits unrestricted non-commercial use, distribution, and reproduction in any medium, provided the original work is properly cited.
Fig. 1. (Color online) (a) TEM image and (b) particle size distribution of the dextran-coated nickel-ferrite nanoparti- cles.
coated with a biocompatible material. Various materi- als are studied for the coating of magnetic nanoparticles, such as dextran [15,16], chitosan [17], silica [18], carbon [19], gold [20,21], etc.
We report the synthesis and characterization of dextran-coated nickel-ferrite nanoparticles for potential applications as contrast agents in MRI. The particles were rod-shaped and exhibited a paramagnetic behav- ior, caused by their shape anisotropy. The function of the particles as contrast agents was observed using an MRI scanner. The T1and T2relaxivities of the particles were determined using magnetic resonance (MR) images, which demonstrated that their relaxivities were compara- ble to those of a commercial Gd-DTPA. This reveals that the proposed rod-shaped dextran-coated nickel-ferrite nanoparticles could be employed as MRI contrast agents.
II. EXPERIMENTAL METHODS
The rod-shaped nickel-ferrite nanoparticles were syn- thesized using the coprecipitation method. The surfaces of the nanoparticles were coated with dextran simulta- neously during their synthesis. First, 3 ml of 0.3 M NiCl2·4H2O aqueous solution was mixed with 3 ml of 0.6 M FeCl3·6H2O aqueous solution. Then, 6 ml of 2%
(w/w) dextran solution was added to this mixture in a
250 ml double walled beaker. The temperature of the circulating water across the double walled beaker was maintained at 4 ◦C. Air bubbles were introduced into the mixture using a pipette for 1 h. During the forma- tion of nanoparticles, dextran adheres to the surface of the particles at a PH of around 7. In order to achieve this condition, 1% (v/v) NaOH was added dropwise to the re- action mixture at a rate of 1 mL/min. In order to stabi- lize the nanoparticles, the final solution was placed in an ultrasonic environment for 10 h, followed by a filtration using a 100 nm filter. The size of the nanoparticles de- pends on the ultrasonic treatment time, as the ultrasonic treatment provides an energy to dissociate the excessive dextran from the coated particles. A coated nanopar- ticles powder sample was obtained by placing the wet particles in an air environment at a temperature of 70
◦C for approximately 12 days.
Crystallinity and phase purity were investigated by X- ray diffraction (XRD, X’pert PRO, PANalytical) in or- der to confirm the spinel structure of the nanoparticles.
A chemical composition analysis was performed using inductively coupled plasma spectroscopy (ICP, IRISAP, Thermo Jarrell Ash). The shape and size of the nanopar- ticles were investigated using a transmission electron mi- croscope (TEM, HT 7700, Hitachi Ltd). Fourier trans- form infra-red spectroscopy (FTIR, Nicolet 380, Thermo Scientific USA) measurements were performed in order
crystal planes in the figure match with those of an inverse spinel ferrite.
to evaluate the status of the coating. Magnetic properties of the particles were measured using a SQUID magne- tometer (MPMS XL 7, Quantum Design). MRI contrast effects were observed using a 4.7 T MRI System (Bruker Biospec 47/40).
III. RESULTS AND DISCUSSION
Fig. 1 shows a TEM image and size distribution of the rod-shaped nickel-ferrite nanoparticles. An average length and width of 16.86 nm and 3.92 nm, respectively, were determined. These size values were obtained using histograms of 100 particles observed in the TEM image.
The crystalline structure of the particles was observed using X-ray diffraction. XRD patterns for the particles are shown in Fig. 2. The particles showed a spinel crys- talline structure; the crystalline indices of (220), (311), (400), (422), (511), and (422) were identified in the XRD patterns [JCPDS No. 10-3025].
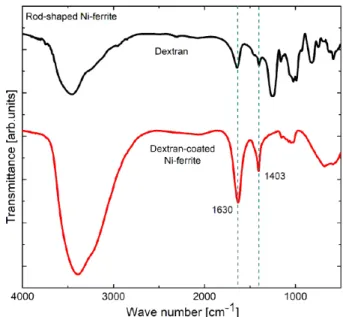
The coating status of dextran on the surfaces of the nickel-ferrite nanoparticles was studied using FTIR spec- troscopy, as shown in Fig. 3. This figure shows the com- parison of FTIR spectra of dextran and dextran-coated nickel-ferrite nanoparticles. The absorption bands at 1600 cm−1 and 3400 cm−1 correspond to the O-H stretching mode of the hydroxyl group and O-H deforma- tion mode of the water molecules, respectively. The C-O vibration mode of dextran corresponds to the band in the range of 1040∼ 1150 cm−1. The bands at 1630 cm−1and
Fig. 3. (Color online) FTIR spectra of a pure dextran and dextran-coated nickel-ferrite nanoparticles. The ab- sorption bands correspond to the stretching and vibra- tion modes of specific chemical bonds.
1403 cm−1 emerge from the O-H stretching and C-H vi- bration modes of dextran, respectively. The absorption strengths of these bands are almost equal. However, the absorption strength of the O-H stretching mode for the dextran-coated particles is larger than that of the C-H vibration mode, which can be attributed to the hydro- gen bonding between the surface oxygen and hydroxyl of the dextran [22,23]. The FTIR spectra demonstrate the dextran coating on the particles’ surfaces.
The magnetic properties of the particles were mea- sured using a SQUID system. The dependence of the magnetization as a function of the field strength is shown in Fig. 4. The magnetic particles showed a paramagnetic behavior with a curved structure near zero field owing to the large anisotropy along the length direction, which is shown in references [24,25].
The T1 and T2 relaxation times of the nuclear spins (hydrogen protons) in the aqueous solution of magnetic nanoparticles were measured using an MR scanner. For these measurements, ten samples with different particle concentrations, ranged from 0.025 mM to 2 mM, were prepared. The particle concentration in the solution was determined using an ICP spectroscopy.
The spin-lattice relaxation time T1mainly depends on the rate of energy transfer from the nuclear spins to the neighboring molecules. However, the spin-spin re- laxation time T2 depends on the dephasing process of
Fig. 4. (Color online) Magnetic moment of the nanopar- ticles as a function of the applied magnetic field. The particles exhibit a paramagnetic behavior owing to their shape anisotropy.
the nuclear spins caused by the neighboring magnetic inhomogeneity. The T1 and T2 relaxation times of the nuclear spins in a pure water are equal and have a value of approximately 3 s. The nuclear spins of a human tis- sue have different relaxation times that depend on its water content and surroundings. The relaxation times of the nuclear spins in a certain tissue are decreased by the introduction of magnetic particle contrast agents. If MRI contrast agents (an aqueous solution of magnetic particles) are injected into human body, these particles are absorbed only by normal tissues [14]. Owing to the lack of reticuloendothelial systems in cancer tissues, they have no capability to capture the nanoparticles by rec- ognizing them as external invaders. A T1contrast agent increases the T1relaxation at a normal tissue site, which increases the signal from that site and provides a brighter image compared with that of the cancer site. On the other hand, a T2contrast agent accelerates the T2relax- ation at a normal tissue, which decreases the MR signal at that site, while the MR signal at the cancer site re- mains unaltered. Therefore, a T2 agent can be used to distinguish between the cancer and normal tissues.
For the T1 measurements, an inversion recovery pulse sequence was used. In this sequence, the signal intensi- ties as a function of time can be expressed as:
I∼ M0
(
1− 2e−T1t )
. (1)
Using the MR intensities and Eq. (1), we can obtain the T1 relaxation time, as shown in Fig. 5 for samples
Fig. 5. (Color online) T1 relaxation for three represen- tative samples. The dotted line represents the zero MR signal intensity. It can be noticed that the T1 relaxation is faster for the sample that has a larger particle concen- tration.
Fig. 6. (Color online) T2relaxation for three representa- tive samples. It can be noticed that the T2 relaxation is faster for the sample that has a larger particle concen- tration.
that have three different representative particle concen- trations.
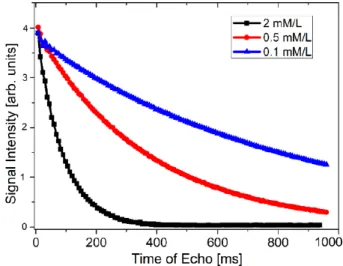
The Carr-Purcell-Meiboon-Gill (CPMG) pulse se- quence with a multiple spin echo was used for the T2
measurements. The signal intensity is related to the T2
relaxation time:
I∼ M0e−T2t , (2) which was used to determine the value of the T2 relax- ation time. Fig. 6 shows the T2 relaxation for samples that have three different representative particle concen- trations.
creases. In a T1 relaxation, the MR images of both sam- ples become brighter with the imaging time. However, the MR image of the 2 mM sample becomes brighter, much faster compared with the 0.1 mM sample. On the other hand, in a T2 relaxation, the MR images of both samples become darker with the imaging time. However, the MR image of the 2 mM sample becomes darker much faster compared with the 0.1 mM sample.
Relaxivity is a measure of the ability of the MRI con- trast agent to increase the relaxation of the surrounding nuclear spins, which can be used to improve the contrast of the MR images. The relaxivity is expressed in units of s−1/mM (of nanoparticles).
The relaxivities (1/Tim) of nuclear spins in an aqueous solution of magnetic nanoparticles can be expressed as [26]:
1 Tim = 1
Ti + RiC , (3)
where i = 1 or 2, 1/Ti represent the relaxivities of the nuclear spins without a nanoparticle contrast agent, Ri
are the relaxivities of the nuclear spins per millimolar of nanoparticles, and C represents the concentration of nanoparticles in the aqueous solution.
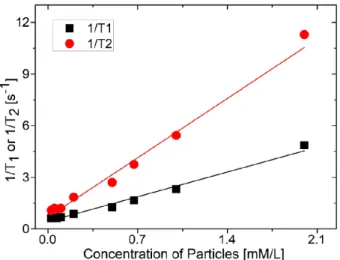
The dependence of both 1/T1 and 1/T2 as a function of the particle concentration are shown in Fig. 8. In this figure, the slope reveals the relaxivity values. It was determined that the T1 and T2 relaxivities are 2.05 mM−1·s−1and 4.92 mM−1·s−1, respectively. The T1and T2 relaxivities of the commercial paramagnetic contrast agent Magnevist (Gd-DTPA) are 4.3 mM−1·s−1 and 4.4 mM−1·s−1, respectively [14]. However, the commercial spherical nanoparticles contrast agent Feridex IV shows
Fig. 8. (Color online) Dependence of 1/T1 and 1/T2 as a function of the particle concentration. The slope of the straight line reveals the T1 and T2 relaxivities of the nanoparticles.
a significantly larger T2 relaxivity of approximately 60 mM−1·s−1, owing to the large particle size and super- paramagnetic behavior [14]. Our dextran-coated nickel- ferrite nanoparticles showed a similar relaxivity, com- pared with that of the commercial paramagnetic agent Gd-DTPA. Therefore, the particles can be employed as both T1 and T2MRI contrast agents.
IV. CONCLUSION
Nickel-ferrite nanoparticles were synthesized using a coprecipitation method. Dextran coating was performed on the surface of the particles during their synthesis.
TEM measurements showed that the particles are rod- shaped. The average length and width of the particles were 16.86 nm and 3.92 nm, respectively. Using FTIR spectroscopy, we confirmed the presence of dextran coat- ing on the surface of the particles. The particles showed a paramagnetic behavior owing to their shape anisotropy.
In addition, XRD measurements demonstrated the spinel crystalline structure of the particles. The function of the particles as T1and T2 contrast agents was evaluated us- ing an MRI scanner. The T1 and T2 relaxivities were obtained as 2.05 mM−1·s−1and 4.92 mM−1·s−1, respec- tively. The T1 and T2 relaxivities were comparable with those of the commercial Gd-DTPA. Therefore, we can conclude that our particles are suitable for applications as both T1and T2 MRI contrast agents.
REFERENCES
[1] D. Pouliquen, J. J. Le Jeune, R. Perdrisot, A. Er- mias and P. Jallet, Magn. Res. Imaging 9, 275 (1991).
[2] T. Ahmad, H. Bae, I. Rhee, Y. Chang and J. Lee et al., Curr. Appl. Phys. 12, 969 (2012).
[3] T. Ahmad, H. Bae, Y. Iqbal, I. Rhee and S. Hong et al., J. Magn. Magn. Mater. 381, 151 (2015).
[4] M. Liong, J. Lu, M. Kovochih, T. Xia and S. G Ruehm et al., ACS Nano 2, 889 (2008).
[5] J. Dobson, Drug. Dev. Res. 67, 55 (2006).
[6] R. D. K. Misra, Mater. Technol.: Adv. Perform.
Mater. 25, 118 (2010).
[7] H. S. Huang and J. F. Hainfeld, Int. J. Nanomed.
8, 2521 (2013).
[8] Y. Iqbal, H. Bae, I. Rhee and S. Hong, J. Magn.
Magn. Mater. 409, 80 (2016).
[9] A. Ahmad, H. Bae, I. Rhee and S. Hong, J. Magn.
Magn. Mater. 447, 42 (2018).
[10] R. D. Tucker, C. E. Platz, C. Huidobro and T. Lar- son, Urology 60, 166 (2002).
[11] B. Thiesen and A. Jordan, Int. J. Hyperthermia 24, 467 (2008).
[12] T. Kobayashi, K. Kakimi, E. Nakayama and K. Jim- bow, Nanomedicine 9, 1715 (2014).
[15] T. Ahmad, H. Bae, I. Rhee, S. Hong and Y. Chang et al., J. Nanosci. Nanotechnol. 11, 5645 (2011).
[16] R. Y. Hong, B. Feng, L. L. Chen, G. H. Liu and H.
Z. Li et al., Biochem. Eng. J. 42, 290 (2008).
[17] S. Hong, Y. Chang and I. Rhee, J. Korean Phys.
Soc. 56, 868 (2010).
[18] Y. Iqbal, H. Bae, I. Rhee and S. Hong, J. Nanosci.
Nonotechnol. 16, 11862 (2016).
[19] H. Bae, T. Ahmad, I. Rhee, Y. Chang and S. Jin et al., Nano. Res. Lett. 7, 44 (2012).
[20] T. Ahmad, H. Bae, I. Rhee, Y. Chang and S. Jin et al., J. Nanosci. Nonotechnol. 12, 5132 (2012).
[21] J. Lin, W. Zhou, A. Kumbhar, J. Wiemann and J.
Fang et al., J. Solid State Chem. 159, 26 (2001).
[22] M. Khalkhali, S. Sadighian, K. Rostamizadeh, F.
Khoeini and M. Naghibi et al., Bioimpacts 5, 141 (2015).
[23] M. M. Yallapu, M. Jaggi and S. C. Chauhan, Col- loids Surf. B Biointerfaces 79, 113 (2010).
[24] F. N. Sayed and V. Polshettiwar, Sci. Rep. 5, 9733 (2015).
[25] V. Závis̆ová, N. Tomas̆ovic̆ová, J. Kovác̆a, M. Kon- eracká and P. Kopc̆anský et al., in Proceedings of NANOCON 2010 (Olomouc, Czech Republic, EU).
[26] Y. Okuhata, Adv. Drug Deliv. Rev. 37, 121 (1999).