Annual Report of the Korean Association of
External Quality Assessment Service on General Chemistry (2020)
Yong-Wha Lee
Department of Laboratory Medicine and Genetics, Soonchunhyang University Bucheon Hospital, Soonchunhyang University College of Medicine, Bucheon, Korea
Corresponding author:
Yong-Wha Lee
Department of Laboratory Medicine and Genetics, Soonchunhyang University Bucheon Hospital, Soonchunhyang University College of Medicine, 170 Jomaru-ro, Wonmi-gu, Bucheon 14584, Korea
Tel +82-32-621-5943 E-mail [email protected]
This is an Open Access article distributed under the terms of the Creative Commons Attribution Non-Commercial License (http://creativecommons.org/licenses/
by-nc/4.0) which permits unrestricted non-commercial use, distribution, and reproduction in any medium, provided the original work is properly cited.
In 2020, the general chemistry proficiency testing program of the Korean Association of External Quality Assessment Service consisted of routine and urine chemistry programs including 29 and 13 test items, respectively.
Creatinine among routine chemistry programs was integrated into the accuracy-based creatinine test program. The routine and the urine chemistry programs were conducted 4 times and twice a year, respectively. Statistical analyses data for the test methods and reagent companies were reported based on the information and results of the test items provided by each institution. Statistical analyses included the number of participating institutes, mean, standard deviation, coefficient of variation (CV), median, and minimum and maximum values for each group. Each report included tables, histograms, Levey-Jennings charts, and the standard deviation indices showing the statistics of each test item. More than 1,000 institutions performed the 16 test items of the routine chemistry program and the number is continuously increasing. Alkaline phosphatase and lactate dehydrogenase were found to have relatively high CVs due to differences in results among the test methods; however, the CV values for others, ranged within 10%. In the urine chemistry program, albumin showed a relatively high CV.
(Lab Med Qual Assur 2021;43:107-121)
Key Words Proficiency testing, General chemistry, Korean Association of External Quality Assessment Service
서론
대한임상검사정도관리협회 신빙도조사사업은 차세대 신빙도 조사사업으로 확장 개편되어 2021년 현재 6년째를 맞이하고 있 다. 2020년에는 6개 대분류하에 69개 프로그램 단위별 운영체계 로 확대되었고, 프로그램별 검사종목도 338종목으로 증가하였다 [1-4]. 임상화학 분야는 6개의 대분류 중 하나로서 일반화학검사 등 10개의 중분류 분야로 구성되어 있고, 이들은 일반화학검사와 요화학검사 등 25개의 세부 프로그램으로 나뉜다. 일반화학검사
와 요화학검사 프로그램에는 각각 29종과 13종의 검사항목이 포 함되어 있다. 일반화학검사 종목에서 creatinine은 정확도기반 creatinine 검사 프로그램으로 통합되었다.
2020년 대한임상검사정도관리협회의 신빙도조사사업으로 시
행되었던 일반화학검사와 요화학검사에 대한 신빙도조사사업 결
과를 분석하여 보고하고자 한다.
재료 및 방법
1. 대상
일반화학검사 프로그램은 연 4회에 걸쳐, 회차별로 3개의 정도 관리물질이 이용되어 시행되었다. 물질은 냉장상태가 유지될 수 있도록 아이스팩이 내장된 특수 제작박스에 넣어 참여 등록기관을 대상으로 각 회차별로 2월, 4월, 9월과 10월에 발송되었다. 요화 학검사 프로그램은 연 2회에 걸쳐, 회차별로 3개의 정도관리물질 이 이용되었고 1회차와 2회차를 각각 2월과 10월에 발송하였다.
2. 정도관리물질과 검사항목
일반화학검사의 정도관리물질은 Bio-Rad사(Bio-Rad Labo- ratories, Hercules, CA, USA)의 사람 혈청을 기질로 한 분말제 품을 사용하였다(Table 1). 요화학검사의 정도관리물질도 Bio- Rad사의 Lyphochek Quantitative Urine Control (Bio-Rad
Laboratories)을 사용하였다(Table 2).
참여기관에서는 수령한 물질에 대해 검사 시행 후 회신 마감 일 이내에 대한임상검사정도관리협회 신빙도조사사업 홈페이지 (http://eqas.keqas.org)에 결과를 입력하였다. 협회에서는 기기 회사와 시약회사로부터 제공된 검사항목별 검사방법, 기기와 시약 에 대한 데이터베이스를 지속적으로 업데이트하고 있고, 참여기관 이 홈페이지상에서 해당 검사항목에 대한 검사정보 선택과 결과 입력이 가능하도록 하였다.
3. 결과 판정 및 분석
각 기관에서 입력한 각 검사항목에 대한 정보와 결과를 기반으 로 검사방법, 기기, 시약에 따라 통계분석을 시행하였다. 결과보고 서는 전체 참여기관의 특성을 보여주는 공통보고서와 개별기관에 대한 평가결과를 보여주는 기관별 보고서로 구성되어 있다. 공통 보고서에는 전체 참여기관에 해당하는 통계, 검사방법을 기준분류
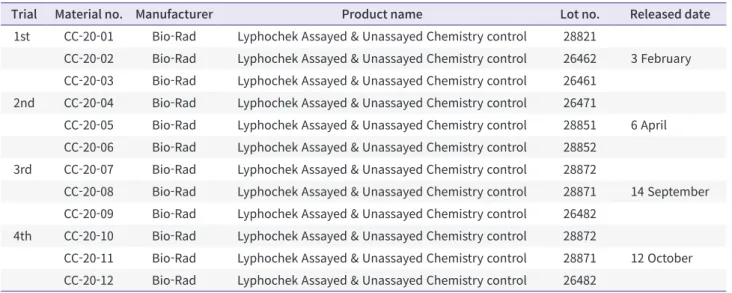
Table 1. Control materials provided for analyses and released dates from the trials of the general chemistry programs in 2020
Trial Material no. Manufacturer Product name Lot no. Released date
1st CC-20-01 Bio-Rad Lyphochek Assayed & Unassayed Chemistry control 28821
CC-20-02 Bio-Rad Lyphochek Assayed & Unassayed Chemistry control 26462 3 February CC-20-03 Bio-Rad Lyphochek Assayed & Unassayed Chemistry control 26461
2nd CC-20-04 Bio-Rad Lyphochek Assayed & Unassayed Chemistry control 26471
CC-20-05 Bio-Rad Lyphochek Assayed & Unassayed Chemistry control 28851 6 April CC-20-06 Bio-Rad Lyphochek Assayed & Unassayed Chemistry control 28852
3rd CC-20-07 Bio-Rad Lyphochek Assayed & Unassayed Chemistry control 28872
CC-20-08 Bio-Rad Lyphochek Assayed & Unassayed Chemistry control 28871 14 September CC-20-09 Bio-Rad Lyphochek Assayed & Unassayed Chemistry control 26482
4th CC-20-10 Bio-Rad Lyphochek Assayed & Unassayed Chemistry control 28872
CC-20-11 Bio-Rad Lyphochek Assayed & Unassayed Chemistry control 28871 12 October CC-20-12 Bio-Rad Lyphochek Assayed & Unassayed Chemistry control 26482
The instrument was from the following company: Bio-Rad Laboratories (Hercules, CA, USA).
Table 2. Control materials provided for analyses and released dates from the trials of urine chemistry programs in 2020
Trial Material no. Manufacturer Product name Lot no. Released date
1st CUC-20-01 Bio-Rad Lyphochek Quantitative Urine Control 63451
CUC-20-02 Bio-Rad Lyphochek Quantitative Urine Control 63452 24 February CUC-20-03 Bio-Rad Lyphochek Quantitative Urine Control 63432
2nd CUC-20-04 Bio-Rad Lyphochek Quantitative Urine Control 63431
CUC-20-05 Bio-Rad Lyphochek Quantitative Urine Control 63461 26 October CUC-20-06 Bio-Rad Lyphochek Quantitative Urine Control 64362
The instrument was from the following company: Bio-Rad Laboratories (Hercules, CA, USA).
로 한 통계결과와 시약 회사를 세 분류로 한 통계결과를 각각 제시 하였다.
제시된 통계결과에는 각 그룹별 참여기관 수, 평균, 표준편차, 변동계수, 중앙값, 최소값과 최대값이 포함되도록 하였고 참여기 관 수, 중앙값, 최소값과 최대값은 이상치를 제거하지 않은 상태에 서 산출된 결과를 제시하였고 평균, 표준편차와 변동계수는 각 군 별로 이상치를 제거한 후 산출된 수치를 나타냈다. 해당 분류에서 이상치를 제거한 후 기관 수가 8개 미만인 경우 평균, 표준편차와
변동계수를 제시하지 않았고 기관 수가 3개 미만인 경우 중앙값 도 제시하지 않았다. 이상치는 각 해당 분류에서 75 퍼센타일 값 (Q3)과 25 퍼센타일 값(Q1)의 차(Q3–Q1, interquartile range, IQR)의 1.5배를 초과하여 Q1보다 낮거나 Q3보다 높은 결과값 (<Q1–1.5×IQR 또는 >Q3+1.5×IQR)으로 설정하였다.
개별보고서는 각 검사항목별로 통계결과를 보여주는 표, 히스 토그램과 레비-제닝스 차트로 구성하였다. 통계치를 제시한 표에 는 각 기관의 결과값과 각 분류별로 분석된 통계결과를 제시하였
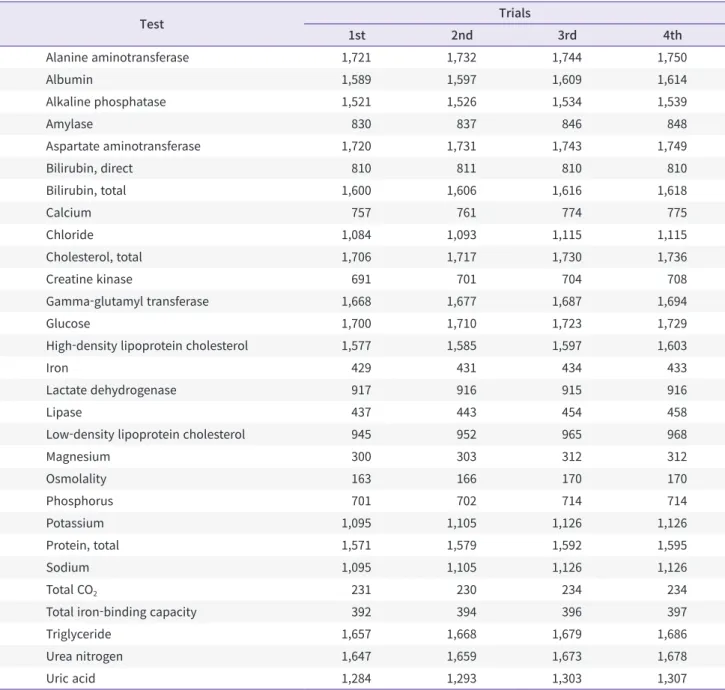
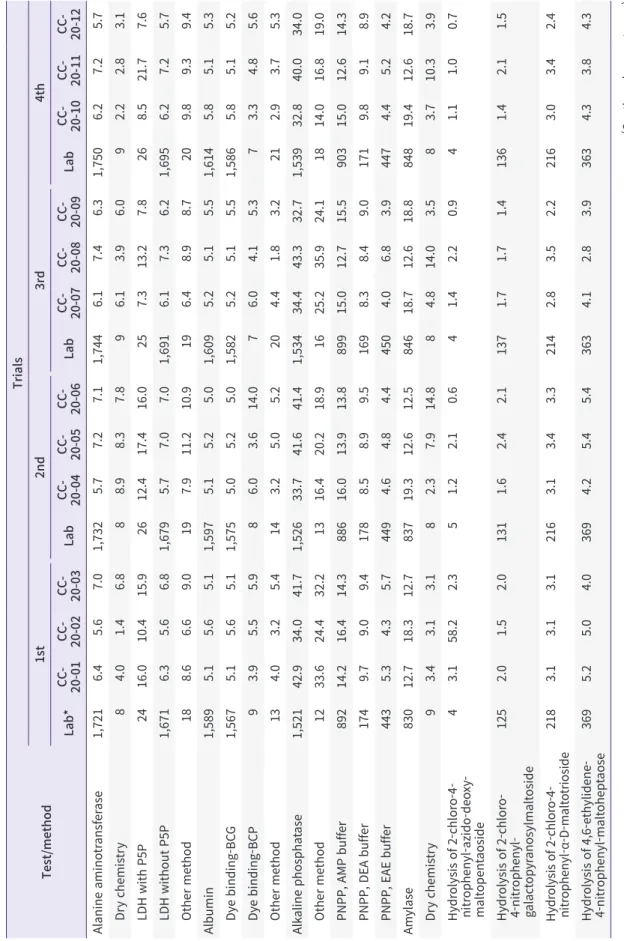
Table 3. Number of laboratories that participated in each test of the general chemistry program in 2020
Test Trials
1st 2nd 3rd 4th
Alanine aminotransferase 1,721 1,732 1,744 1,750
Albumin 1,589 1,597 1,609 1,614
Alkaline phosphatase 1,521 1,526 1,534 1,539
Amylase 830 837 846 848
Aspartate aminotransferase 1,720 1,731 1,743 1,749
Bilirubin, direct 810 811 810 810
Bilirubin, total 1,600 1,606 1,616 1,618
Calcium 757 761 774 775
Chloride 1,084 1,093 1,115 1,115
Cholesterol, total 1,706 1,717 1,730 1,736
Creatine kinase 691 701 704 708
Gamma-glutamyl transferase 1,668 1,677 1,687 1,694
Glucose 1,700 1,710 1,723 1,729
High-density lipoprotein cholesterol 1,577 1,585 1,597 1,603
Iron 429 431 434 433
Lactate dehydrogenase 917 916 915 916
Lipase 437 443 454 458
Low-density lipoprotein cholesterol 945 952 965 968
Magnesium 300 303 312 312
Osmolality 163 166 170 170
Phosphorus 701 702 714 714
Potassium 1,095 1,105 1,126 1,126
Protein, total 1,571 1,579 1,592 1,595
Sodium 1,095 1,105 1,126 1,126
Total CO
2231 230 234 234
Total iron-binding capacity 392 394 396 397
Triglyceride 1,657 1,668 1,679 1,686
Urea nitrogen 1,647 1,659 1,673 1,678
Uric acid 1,284 1,293 1,303 1,307
고 기준분류와 세분류에서는 standard deviation index (SDI)를 함께 제시하였다. 전체 결과에 대해서는 SDI를 제시하지 않았고 각 그룹에서 이상치 제거 후 기관 수가 8개 미만일 경우 SDI를 제 시하지 않았다. 표준편차가 0이지만 기관의 결과값이 평균과 다를 경우에도 SDI를 제시하지 않았다.
히스토그램에서는 전체 기관의 분포와 기준 분류별 분포를 제 시하였고 각 기관의 위치를 표시하였다. 레비-제닝스 차트에는 기 준 분류별 최근 1년간의 SDI를 나타냈다.
결과 및 고찰
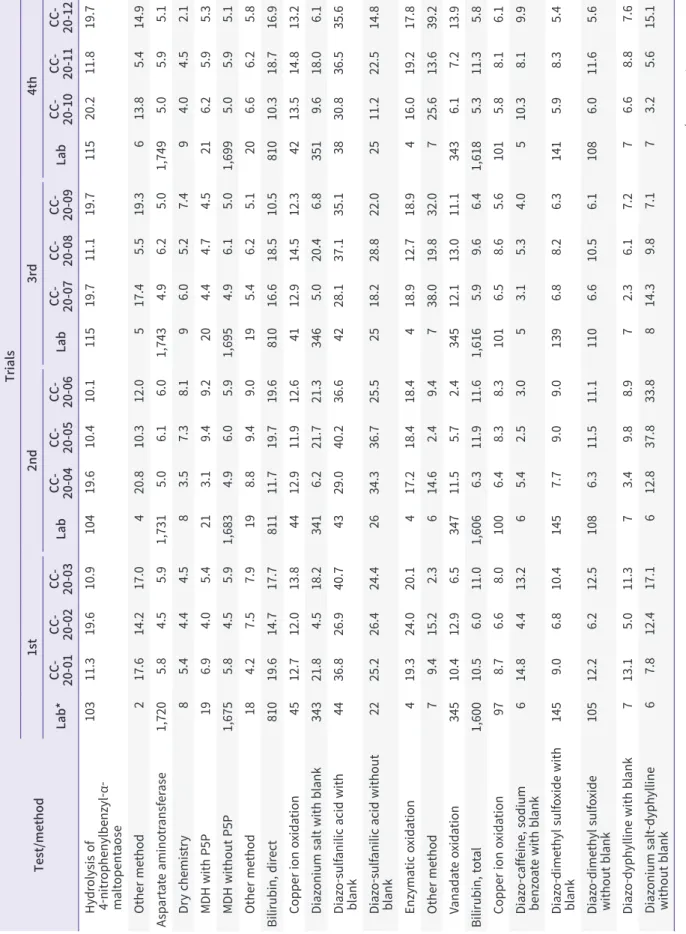
일반화학검사 프로그램에서는 1,000개 이상의 기관이 참여 하는 검사항목은 alanine aminotransferase (ALT), albumin, alkaline phosphatase, aspartate aminotransferase (AST), total bilirubin, chloride, total cholesterol, gamma-glutamyl transferase, glucose, high-density lipoprotein cholesterol, potassium, total protein, sodium, triglyceride, urea nitrogen과 uric acid 등 16개 종목이었고, 회차를 거듭할수록 참 가기관 수가 증가하였다(Table 3). 요화학검사 프로그램에서는 요 human chorionic gonadotropin 정성검사에 참여하는 기관이 가장 많았고 creatinine 검사가 뒤를 이었다(Table 4).
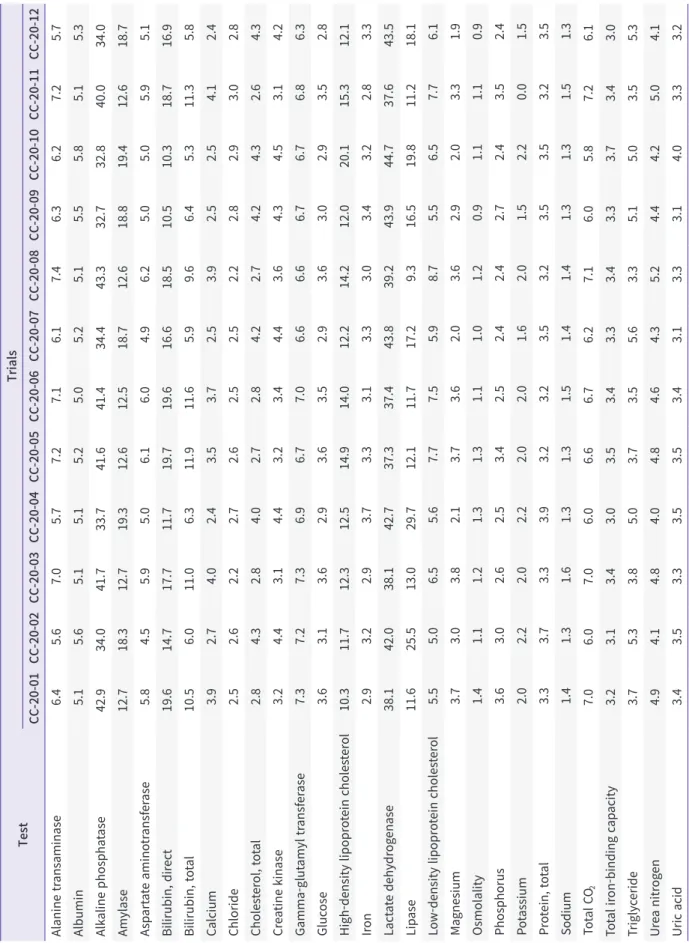
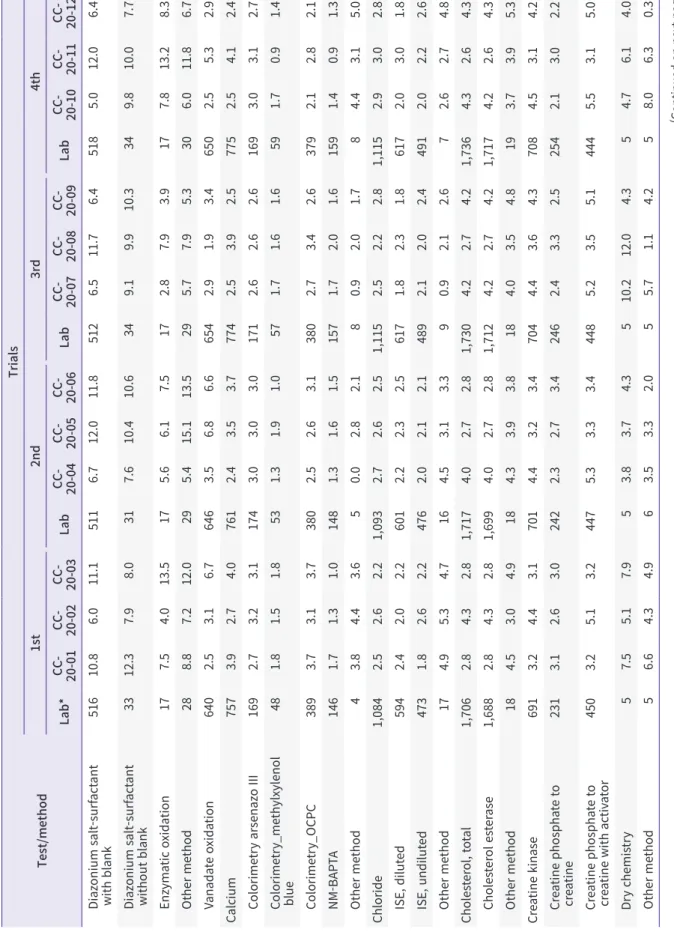
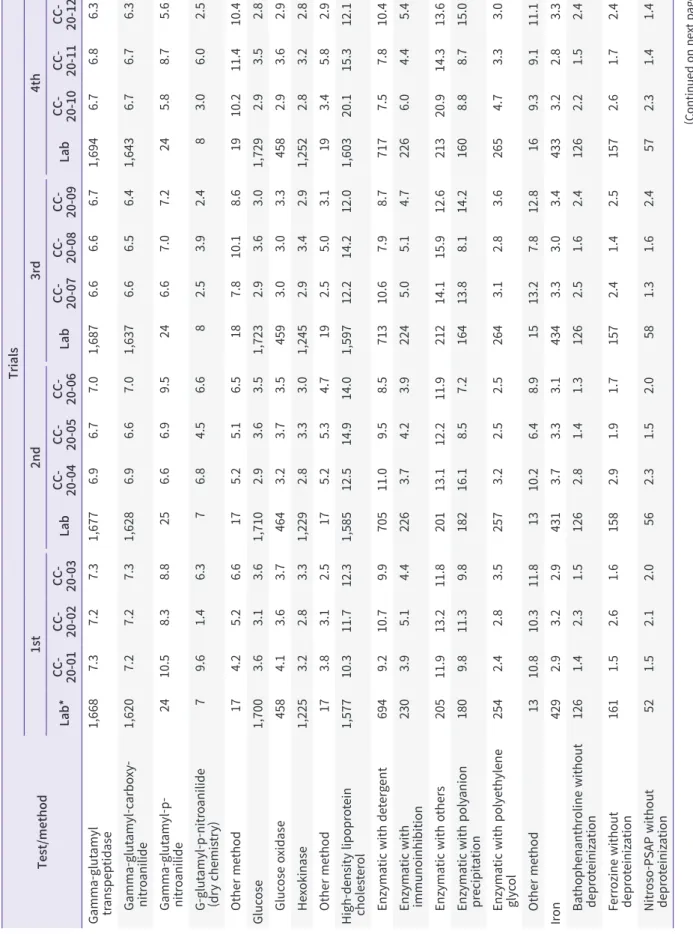
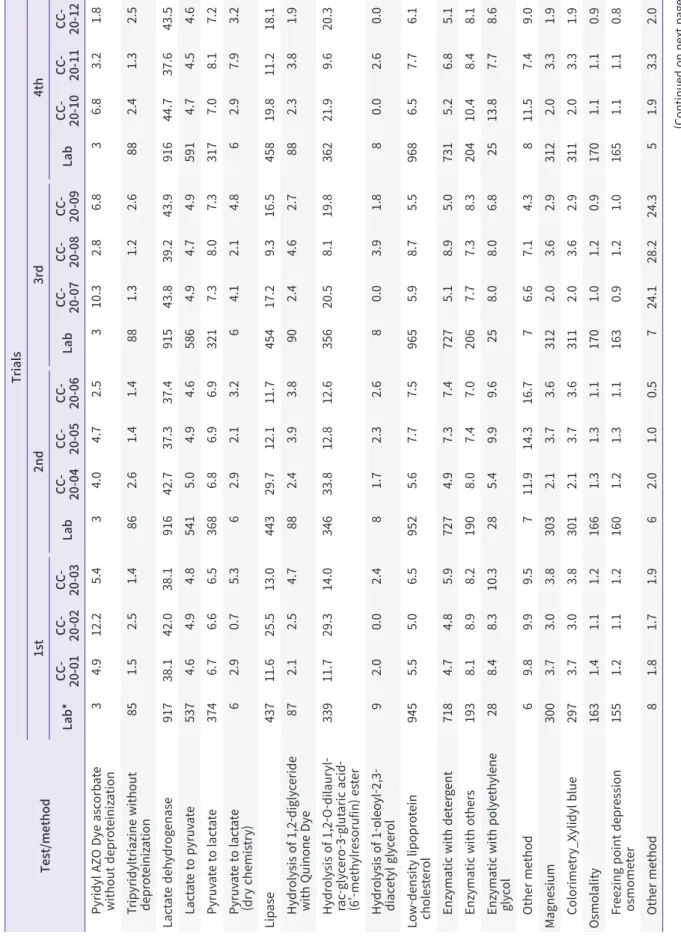
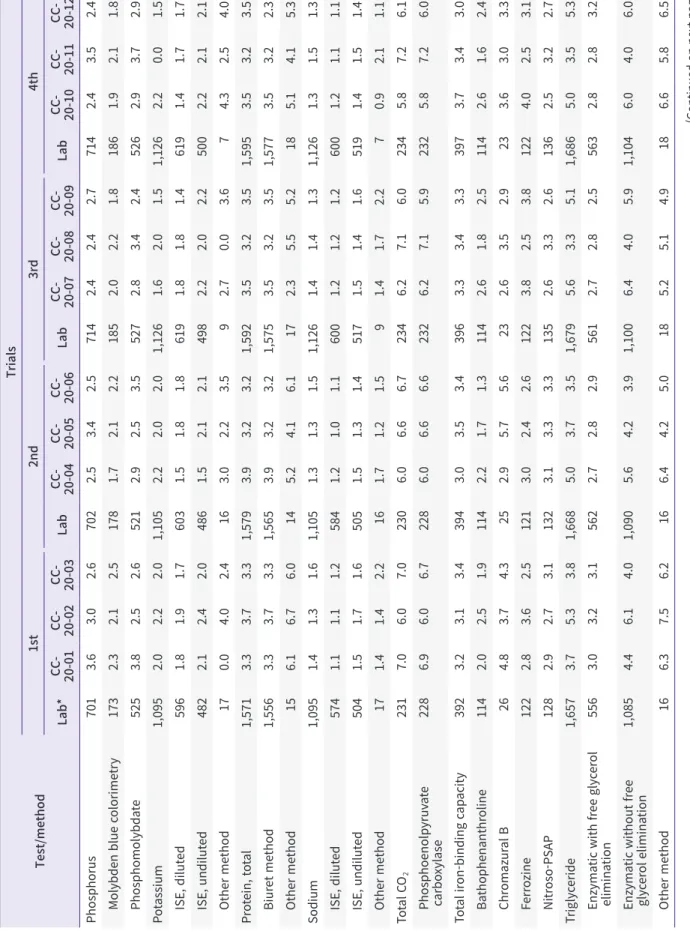
일반화학검사 프로그램에서 변동계수는 각 검사항목별 회 차별로 상대적으로 정도관리물질의 농도가 낮을수록 높은 경 향을 보였다(Table 5). 대부분 10% 이내의 변동계수를 보였지
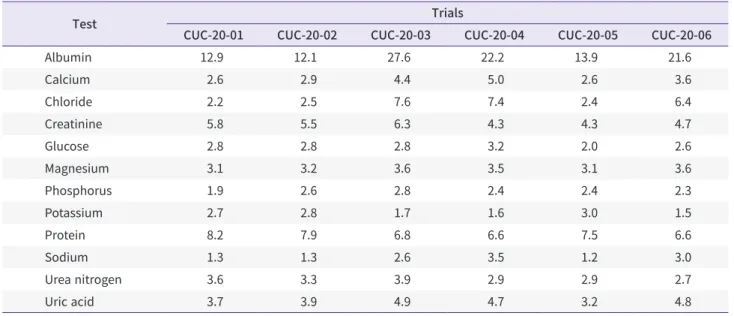
만 alkaline phosphatase, amylase, direct bilirubin, high- density lipoprotein cholesterol, lactate dehydrogenase (LDH)와 lipase는 10% 이상의 높은 변동계수를 보였다. 물론 동 일한 검사법을 사용하는 군에서는 비교적 작은 변동계수를 보였 으나 alkaline phosphatase와 LDH는 검사법 간에 결과의 차이 가 유의하게 큼으로써 변동계수도 상대적으로 큰 것으로 관찰되었 다(Table 5). 요화학검사 프로그램에서 각 검사항목별 변동계수는 대부분 10% 이내의 값을 보였으나 albumin은 12.1%–27.6%로 가장 큰 변동계수를 보였다(Table 6).
변동계수는 각 기관의 상대적 정확도를 나타내는 지표인 SDI 산 출에 영향을 준다. 변동계수가 큰 경우 SDI는 상대적으로 작아질 수 있으므로 결과 해석 시 유의하여야 한다.
한 가지 검사방법이 전체의 80%를 넘는 검사로는, ALT의 LDH without pyridoxal-5-phosphate (P5P)법, albumin의 Dye binding BCG (bromocresol green)법, AST의 malate dehydrogenase without P5P법, total cholesterol의 cholesterol esterase법, gamma-glutamyl transpeptidase 의 gamma-glutamyl-carboxy-nitroanilide법, magnesium 의 colorimetry-xylidyl blue법, osmolality의 freezing point depression osmometer법, total protein의 Biuret법, total CO
2의 phosphoenolpyruvate carboxylase법, urea nitrogen 의 urease with glutamate dehydrogenase법과 uric acid의 uricase법이 있었으며, 예년과 비슷한 경향을 보였다(Table 7).
요화학검사에서 albumin의 측정법으로는 immuno- turbidimetry법이 주로 이용되었고 protein의 측정법으로 dye binding using pyrogallol red법과 turbidimetry using benzethonium chloride법이 이용되었다(Table 8). Sodium, potassium과 chloride 등의 전해질검사에는 대부분의 검사기관 이 희석 이온선택전극법을 이용하였다.
2020년 일반화학검사 프로그램과 요화학검사 프로그램의 신빙 도조사 결과에 대해 보다 자세한 통계분석 결과는 대한임상검사정 도관리협회 신빙도조사사업 홈페이지(http://eqas.keqas.org)에 서 조회가 가능하다.
ORCID
Yong-Wha Lee https://orcid.org/0000-0002-4459-6286 Table 4. Number of laboratories that participated in each test of
the urine chemistry program in 2020
Test Trials
1st 2nd
Albumin 193 192
Calcium 165 165
Chloride 192 195
Creatinine 228 229
Glucose 143 143
Magnesium 112 111
Phosphorus 144 144
Potassium 194 197
Protein 196 197
Sodium 197 199
Urea nitrogen 166 166
Uric acid 153 152
Urine human chorionic gonadotropin (qualitative) 258 260
Table 5. P eer-gr oup c oefficient s of v aria tion (%) ac cor ding t o the t es t and trials of g ener al chemis tr y pr ogr ams in 2020 Test Trials CC-20-01 CC-20-02 CC-20-03 CC-20-04 CC-20-05 CC-20-06 CC-20-07 CC-20-08 CC-20-09 CC-20-10 CC-20-11 CC-20-12 Alanine tr ansaminase 6.4 5.6 7.0 5.7 7.2 7.1 6.1 7.4 6.3 6.2 7.2 5.7 Albumin 5.1 5.6 5.1 5.1 5.2 5.0 5.2 5.1 5.5 5.8 5.1 5.3 Alk aline phospha tase 42.9 34.0 41.7 33.7 41.6 41.4 34.4 43.3 32.7 32.8 40.0 34.0 Amylase 12.7 18.3 12.7 19.3 12.6 12.5 18.7 12.6 18.8 19.4 12.6 18.7 Asp art at e amino tr ansf er ase 5.8 4.5 5.9 5.0 6.1 6.0 4.9 6.2 5.0 5.0 5.9 5.1 Bilirubin, dir ec t 19.6 14.7 17.7 11.7 19.7 19.6 16.6 18.5 10.5 10.3 18.7 16.9 Bilirubin, t ot al 10.5 6.0 11.0 6.3 11.9 11.6 5.9 9.6 6.4 5.3 11.3 5.8 Calcium 3.9 2.7 4.0 2.4 3.5 3.7 2.5 3.9 2.5 2.5 4.1 2.4 Chloride 2.5 2.6 2.2 2.7 2.6 2.5 2.5 2.2 2.8 2.9 3.0 2.8 Choles ter ol, t ot al 2.8 4.3 2.8 4.0 2.7 2.8 4.2 2.7 4.2 4.3 2.6 4.3 Cr ea tine kinase 3.2 4.4 3.1 4.4 3.2 3.4 4.4 3.6 4.3 4.5 3.1 4.2 Gamma-glut amyl tr ansf er ase 7.3 7.2 7.3 6.9 6.7 7.0 6.6 6.6 6.7 6.7 6.8 6.3 Gluc ose 3.6 3.1 3.6 2.9 3.6 3.5 2.9 3.6 3.0 2.9 3.5 2.8 High-density lipopr ot ein choles ter ol 10.3 11.7 12.3 12.5 14.9 14.0 12.2 14.2 12.0 20.1 15.3 12.1 Iron 2.9 3.2 2.9 3.7 3.3 3.1 3.3 3.0 3.4 3.2 2.8 3.3 Lac ta te dehy dr og enase 38.1 42.0 38.1 42.7 37.3 37.4 43.8 39.2 43.9 44.7 37.6 43.5 Lip ase 11.6 25.5 13.0 29.7 12.1 11.7 17.2 9.3 16.5 19.8 11.2 18.1 Lo w-density lipopr ot ein choles ter ol 5.5 5.0 6.5 5.6 7.7 7.5 5.9 8.7 5.5 6.5 7.7 6.1 Magnesium 3.7 3.0 3.8 2.1 3.7 3.6 2.0 3.6 2.9 2.0 3.3 1.9 Osmolality 1.4 1.1 1.2 1.3 1.3 1.1 1.0 1.2 0.9 1.1 1.1 0.9 Phosphorus 3.6 3.0 2.6 2.5 3.4 2.5 2.4 2.4 2.7 2.4 3.5 2.4 Po tassium 2.0 2.2 2.0 2.2 2.0 2.0 1.6 2.0 1.5 2.2 0.0 1.5 Pr ot ein, t ot al 3.3 3.7 3.3 3.9 3.2 3.2 3.5 3.2 3.5 3.5 3.2 3.5 Sodium 1.4 1.3 1.6 1.3 1.3 1.5 1.4 1.4 1.3 1.3 1.5 1.3 To tal C O
27.0 6.0 7.0 6.0 6.6 6.7 6.2 7.1 6.0 5.8 7.2 6.1 To tal ir on-binding c ap acity 3.2 3.1 3.4 3.0 3.5 3.4 3.3 3.4 3.3 3.7 3.4 3.0 Trigly ceride 3.7 5.3 3.8 5.0 3.7 3.5 5.6 3.3 5.1 5.0 3.5 5.3 Ur ea nitr og en 4.9 4.1 4.8 4.0 4.8 4.6 4.3 5.2 4.4 4.2 5.0 4.1 Uric acid 3.4 3.5 3.3 3.5 3.5 3.4 3.1 3.3 3.1 4.0 3.3 3.2
REFERENCES