Annual Report of the Korean Association of
External Quality Assessment Service on General Chemistry (2019)
Yong-Wha Lee
Department of Laboratory Medicine and Genetics, Soonchunhyang University Bucheon Hospital, Soonchunhyang University College of Medicine, Bucheon, Korea
Corresponding author:
Yong-Wha Lee
Department of Laboratory Medicine and Genetics, Soonchunhyang University Bucheon Hospital, Soonchunhyang University College of Medicine, 170 Jomaru-ro, Wonmi-gu, Bucheon 14584, Korea
Tel +82-32-621-5943 Fax +82-32-621-5944 E-mail [email protected]
This is an Open Access article distributed under the terms of the Creative Commons Attribution Non-Commercial License (http://creativecommons.org/licenses/
by-nc/4.0) which permits unrestricted non-commercial use, distribution, and reproduction in any medium, provided the original work is properly cited.
In 2019, the general chemistry proficiency testing program of the Korean Association of External Quality Assessment Service consisted of routine chemistry and urine chemistry programs including 30 and 13 test items, respectively. The test method classification system in the urine chemistry program was revised. The routine chemistry program was conducted four times a year, and the urine chemistry program was conducted twice a year.
Statistical analysis data for the test method and reagent companies were reported based on the information and results of the test items provided by each institution. The statistics included the number of participating institutes, mean, standard deviation, coefficient of variation (CV), median, and the minimum and maximum values for each group. Each report included tables, histograms, Levey–Jennings charts, and the standard deviation index showing the statistics of each test item. In the routine chemistry program, more than 1,000 institutions performed 17 test items, and the number is continuously increasing. Alkaline phosphatase and lactate dehydrogenase were found to have relatively high CVs because of the differences in the results obtained using different test methods; however, the CVs for others were within 10%. In the urine chemistry program, albumin and protein showed relatively high CVs.
(Lab Med Qual Assur 2020;42:97-111)
Key Words Proficiency testing, General chemistry, Korean Association of External Quality Assessment Service
서론
대한임상검사정도관리협회 신빙도조사사업은 2016년부터 차세 대 신빙도조사사업으로 대폭 확장 개편되어 시행되고 있다. 2019 년에는 6개 대분류하에 65개 프로그램 단위별 운영체계로 확대되 었고, 프로그램별 검사종목도 326종목으로 증가하였다[1-3]. 임상 화학 분야는 6개의 대분류 중 하나로서 일반화학검사 등 10개의 중분류 분야로 구성되어 있고, 이들은 일반화학검사와 요화학검사 등 24개의 세부 프로그램으로 나뉜다. 일반화학검사와 요화학검사
프로그램에는 각각 30종과 13종의 검사항목이 포함되어 있다.
2019년 대한임상검사정도관리협회의 신빙도조사사업으로 시 행되었던 일반화학검사와 요화학검사에 대한 신빙도조사사업 결 과를 분석하여 보고하고자 한다.
재료 및 방법
1. 대상
일반화학검사 프로그램은 연 4회에 걸쳐, 회차별로 3개의 정도
관리물질이 이용되어 시행되었다. 물질은 냉장상태가 유지될 수 있도록 아이스팩이 내장된 특수 제작박스에 넣어 참여 등록기관을 대상으로 각 회차별로 2월, 4월, 9월과 10월에 발송되었다. 요화 학검사 프로그램은 연 2회에 걸쳐, 회차별로 3개의 정도관리물질 이 이용되었고 1회차와 2회차를 각각 3월과 10월에 발송하였다.
2. 정도관리물질과 검사항목
일반화학검사의 정도관리물질은 Bio-Rad사(Bio-Rad Laboratories, Hercules, CA, USA)의 사람 혈청을 기질로 한 분 말제품을 사용하였다(Table 1). 요화학검사의 정도관리물질도 Bio-Rad사의 Lyphochek Quantitative Urine Control (Bio- Rad Laboratories)을 사용하였다(Table 2). 사전에 공지된 일정 에 따라 참여기관에서는 수령한 물질에 대한 검사 시행 후 지정된 회신 마감일 이내에 대한임상검사정도관리협회 신빙도조사사업
홈페이지(http://eqas.keqas.org)에 결과를 입력하였다. 기기회 사와 시약회사로부터 제공된 검사항목별 검사방법, 기기와 시약에 대한 데이터베이스가 구축되었고, 이를 토대로 참여기관이 홈페이 지상에서 해당 검사항목에 대한 검사정보 선택과 결과 입력이 가 능하도록 하였다.
3. 결과 판정 및 분석
일반화학검사와 요화학검사 각각에 대해서, 각 기관에서 입력 한 각 검사항목에 대한 정보와 결과를 기반으로 검사방법, 기기, 시약에 따라 통계분석을 시행하였다. 결과보고서는 전체 참여기관 의 특성을 보여주는 공통보고서와 개별기관에 대한 평가결과를 보 여주는 기관별 보고서로 구성되어 있다. 공통보고서에는 전체 참 여기관에 해당하는 통계, 검사방법을 기준분류로 하여 분석한 통 계결과와 시약회사를 세 분류로 하여 분석한 통계결과를 각각 제
Table 1. Control material used for analysis and release dates of the trials of general chemistry in 2019
Trial Material no. Manufacturer Product name Lot no. Released date
1st CC-19-01 Bio-Rad Lyphochek assayed & unassayed chemistry control 28821
CC-19-02 Bio-Rad Lyphochek assayed & unassayed chemistry control 28822 18 February CC-19-03 Bio-Rad Lyphochek assayed & unassayed chemistry control 26451
2nd CC-19-04 Bio-Rad Lyphochek assayed & unassayed chemistry control 28832
CC-19-05 Bio-Rad Lyphochek assayed & unassayed chemistry control 26431 22 April CC-19-06 Bio-Rad Lyphochek assayed & unassayed chemistry control 26432
3rd CC-19-07 Bio-Rad Lyphochek assayed & unassayed chemistry control 26461
CC-19-08 Bio-Rad Lyphochek assayed & unassayed chemistry control 26462 2 September CC-19-09 Bio-Rad Lyphochek assayed & unassayed chemistry control 28812
4th CC-19-10 Bio-Rad Lyphochek assayed & unassayed chemistry control 26452
CC-19-11 Bio-Rad Lyphochek assayed & unassayed chemistry control 28841 14 October CC-19-12 Bio-Rad Lyphochek assayed & unassayed chemistry control 28842
The instrument was from the following company: Bio-Rad Laboratories (Hercules, CA, USA).
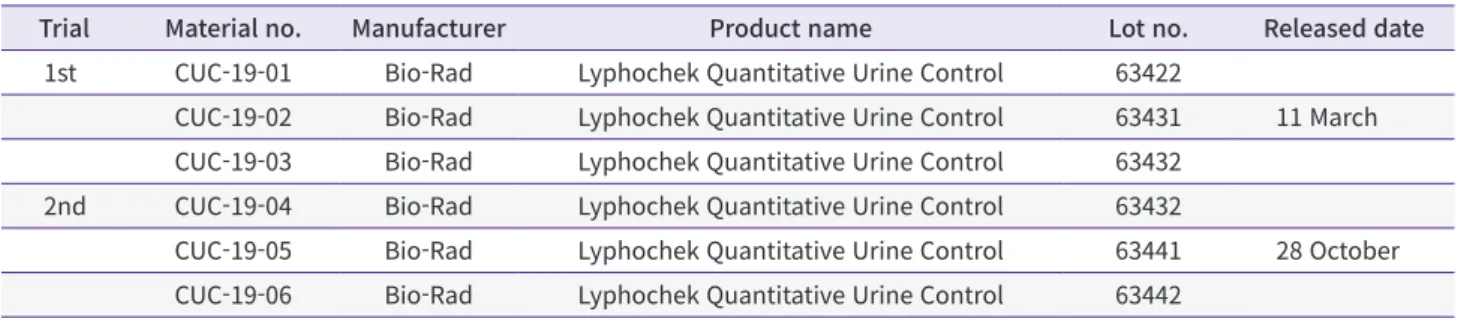
Table 2. Control material used for analysis and release dates of the trials of urine chemistry in 2019
Trial Material no. Manufacturer Product name Lot no. Released date
1st CUC-19-01 Bio-Rad Lyphochek Quantitative Urine Control 63422
CUC-19-02 Bio-Rad Lyphochek Quantitative Urine Control 63431 11 March CUC-19-03 Bio-Rad Lyphochek Quantitative Urine Control 63432
2nd CUC-19-04 Bio-Rad Lyphochek Quantitative Urine Control 63432
CUC-19-05 Bio-Rad Lyphochek Quantitative Urine Control 63441 28 October CUC-19-06 Bio-Rad Lyphochek Quantitative Urine Control 63442
The instrument was from the following company: Bio-Rad Laboratories (Hercules, CA, USA).
시하였다.
제시된 통계결과에는 각 그룹별 참여기관 수, 평균, 표준편차, 변동계수, 중앙값, 최소값과 최대값이 포함되도록 하였고 참여기 관 수, 중앙값, 최소값과 최대값은 이상치를 제거하지 않은 상태 에서 산출된 결과를 제시하였고 평균, 표준편차와 변동계수는 각 군별로 이상치를 제거한 후 산출된 수치를 나타냈다. 해당 분류에 서 이상치를 제거한 후 기관 수가 8개 미만인 경우 평균, 표준편차
와 변동계수를 제시하지 않았고 기관 수가 3개 미만인 경우 중앙 값도 제시하지 않았다. 이상치는 각 해당 분류에서 75퍼센타일 값 (Q3)과 25퍼센타일 값(Q1)의 차(Q3–Q1, interquartile range, IQR)의 1.5배를 초과하여 Q1보다 낮거나 Q3보다 높은 결과값 (<Q1–1.5 IQR 또는 >Q3+1.5 IQR)으로 설정하였다.
개별보고서는 각 검사항목별로 통계결과를 보여주는 표, 히스 토그램과 레비-제닝스 차트로 구성하였다. 통계치를 제시한 표에
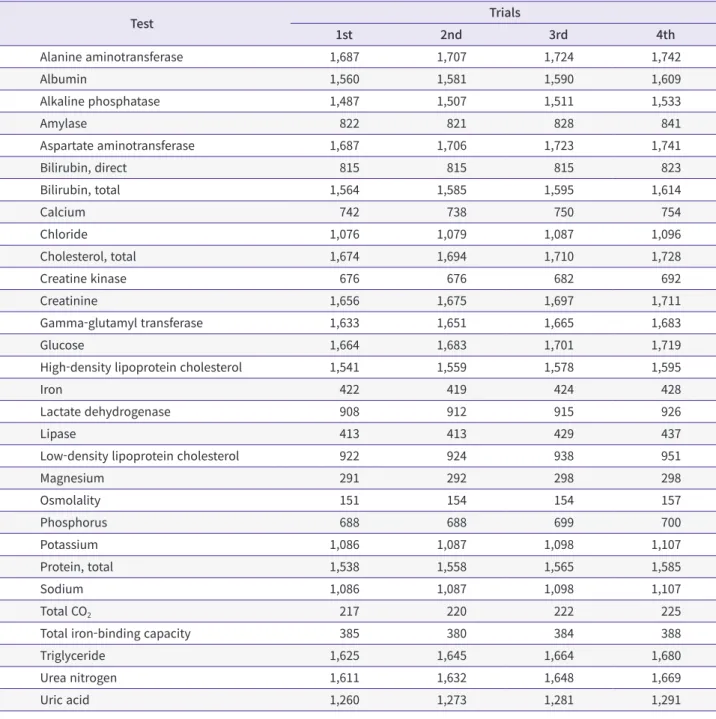
Table 3. Number of laboratories that participated in each test of general chemistry in 2019
Test Trials
1st 2nd 3rd 4th
Alanine aminotransferase 1,687 1,707 1,724 1,742
Albumin 1,560 1,581 1,590 1,609
Alkaline phosphatase 1,487 1,507 1,511 1,533
Amylase 822 821 828 841
Aspartate aminotransferase 1,687 1,706 1,723 1,741
Bilirubin, direct 815 815 815 823
Bilirubin, total 1,564 1,585 1,595 1,614
Calcium 742 738 750 754
Chloride 1,076 1,079 1,087 1,096
Cholesterol, total 1,674 1,694 1,710 1,728
Creatine kinase 676 676 682 692
Creatinine 1,656 1,675 1,697 1,711
Gamma-glutamyl transferase 1,633 1,651 1,665 1,683
Glucose 1,664 1,683 1,701 1,719
High-density lipoprotein cholesterol 1,541 1,559 1,578 1,595
Iron 422 419 424 428
Lactate dehydrogenase 908 912 915 926
Lipase 413 413 429 437
Low-density lipoprotein cholesterol 922 924 938 951
Magnesium 291 292 298 298
Osmolality 151 154 154 157
Phosphorus 688 688 699 700
Potassium 1,086 1,087 1,098 1,107
Protein, total 1,538 1,558 1,565 1,585
Sodium 1,086 1,087 1,098 1,107
Total CO
2217 220 222 225
Total iron-binding capacity 385 380 384 388
Triglyceride 1,625 1,645 1,664 1,680
Urea nitrogen 1,611 1,632 1,648 1,669
Uric acid 1,260 1,273 1,281 1,291
는 각 기관의 결과값과 각 분류별로 분석된 통계결과를 제시하였 고 기준분류와 세분류에서는 standard deviation index (SDI)를 함께 제시하였다. 전체 결과에 대해서는 SDI를 제시하지 않았고 각 그룹에서 이상치 제거 후 기관 수가 8개 미만일 경우 SDI를 제 시하지 않았다. 표준편차가 0이지만 기관의 결과값이 평균과 다를 경우에도 SDI를 제시하지 않았다.
히스토그램에서는 전체 기관의 분포와 기준 분류별 분포를 제 시하였고 각 기관의 위치를 표시하였다. 레비-제닝스 차트는 기준 분류별 SDI를 이용하여 작성하였다.
결과 및 고찰
일반화학검사 프로그램에서는 1,000개 이상의 기관이 참여 하는 검사항목은 alanine aminotransferase (ALT), albumin, alkaline phosphatase, aspartate aminotransferase (AST), total bilirubin, chloride, total cholesterol, creatinine, gamma-glutamyl transferase, glucose, high density lipoprotein cholesterol, potassium, total protein, sodium, triglyceride, urea nitrogen과 uric acid 등이었고, 회차를 거 듭할수록 참가기관 수가 증가하였다(Table 3). 요화학검사 프로 그램에서는 2018년부터 시행되고 있는 요 human chorionic gonadotropin 정성검사에 참여하는 기관이 가장 많았고 creatinine 검사가 뒤를 이었다(Table 4).
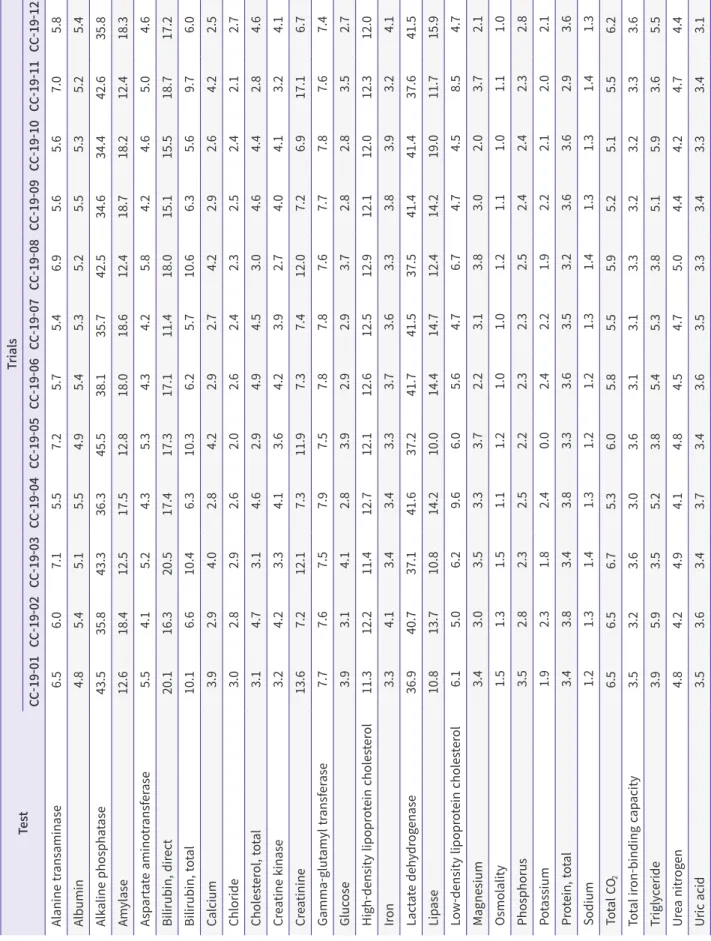
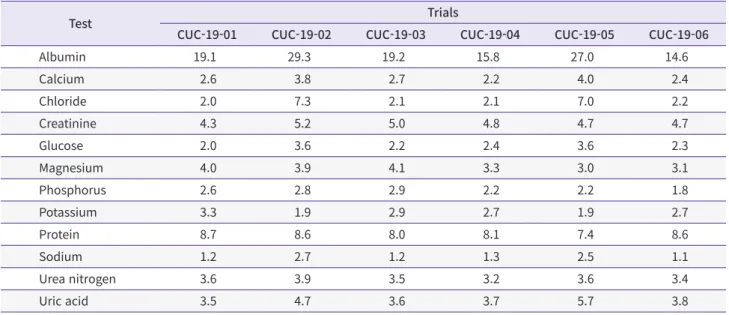
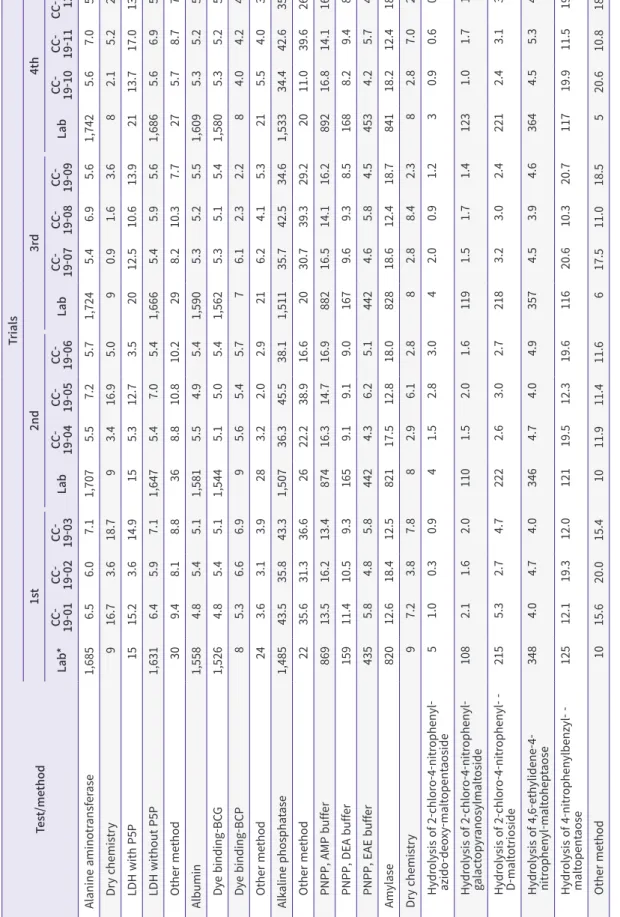
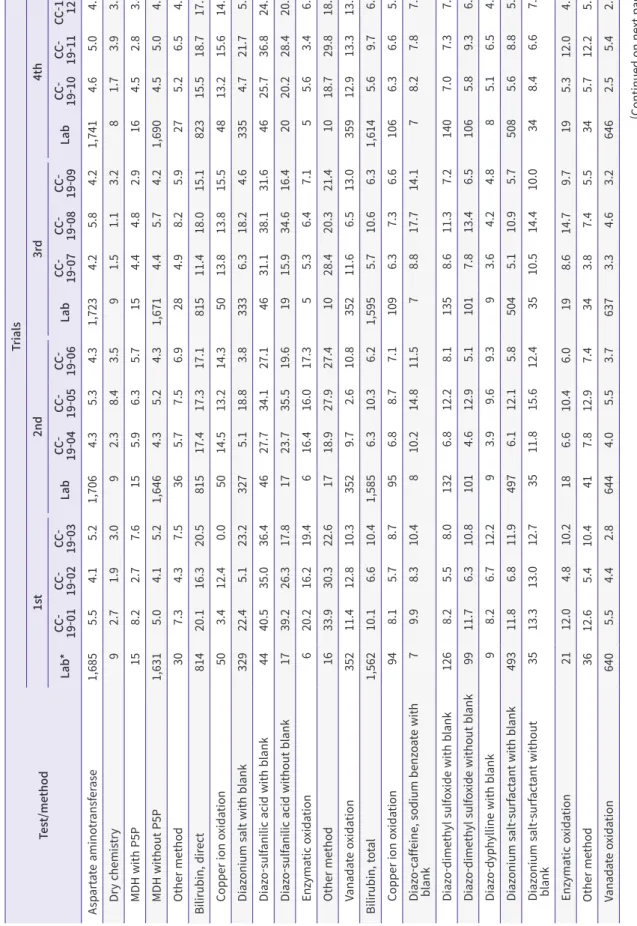
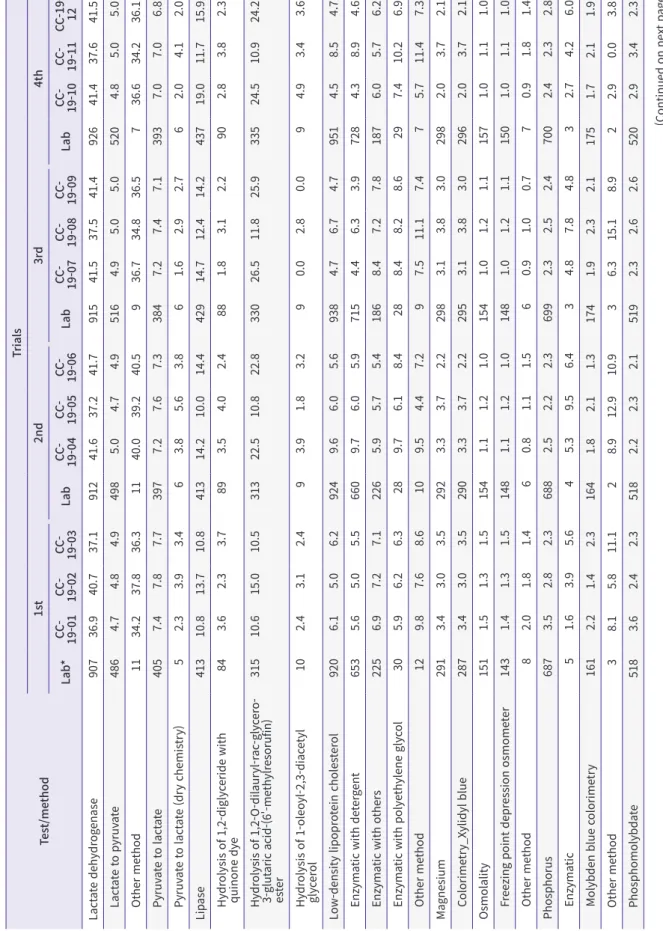
일반화학검사 프로그램에서 변동계수는 각 검사항목별 회 차별로 상대적으로 정도관리물질의 농도가 낮을수록 높은 경 향을 보였다(Table 5). 대부분 10% 이내의 변동계수를 보였지 만 alkaline phosphatase, amylase, direct bilirubin, high density lipoprotein cholesterol, lactate dehydrogenase (LDH)와 lipase는 10% 이상의 높은 변동계수를 보였다. 물론 동 일한 검사법을 사용하는 군에서는 비교적 작은 변동계수를 보였 으나 alkaline phosphatase와 LDH는 검사법 간에 결과의 차이 가 유의하게 큼으로써 변동계수도 상대적으로 큰 것으로 관찰되 었다(Table 5). 요화학검사 프로그램에서 각 검사항목별 변동계수 는 대부분 10% 이내의 값을 보였으나 albumin과 protein은 각 각 14.6%–29.3%와 7.4%–8.7%로 상대적으로 높은 변동계수를 보였다(Table 6). 변동계수는 각 기관의 상대적 위치를 나타내는 SDI와도 관련되므로 변동계수가 큰 경우 SDI는 상대적으로 작아 질 수 있으므로 결과해석 시 유의하여야 한다.
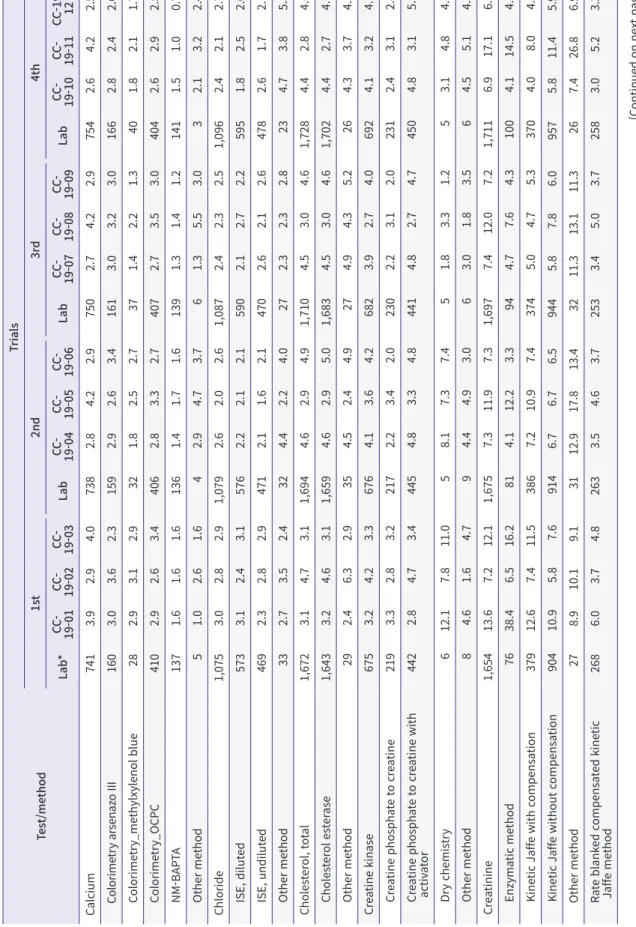
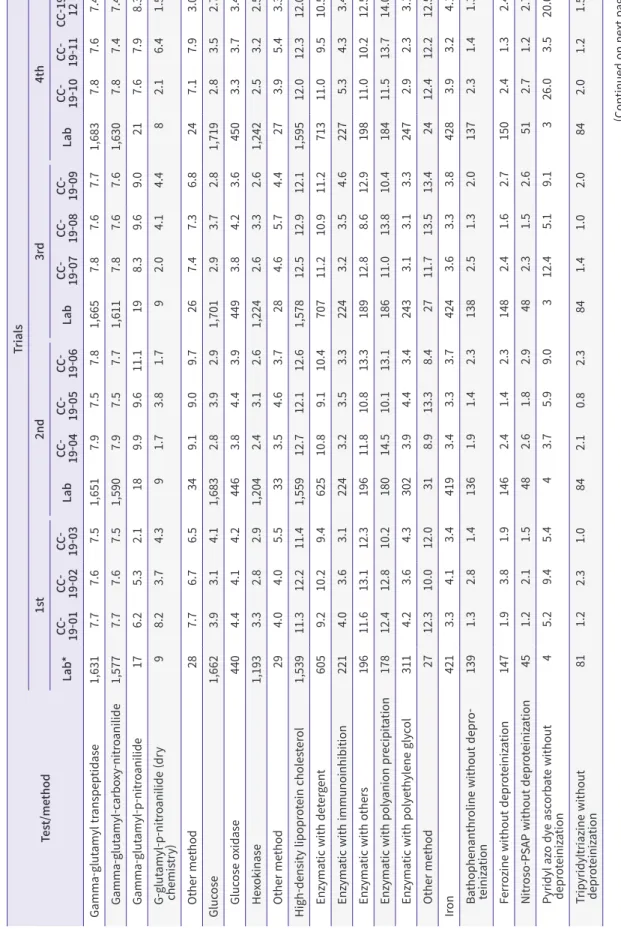
일반화학검사에서 시범종목으로 시행되었던 추정 신사구 체 여과율 검사는 정확도기반 creatinine 검사프로그램으 로 이관되었다. 한 가지 검사방법이 전체의 80%를 넘는 검사 로는, ALT의 LDH without pyridoxal-5-phosphate (P5P) 법, albumin의 dye binding bromocresol green법, AST의 malate dehydrogenase without P5P법, total cholesterol의 cholesterol esterase법, gamma-glutamyl transpeptidase 의 gamma-glutamyl-carboxy-nitroanilide법, magnesium 의 colorimetry-xylidyl blue법, osmolality의 freezing point depression osmometer법, total protein의 Biuret법, total CO
2의 phosphoenolpyruvate carboxylase법, urea nitrogen 의 urease with glutamate dehydrogenase법과 uric acid의 uricase법이 있었으며, 예년과 비슷한 경향을 보였다(Table 7).
요화학검사 프로그램에도 새로운 검사방법 분류체계가 적용되었 다. 일반화학검사와 달리 요화학검사에서 albumin의 측정법으로 는 immunoturbidimetry법이 주로 이용되었고 protein의 측정 법으로 dye binding using pyrogallol red법과 turbidimetry using benzethonium chloride법이 이용되었다(Table 8).
Sodium, potassium과 chloride 등의 전해질검사에는 대부분의 검사기관이 희석 이온선택전극법을 이용하였다.
2019년 일반화학검사 프로그램과 요화학검사 프로그램의 신빙 도조사 결과에 대해 보다 자세한 통계분석 결과는 대한임상검사정 도관리협회 신빙도조사사업 홈페이지(http://eqas.keqas.org)에 서 조회가 가능하다.
Table 4. Number of laboratories that participated in each test of urine chemistry in 2019
Test Trials
1st 2nd
Albumin 183 184
Calcium 161 158
Chloride 188 182
Creatinine 220 218
Glucose 140 138
Magnesium 111 111
Phosphorus 143 141
Potassium 189 183
Protein 190 189
Sodium 191 186
Urea nitrogen 163 161
Uric acid 155 151
Urine human chorionic gonadotropin
(qualitative) 241 242
Table 5. P eer-gr oup c oefficient s of v aria tion (%) ac cor ding t o the t es t and trials of g ener al chemis tr y in 2019 Te st Trials CC-19-01 CC-19-02 CC-19-03 CC-19-04 CC-19-05 CC-19-06 CC-19-07 CC-19-08 CC-19-09 CC-19-10 CC-19-11 CC-19-12 Alanine tr ansaminase 6.5 6.0 7.1 5.5 7.2 5.7 5.4 6.9 5.6 5.6 7.0 5.8 Albumin 4.8 5.4 5.1 5.5 4.9 5.4 5.3 5.2 5.5 5.3 5.2 5.4 Alk aline phospha tase 43.5 35.8 43.3 36.3 45.5 38.1 35.7 42.5 34.6 34.4 42.6 35.8 Amylase 12.6 18.4 12.5 17.5 12.8 18.0 18.6 12.4 18.7 18.2 12.4 18.3 Asp art at e amino tr ansf er ase 5.5 4.1 5.2 4.3 5.3 4.3 4.2 5.8 4.2 4.6 5.0 4.6 Bilirubin, dir ec t 20.1 16.3 20.5 17.4 17.3 17.1 11.4 18.0 15.1 15.5 18.7 17.2 Bilirubin, t ot al 10.1 6.6 10.4 6.3 10.3 6.2 5.7 10.6 6.3 5.6 9.7 6.0 Calcium 3.9 2.9 4.0 2.8 4.2 2.9 2.7 4.2 2.9 2.6 4.2 2.5 Chloride 3.0 2.8 2.9 2.6 2.0 2.6 2.4 2.3 2.5 2.4 2.1 2.7 Choles ter ol, t ot al 3.1 4.7 3.1 4.6 2.9 4.9 4.5 3.0 4.6 4.4 2.8 4.6 Cr ea tine kinase 3.2 4.2 3.3 4.1 3.6 4.2 3.9 2.7 4.0 4.1 3.2 4.1 Cr ea tinine 13.6 7.2 12.1 7.3 11.9 7.3 7.4 12.0 7.2 6.9 17.1 6.7 Gamma-glut amyl tr ansf er ase 7.7 7.6 7.5 7.9 7.5 7.8 7.8 7.6 7.7 7.8 7.6 7.4 Gluc ose 3.9 3.1 4.1 2.8 3.9 2.9 2.9 3.7 2.8 2.8 3.5 2.7 High-density lipopr ot ein choles ter ol 11.3 12.2 11.4 12.7 12.1 12.6 12.5 12.9 12.1 12.0 12.3 12.0 Iron 3.3 4.1 3.4 3.4 3.3 3.7 3.6 3.3 3.8 3.9 3.2 4.1 Lac ta te dehy dr og enase 36.9 40.7 37.1 41.6 37.2 41.7 41.5 37.5 41.4 41.4 37.6 41.5 Lip ase 10.8 13.7 10.8 14.2 10.0 14.4 14.7 12.4 14.2 19.0 11.7 15.9 Lo w-density lipopr ot ein choles ter ol 6.1 5.0 6.2 9.6 6.0 5.6 4.7 6.7 4.7 4.5 8.5 4.7 Magnesium 3.4 3.0 3.5 3.3 3.7 2.2 3.1 3.8 3.0 2.0 3.7 2.1 Osmolality 1.5 1.3 1.5 1.1 1.2 1.0 1.0 1.2 1.1 1.0 1.1 1.0 Phosphorus 3.5 2.8 2.3 2.5 2.2 2.3 2.3 2.5 2.4 2.4 2.3 2.8 Po tassium 1.9 2.3 1.8 2.4 0.0 2.4 2.2 1.9 2.2 2.1 2.0 2.1 Pr ot ein, t ot al 3.4 3.8 3.4 3.8 3.3 3.6 3.5 3.2 3.6 3.6 2.9 3.6 Sodium 1.2 1.3 1.4 1.3 1.2 1.2 1.3 1.4 1.3 1.3 1.4 1.3 To tal C O
26.5 6.5 6.7 5.3 6.0 5.8 5.5 5.9 5.2 5.1 5.5 6.2 To tal ir on-binding c ap acity 3.5 3.2 3.6 3.0 3.6 3.1 3.1 3.3 3.2 3.2 3.3 3.6 Trigly ceride 3.9 5.9 3.5 5.2 3.8 5.4 5.3 3.8 5.1 5.9 3.6 5.5 Ur ea nitr og en 4.8 4.2 4.9 4.1 4.8 4.5 4.7 5.0 4.4 4.2 4.7 4.4 Uric acid 3.5 3.6 3.4 3.7 3.4 3.6 3.5 3.3 3.4 3.3 3.4 3.1
REFERENCES