서론
대한임상검사정도관리협회에서는 1977년에 38개 임상검사 실을 대상으로 신빙도조사사업을 시작한 이래 3년여간의 준 비기간을 거쳐 2016년부터 새로운 운영방식의 차세대 신빙 도조사사업을 시행하였다. 가장 큰 변화는 2016년을 기점으
로 기존의 분과 중심의 운영체계에서 6개 대분류하에 46개 프 로그램 단위별 운영체계로 전환하여 검사항목을 확대한 점이 다. 임상화학 분야는 일반화학검사 프로그램을 비롯한 21개 의 프로그램으로 구성되었고 이 중에는 임상화학분과위원회 에서 담당해 왔던 일반화학검사 분야, 당화혈색소, 지질 및 크 레아티닌에 대한 정확도 기반 신빙도조사사업이 포함되어 있
Annual Report on the External Quality Assessment Scheme for Routine Clinical Chemistry in Korea (2016)
Yong-Wha Lee
1, Byung- Ryul Jeon
1, Jeong Gwon Kim
1, Sun Hee Jun
2, Yeo- Min Yun
3, Sail Chun
4, Junghan Song
2, and Won-Ki Min
4, for Routine Clinical Chemistry Program, Korean Association of External Quality Assessment Service
1
Department of Laboratory Medicine and Genetics, Soonchunhyang University Bucheon Hospital, Soonchunhyang University College of Medicine, Bucheon;
2
Department of Laboratory Medicine, Seoul National University Bundang Hospital, Seoul National University College of Medicine, Seongnam;
3
Department of Laboratory Medicine, Konkuk University Medical Center, Konkuk University School of Medicine;
4
Department of Laboratory Medicine, Asan Medical Center, University of Ulsan College of Medicine, Seoul, Korea
In 2016, the clinical chemistry proficiency-testing program consisted of 21 programs, including the general chemistry program of the Korean Association of External Quality Assessment Service. The general chemistry program consisted of 28 test items and was conducted using two level control materials four times per year. Based on the information and results for each test item entered by each institution, statistical analysis data according to test method, instrument, and reagent were reported. The report comprised a general statistics report showing the characteristics of all participating institutions and a separate institutional report showing the evaluation data of individual institutions. The statistics included the number of participating institutions and the mean, standard deviation, coefficient of variation, median, minimum, and maximum values for each group. Each report was composed of a table, histogram, and Levey-Jennings chart showing the statistics for each test item. The results of each institution and the statistics for each classification are presented in the table showing the statistics, and a standard deviation index is presented together with a method classification and a classification by reagent companies. A total of 14 items, including albumin, were evaluated by more than 1,000 institutions. There was no significant difference in the distribution of the measurement methods compared with those used in the previous year. The coefficient of variation showed a tendency to increase as the concentration of the level control material decreased and as the number of participating institutions decreased for each test item. Most of them showed a coefficient of variation within 10%. These statistical data will be useful when interpreting the survey results from the institutions and selecting a test method.
(J Lab Med Qual Assur 2017;39:61-75)
Key Words: Proficiency testing, Clinical chemistry, Korean Association of External Quality Assessment Service
Corresponding author:
Yong-Wha Lee
Department of Laboratory Medicine and Genetics, Soonchunhyang University Bucheon Hospital, Soonchunhyang University College of Medicine, 170 Jomaru- ro, Wonmi-gu, Bucheon 14584, Korea
Tel: +82-32-621-5943
Fax: +82-32-621-5944
E-mail: [email protected]
pISSN: 2384-2458
eISSN: 2288-7261
다[1-3]. 일반화학검사 프로그램에서 시행되는 검사항목은 기 존에 시행해오던 항목을 포함하여 direct bilirubin, iron, total iron binding capacity, amylase, lipase, creatine kinase와 magnesium 등 28개로 확대되었고, 혈액가스검사 분야는 혈 액가스검사 프로그램으로 분리되었다.
저자들은 2016년 차세대 신빙도조사사업으로 실시되었던 일반화학검사에 대한 신빙도조사사업 결과를 분석하여 보고 하고자 한다.
재료 및 방법
1. 대상
일반화학검사 프로그램은 연 4회에 걸쳐 회차별로 3개의 정 도관리물질이 이용되어 시행되었다. 물질은 냉장상태가 유지 될 수 있도록 아이스팩이 내장된 특수 제작박스에 넣어 참여 등록기관을 대상으로 1회차는 4월 26일, 2회차는 6월 27일에 발송되었고 3회차와 4회차는 8월 29일에 발송되었다.
2. 정도관리물질과 검사항목
정도관리물질은 Bio-Rad사의 Lyphochek Assayed &
Unassayed Chemistry control (Bio-Rad Laboratories, Hercules, CA, USA) 등 사람 혈청을 기질로 한 분말제품을 사용하였다(Table 1). 검사항목은 전해질, 단백, 지질과 효소 등 총 28항목이었다. 사전에 공지된 일정에 따라 물질을 수령 한 참여기관에서는 검사 시행 후 지정된 회신 마감일 이내에 대한임상검사정도관리협회 신빙도조사사업 홈페이지(http://
eqas.keqas.org)에 결과를 입력하도록 하였다. 협회에서는 기
기회사와 시약회사로부터 제공된 검사항목별 검사방법, 기기 와 시약에 대해 기초자료를 검토한 바를 토대로 참여기관이 홈 페이지상에서 해당 검사항목에 대한 검사정보의 선택과 결과 의 입력이 가능하도록 전산체계를 구축하였다.
3. 결과 판정 및 분석
각 기관에서 입력한 각 검사항목에 대한 정보와 결과를 기반 으로 검사방법, 기기, 시약에 따라 통계분석을 시행하였고 이 를 전체 참여기관의 특성을 보여주는 공통보고서와 개별기관 의 평가자료를 보여주는 기관별 보고서로 나누어 보고하였다.
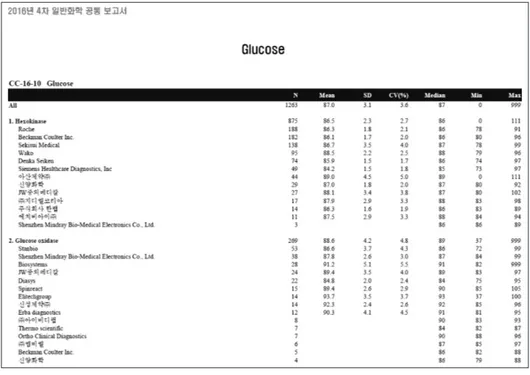
공통보고서는 3단계로 그룹화하여 통계치를 제시하였다(Fig.
1). 전체 참여기관에 해당하는 통계, 검사방법을 기준분류로 한 그룹의 통계와 검사방법별로 시약회사를 세 분류한 그룹의 통계를 각각 제시하였다.
제시된 통계에는 각 그룹별 참여기관 수, 평균, 표준편차, 변동계수, 중앙값, 최소값과 최대값이 포함되도록 하였고 참 여기관 수, 중앙값, 최소값과 최대값은 이상치를 제거하지 않 은 수치를 제시하였고 평균, 표준편차와 변동계수는 각 그룹 별로 이상치를 제거한 후 산출된 수치를 사용하였다. 또한 해 당 분류에 속한 기관 수가 10개 미만인 경우 평균, 표준편차와 변동계수를 제시하지 않았고 기관 수가 3개 미만인 경우 중앙 값도 제시하지 않았다. 이상치는 각 해당 분류에서 75퍼센타 일 값(Q3)과 25퍼센타일 값(Q1)의 차(Q3-Q1; interquartile range, IQR)의 1.5배를 초과하여 Q1보다 낮거나 Q3보다 높 은 결과값( <Q1-1.5×IQR 또는 >Q3+1.5×IQR)으로 설정하 였다.
개별보고서는 각 검사항목별로 통계치를 보여주는 표, 히스
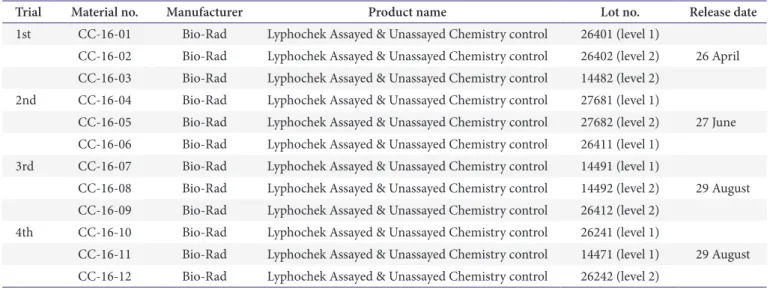
Table 1. Control material provided for analysis and release dates from the trials in 2016
Trial Material no. Manufacturer Product name Lot no. Release date
1st CC-16-01 Bio-Rad Lyphochek Assayed & Unassayed Chemistry control 26401 (level 1)
CC-16-02 Bio-Rad Lyphochek Assayed & Unassayed Chemistry control 26402 (level 2) 26 April CC-16-03 Bio-Rad Lyphochek Assayed & Unassayed Chemistry control 14482 (level 2)
2nd CC-16-04 Bio-Rad Lyphochek Assayed & Unassayed Chemistry control 27681 (level 1)
CC-16-05 Bio-Rad Lyphochek Assayed & Unassayed Chemistry control 27682 (level 2) 27 June CC-16-06 Bio-Rad Lyphochek Assayed & Unassayed Chemistry control 26411 (level 1)
3rd CC-16-07 Bio-Rad Lyphochek Assayed & Unassayed Chemistry control 14491 (level 1)
CC-16-08 Bio-Rad Lyphochek Assayed & Unassayed Chemistry control 14492 (level 2) 29 August CC-16-09 Bio-Rad Lyphochek Assayed & Unassayed Chemistry control 26412 (level 2)
4th CC-16-10 Bio-Rad Lyphochek Assayed & Unassayed Chemistry control 26241 (level 1)
CC-16-11 Bio-Rad Lyphochek Assayed & Unassayed Chemistry control 14471 (level 1) 29 August CC-16-12 Bio-Rad Lyphochek Assayed & Unassayed Chemistry control 26242 (level 2)
The following instrument was used: Bio-Rad Laboratories (Hercules, CA, USA).
토그램과 레비-제닝스 차트로 구성되도록 하였다(Fig. 2). 통 계치를 제시한 표에는 각 기관의 결과값과 각 분류별 통계치 를 제시하고 기준분류와 세 분류에서는 standard deviation index (SDI)를 함께 제시하였다. 전체 결과에 대해서는 SDI를 제시하지 않았고 각 그룹에서 참가기관의 수가 10개 미만일
경우 SDI를 제시하지 않았다.
히스토그램에서는 전체 기관의 분포와 기준분류별 분포를 제시하였고 각 기관의 위치를 표시하였다. 히스토그램은 20개 의 막대로 구성하였고 첫 번째와 마지막 막대는 각각 전체 참 여기관의 결과분포에서 2.5퍼센타일 미만과 97.5퍼센타일 이 Fig. 1. Example of a general statistics report for the clinical chemistry pro- ficiency-testing program of the Korean External Quality Assessment Service 2016.
Fig. 2. Example of a separate institu-
tional report for the clinical chemistry
proficiency-testing program of the
Korean External Quality Assessment
Service 2016.
상에 해당하며 중간 막대들은 2.5퍼센타일 값과 97.5퍼센타일 값의 범위를 동일한 간격으로 나누어 분포를 나타내었다. 레 비-제닝스 차트는 기준분류별 SDI를 이용하여 작성하였다.
결과 및 고찰
2016년 4회에 걸쳐 시행된 외부정도관리 분석결과는 회차 마다 추가 가입 여부에 따라 참여기관 수와 회신율이 달랐기에 매 회차마다 회신된 기관을 대상으로 통계분석이 되었다. 정도 관리물질은 회차마다 각각 서로 다른 로트번호를 갖는 물질을 이용하였고 회차별로 높은 농도와 낮은 농도가 다양한 순서로 섞이도록 하였다.
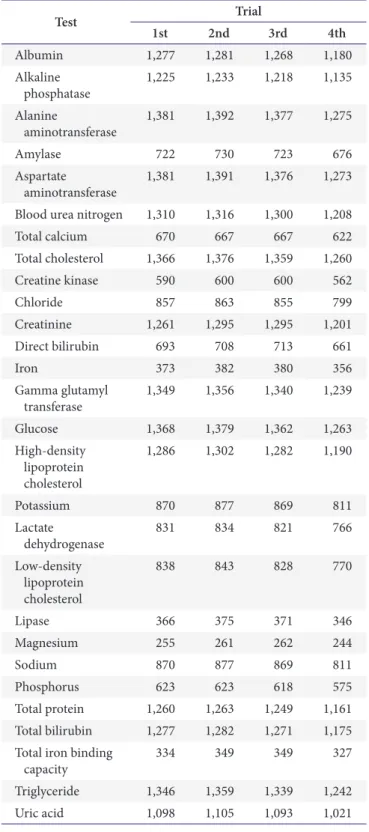
1,000개 이상의 기관이 참여하는 검사항목은 albumin, alkaline phosphatase, alanine aminotransferase (ALT), aspartate aminotransferase (AST), blood urea nitrogen (BUN), total cholesterol, creatinine, gamma-glutamyl transferase glucose, high-density lipoprotein (HDL) cholesterol, total protein, total bilirubin, triglyceride와 uric acid 등이었다(Table 2).
측정법 분포에 있어서는 전체적으로 전년도와 큰 차이 는 없고, 한 가지 검사방법이 전체의 80%를 넘는 검사로 는, albumin의 dye binding BCG (bromocresol green)법, ALT와 AST의 UV (ultra violet) without P5P (pyridoxal- 5-phosphate)법, BUN의 urease with glutamate dehydrogenase법, total cholesterol의 효소측정법, sodium, potassium과 chloride 등의 전해질의 ion selective electrode 법, magnesium의 비색법(dye-xylidyl blue/Magon), phosphorus의 phosphomolybdate법, total protein의 biuret 법과 uric acid의 uricase법이 있었다.
Low-density lipoprotein cholesterol과 HDL cholesterol 등의 지질검사는 시약제조사명을 인용하여 검사방법이 분 류되었고 기관별로 다양한 검사방법이 이용되고 있었다.
Direct bilirubin과 total bilirubin검사에는 diazonium salt/
diazonium ion with blank법 또는 vanadate oxidation법이 주로 이용되었으나 그 외 다양한 방법들이 분포되어 있었다.
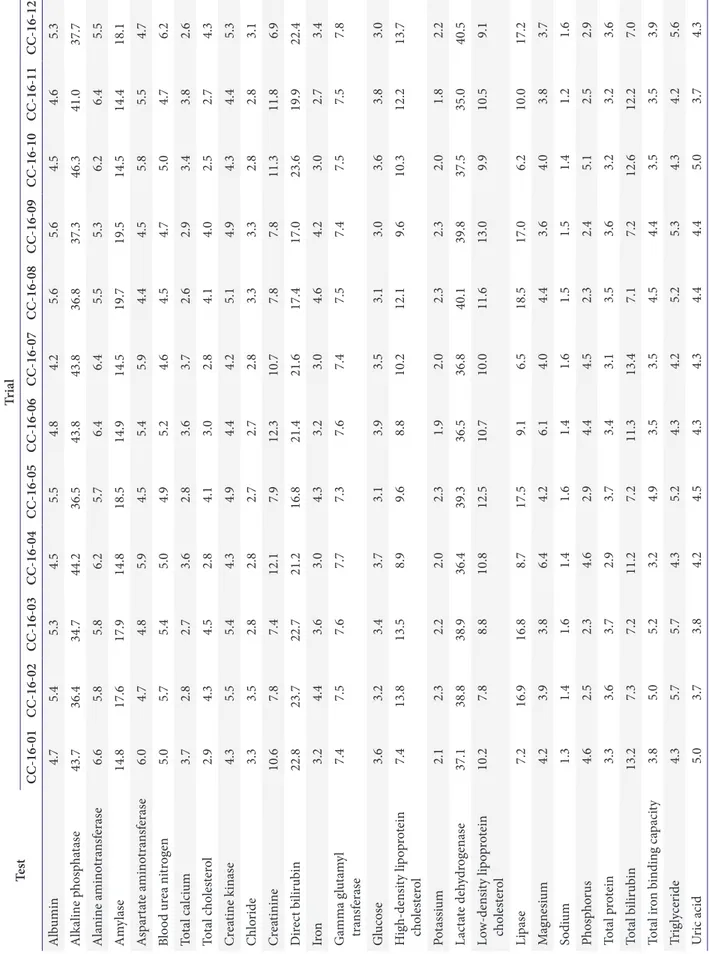
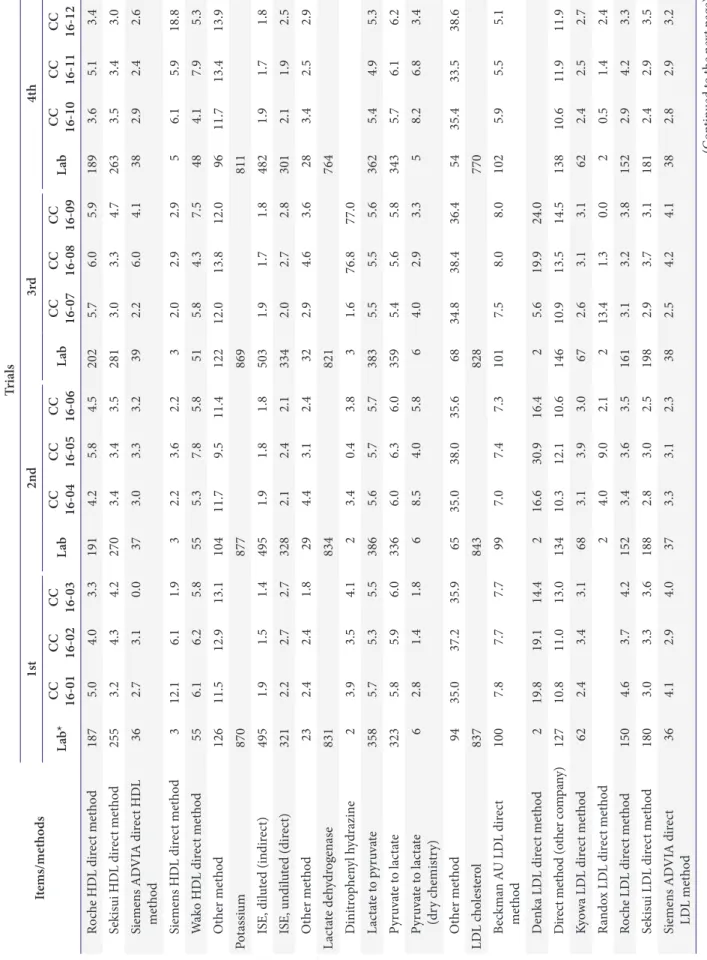
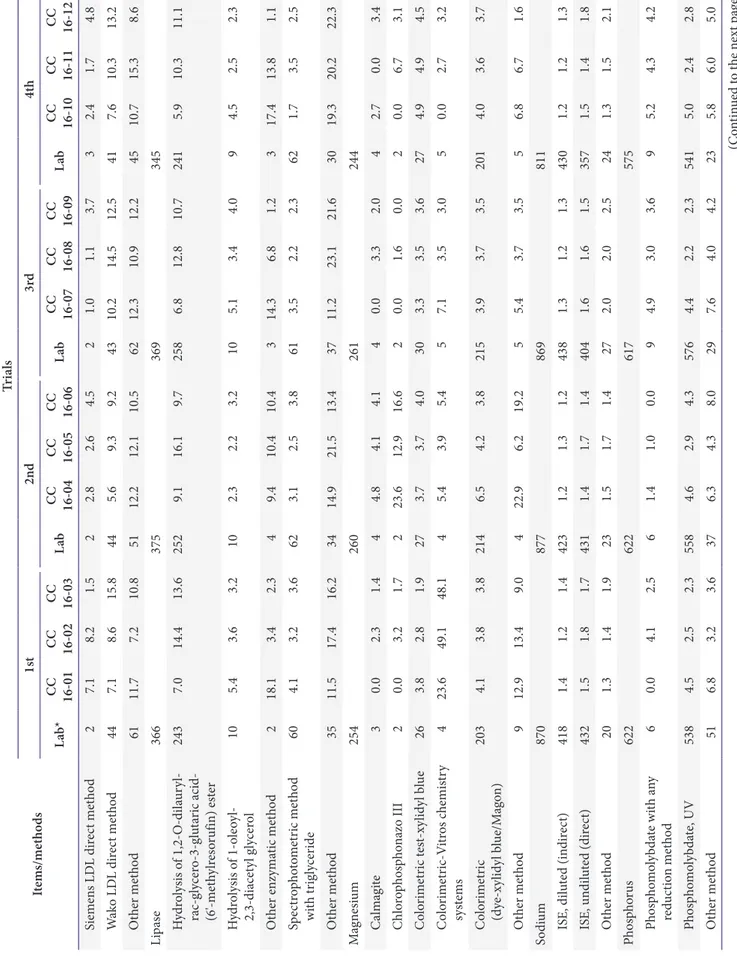
변이계수는 각 검사항목별 회차별로 상대적으로 정도관 리물질의 농도가 낮고 참여기관의 수가 적을수록 높은 경향 을 보였다(Table 3). 대부분 10% 이내의 변이계수를 보였지 만 alkaline phosphatase, lactate dehydrogenase, direct bilirubin과 total bilirubin 등의 일부 방법에서 10% 이상 의 높은 변이계수를 보였다. 물론 동일한 검사법을 사용하 는 그룹 내에서는 비교적 작은 변이계수를 보였으나 alkaline
phosphatase와 lactate dehydrogenase는 검사법 간에 결과 의 차이가 유의하게 큼으로써 변이계수도 상대적으로 매우 큰 것으로 관찰되었다(Table 4). 변이계수는 각각 기관의 상대
Table 2. Number of laboratories that participated in each test in 2016
Test Trial
1st 2nd 3rd 4th
Albumin 1,277 1,281 1,268 1,180
Alkaline
phosphatase 1,225 1,233 1,218 1,135 Alanine
aminotransferase 1,381 1,392 1,377 1,275
Amylase 722 730 723 676
Aspartate
aminotransferase 1,381 1,391 1,376 1,273 Blood urea nitrogen 1,310 1,316 1,300 1,208
Total calcium 670 667 667 622
Total cholesterol 1,366 1,376 1,359 1,260
Creatine kinase 590 600 600 562
Chloride 857 863 855 799
Creatinine 1,261 1,295 1,295 1,201
Direct bilirubin 693 708 713 661
Iron 373 382 380 356
Gamma glutamyl
transferase 1,349 1,356 1,340 1,239
Glucose 1,368 1,379 1,362 1,263
High-density lipoprotein cholesterol
1,286 1,302 1,282 1,190
Potassium 870 877 869 811
Lactate
dehydrogenase 831 834 821 766
Low-density lipoprotein cholesterol
838 843 828 770
Lipase 366 375 371 346
Magnesium 255 261 262 244
Sodium 870 877 869 811
Phosphorus 623 623 618 575
Total protein 1,260 1,263 1,249 1,161 Total bilirubin 1,277 1,282 1,271 1,175 Total iron binding
capacity 334 349 349 327
Triglyceride 1,346 1,359 1,339 1,242
Uric acid 1,098 1,105 1,093 1,021
Ta bl e 3. P eer -g ro up co ef ficien ts o f va ria tio n (%) acco rdin g t o t he t es ts a nd t ria ls in 2016 Te st Tr ia l CC-16-01 CC-16-02 CC-16-03 CC-16-04 CC-16-05 CC-16-06 CC-16-07 CC-16-08 CC-16-09 CC-16-10 CC-16-11 CC-16-12 A lb umin 4.7 5.4 5.3 4.5 5.5 4.8 4.2 5.6 5.6 4.5 4.6 5.3 A lka lin e p hos ph at as e 43.7 36.4 34.7 44.2 36.5 43.8 43.8 36.8 37.3 46.3 41.0 37.7 A la nin e a min ot ra nsf era se 6.6 5.8 5.8 6.2 5.7 6.4 6.4 5.5 5.3 6.2 6.4 5.5 Am yl as e 14.8 17.6 17.9 14.8 18.5 14.9 14.5 19.7 19.5 14.5 14.4 18.1 A sp ar ta te a min ot ra nsf era se 6.0 4.7 4.8 5.9 4.5 5.4 5.9 4.4 4.5 5.8 5.5 4.7 Blo od ur ea ni trog en 5.0 5.7 5.4 5.0 4.9 5.2 4.6 4.5 4.7 5.0 4.7 6.2 To ta l c alci um 3.7 2.8 2.7 3.6 2.8 3.6 3.7 2.6 2.9 3.4 3.8 2.6 To ta l c ho les ter ol 2.9 4.3 4.5 2.8 4.1 3.0 2.8 4.1 4.0 2.5 2.7 4.3 Cr ea tin e k in as e 4.3 5.5 5.4 4.3 4.9 4.4 4.2 5.1 4.9 4.3 4.4 5.3 Ch lo ride 3.3 3.5 2.8 2.8 2.7 2.7 2.8 3.3 3.3 2.8 2.8 3.1 Cr ea tinin e 10.6 7.8 7.4 12.1 7.9 12.3 10.7 7.8 7.8 11.3 11.8 6.9 Dir ec t b ilir ub in 22.8 23.7 22.7 21.2 16.8 21.4 21.6 17.4 17.0 23.6 19.9 22.4 Ir on 3.2 4.4 3.6 3.0 4.3 3.2 3.0 4.6 4.2 3.0 2.7 3.4 Ga mm a g lu ta m yl t ra nsf era se 7.4 7.5 7.6 7.7 7.3 7.6 7.4 7.5 7.4 7.5 7.5 7.8 G lucos e 3.6 3.2 3.4 3.7 3.1 3.9 3.5 3.1 3.0 3.6 3.8 3.0 H ig h-den sit y li po pr ot ein c ho les ter ol 7.4 13.8 13.5 8.9 9.6 8.8 10.2 12.1 9.6 10.3 12.2 13.7 Po ta ssi um 2.1 2.3 2.2 2.0 2.3 1.9 2.0 2.3 2.3 2.0 1.8 2.2 Lac ta te de hy dr og en as e 37.1 38.8 38.9 36.4 39.3 36.5 36.8 40.1 39.8 37.5 35.0 40.5 Lo w-den sit y li po pr ot ein c ho les ter ol 10.2 7.8 8.8 10.8 12.5 10.7 10.0 11.6 13.0 9.9 10.5 9.1 Lip as e 7.2 16.9 16.8 8.7 17.5 9.1 6.5 18.5 17.0 6.2 10.0 17.2 M ag nesi um 4.2 3.9 3.8 6.4 4.2 6.1 4.0 4.4 3.6 4.0 3.8 3.7 So di um 1.3 1.4 1.6 1.4 1.6 1.4 1.6 1.5 1.5 1.4 1.2 1.6 Ph osp ho ru s 4.6 2.5 2.3 4.6 2.9 4.4 4.5 2.3 2.4 5.1 2.5 2.9 To ta l p ro tein 3.3 3.6 3.7 2.9 3.7 3.4 3.1 3.5 3.6 3.2 3.2 3.6 To ta l b ilir ub in 13.2 7.3 7.2 11.2 7.2 11.3 13.4 7.1 7.2 12.6 12.2 7.0 To ta l ir on b in din g c ap aci ty 3.8 5.0 5.2 3.2 4.9 3.5 3.5 4.5 4.4 3.5 3.5 3.9 Tr ig ly cer ide 4.3 5.7 5.7 4.3 5.2 4.3 4.2 5.2 5.3 4.3 4.2 5.6 U ric acid 5.0 3.7 3.8 4.2 4.5 4.3 4.3 4.4 4.4 5.0 3.7 4.3
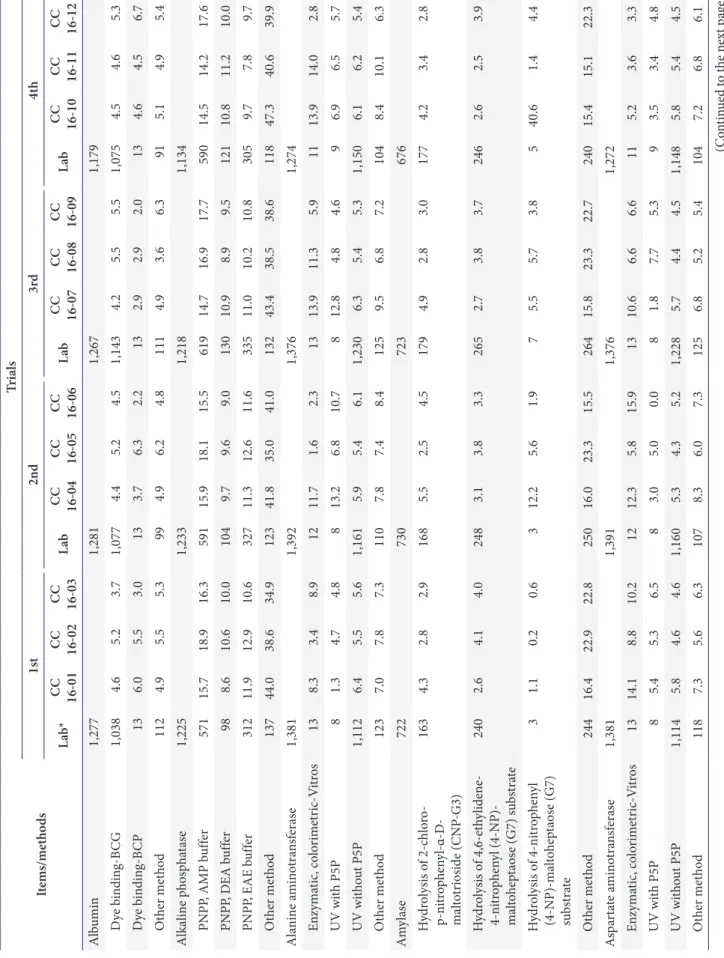
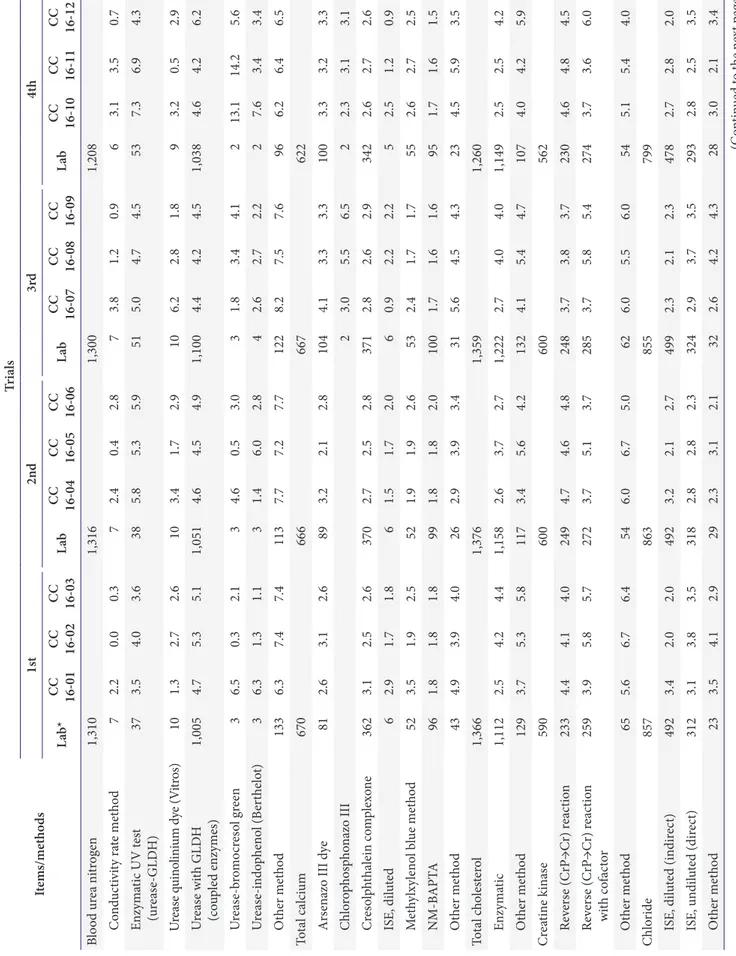
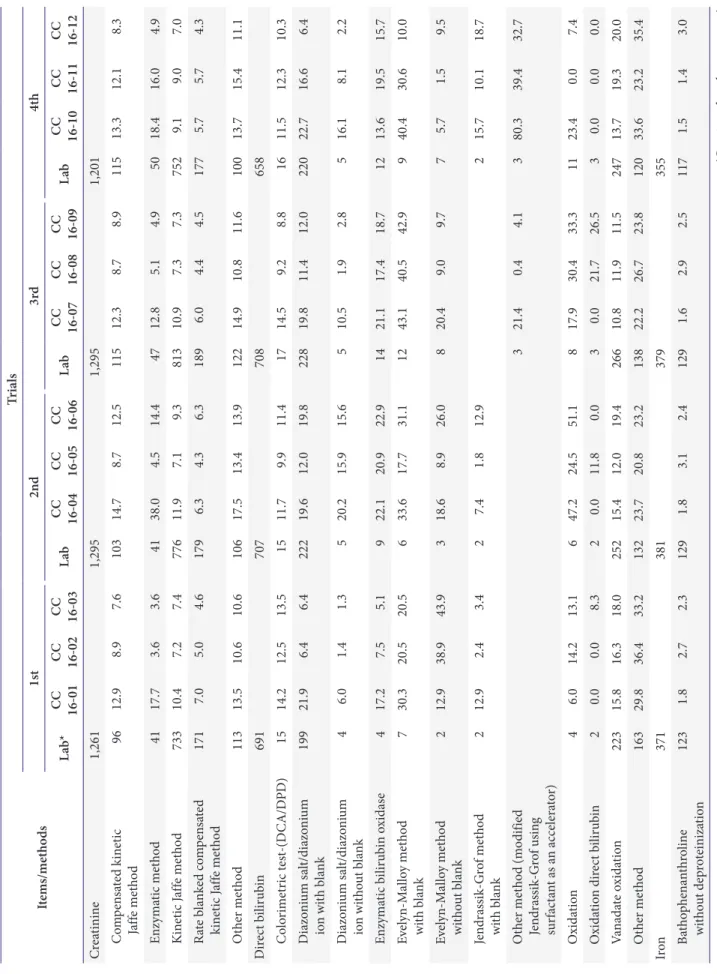
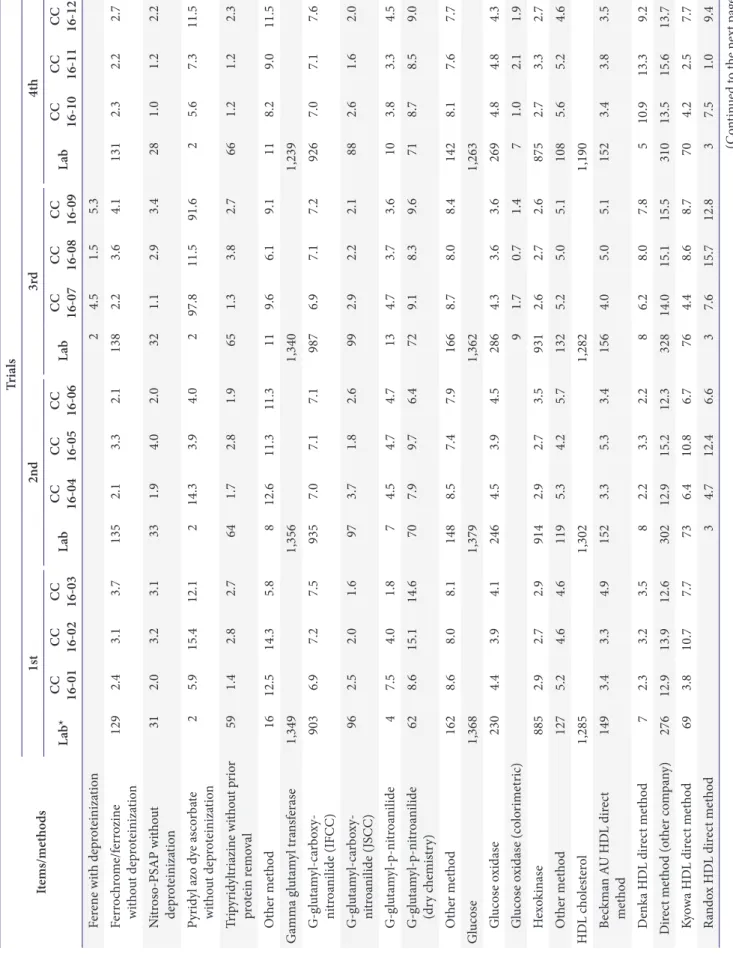
Ta bl e 4. Di str ib ut io n o f a na lyt ic al m et ho ds (p rin ci ple) p ar tici pa te d a nd co ef ficien ts o f va ria tio n (%) acco rdin g t o t he p rin ci ple in 2016 Ite m s/metho ds
Tri als 1st 2nd 3rd 4th Lab *
CC 16-01 CC 16-02 CC 16-03
Lab
CC 16-04 CC 16-05 CC 16-06
Lab
CC 16-07 CC 16-08 CC 16-09
Lab
CC 16-10 CC 16-11 CC 16-12
A lb umin 1,277 1,281 1,267 1,179 D ye b in din g-B CG 1,038 4.6 5.2 3.7 1,077 4.4 5.2 4.5 1,143 4.2 5.5 5.5 1,075 4.5 4.6 5.3 D ye b in din g-B CP 13 6.0 5.5 3.0 13 3.7 6.3 2.2 13 2.9 2.9 2.0 13 4.6 4.5 6.7 O the r me tho d 112 4.9 5.5 5.3 99 4.9 6.2 4.8 111 4.9 3.6 6.3 91 5.1 4.9 5.4 A lka lin e p hos ph at as e 1,225 1,233 1,218 1,134 P NP P, AMP b uf fer 571 15.7 18.9 16.3 591 15.9 18.1 15.5 619 14.7 16.9 17.7 590 14.5 14.2 17.6 P NP P, D EA b uf fer 98 8.6 10.6 10.0 104 9.7 9.6 9.0 130 10.9 8.9 9.5 121 10.8 11.2 10.0 P NP P, EAE b uf fer 312 11.9 12.9 10.6 327 11.3 12.6 11.6 335 11.0 10.2 10.8 305 9.7 7.8 9.7 O the r me tho d 137 44.0 38.6 34.9 123 41.8 35.0 41.0 132 43.4 38.5 38.6 118 47.3 40.6 39.9 A la nin e a min ot ra nsf era se 1,381 1,392 1,376 1,274 Enzy m at ic, co lo rim et ric-V itr os 13 8.3 3.4 8.9 12 11.7 1.6 2.3 13 13.9 11.3 5.9 11 13.9 14.0 2.8 UV w ith P5P 8 1.3 4.7 4.8 8 13.2 6.8 10.7 8 12.8 4.8 4.6 9 6.9 6.5 5.7 UV w ith ou t P5P 1,112 6.4 5.5 5.6 1,161 5.9 5.4 6.1 1,230 6.3 5.4 5.3 1,150 6.1 6.2 5.4 O the r me tho d 123 7.0 7.8 7.3 110 7.8 7.4 8.4 125 9.5 6.8 7.2 104 8.4 10.1 6.3 Am yl as e 722 730 723 676 H ydr ol ysi s o f 2-c hlo ro- p-ni tro ph en yl-α-D- m al to tr ioside (CNP -G3)
163 4.3 2.8 2.9 168 5.5 2.5 4.5 179 4.9 2.8 3.0 177 4.2 3.4 2.8 H ydr ol ysi s o f 4,6-et hy liden e- 4-ni tro ph en yl (4-NP)- m al to hep taos e (G7) s ubs tra te
240 2.6 4.1 4.0 248 3.1 3.8 3.3 265 2.7 3.8 3.7 246 2.6 2.5 3.9 H ydr ol ysi s o f 4-ni tro ph en yl (4-NP)-m al to hep taos e (G7) su bst ra te
3 1.1 0.2 0.6 3 12.2 5.6 1.9 7 5.5 5.7 3.8 5 40.6 1.4 4.4 O the r me tho d 244 16.4 22.9 22.8 250 16.0 23.3 15.5 264 15.8 23.3 22.7 240 15.4 15.1 22.3 A sp ar ta te a min ot ra nsf era se 1,381 1,391 1,376 1,272 Enzy m at ic, co lo rim et ric-V itr os 13 14.1 8.8 10.2 12 12.3 5.8 15.9 13 10.6 6.6 6.6 11 5.2 3.6 3.3 UV w ith P5P 8 5.4 5.3 6.5 8 3.0 5.0 0.0 8 1.8 7.7 5.3 9 3.5 3.4 4.8 UV w ith ou t P5P 1,114 5.8 4.6 4.6 1,160 5.3 4.3 5.2 1,228 5.7 4.4 4.5 1,148 5.8 5.4 4.5 O the r me tho d 118 7.3 5.6 6.3 107 8.3 6.0 7.3 125 6.8 5.2 5.4 104 7.2 6.8 6.1 (C on tin ue d t o t he n ext p ag e)
Ta bl e 4. C ont inu ed Ite m s/metho ds
Tri als 1st 2nd 3rd 4th Lab *
CC 16-01 CC 16-02 CC 16-03
Lab
CC 16-04 CC 16-05 CC 16-06
Lab
CC 16-07 CC 16-08 CC 16-09
Lab
CC 16-10 CC 16-11 CC 16-12
Blo od ur ea ni trog en 1,310 1,316 1,300 1,208 C on duc tiv ity ra te m et ho d 7 2.2 0.0 0.3 7 2.4 0.4 2.8 7 3.8 1.2 0.9 6 3.1 3.5 0.7 Enzy m at ic UV t es t (ur ea se-GLD H) 37 3.5 4.0 3.6 38 5.8 5.3 5.9 51 5.0 4.7 4.5 53 7.3 6.9 4.3 U re as e q uin olini um d ye (V itr os) 10 1.3 2.7 2.6 10 3.4 1.7 2.9 10 6.2 2.8 1.8 9 3.2 0.5 2.9 U re as e w ith GLD H (co up le d enzy m es) 1,005 4.7 5.3 5.1 1,051 4.6 4.5 4.9 1,100 4.4 4.2 4.5 1,038 4.6 4.2 6.2 U re as e-b ro m ocr es ol g re en 3 6.5 0.3 2.1 3 4.6 0.5 3.0 3 1.8 3.4 4.1 2 13.1 14.2 5.6 U re as e-in do ph en ol (B er th elo t) 3 6.3 1.3 1.1 3 1.4 6.0 2.8 4 2.6 2.7 2.2 2 7.6 3.4 3.4 O the r me tho d 133 6.3 7.4 7.4 113 7.7 7.2 7.7 122 8.2 7.5 7.6 96 6.2 6.4 6.5 To ta l c alci um 670 666 667 622 A rs en azo III d ye 81 2.6 3.1 2.6 89 3.2 2.1 2.8 104 4.1 3.3 3.3 100 3.3 3.2 3.3 C hlo ro ph os ph on azo III 2 3.0 5.5 6.5 2 2.3 3.1 3.1 Cr es ol ph th alein co m plex on e 362 3.1 2.5 2.6 370 2.7 2.5 2.8 371 2.8 2.6 2.9 342 2.6 2.7 2.6 IS E, di lu te d 6 2.9 1.7 1.8 6 1.5 1.7 2.0 6 0.9 2.2 2.2 5 2.5 1.2 0.9 M et hy lxy len ol b lue m et ho d 52 3.5 1.9 2.5 52 1.9 1.9 2.6 53 2.4 1.7 1.7 55 2.6 2.7 2.5 NM-B APT A 96 1.8 1.8 1.8 99 1.8 1.8 2.0 100 1.7 1.6 1.6 95 1.7 1.6 1.5 O the r me tho d 43 4.9 3.9 4.0 26 2.9 3.9 3.4 31 5.6 4.5 4.3 23 4.5 5.9 3.5 To ta l c ho les ter ol 1,366 1,376 1,359 1,260 Enzy m at ic 1,112 2.5 4.2 4.4 1,158 2.6 3.7 2.7 1,222 2.7 4.0 4.0 1,149 2.5 2.5 4.2 O the r me tho d 129 3.7 5.3 5.8 117 3.4 5.6 4.2 132 4.1 5.4 4.7 107 4.0 4.2 5.9 Cr ea tin e k in as e 590 600 600 562 R ev er se (CrP→Cr) r eac tio n 233 4.4 4.1 4.0 249 4.7 4.6 4.8 248 3.7 3.8 3.7 230 4.6 4.8 4.5 R ev er se (CrP→Cr) r eac tio n w ith co fac to r 259 3.9 5.8 5.7 272 3.7 5.1 3.7 285 3.7 5.8 5.4 274 3.7 3.6 6.0 O the r me tho d 65 5.6 6.7 6.4 54 6.0 6.7 5.0 62 6.0 5.5 6.0 54 5.1 5.4 4.0 Ch lo ride 857 863 855 799 IS E, di lu te d (in dir ec t) 492 3.4 2.0 2.0 492 3.2 2.1 2.7 499 2.3 2.1 2.3 478 2.7 2.8 2.0 IS E, un di lu te d (dir ec t) 312 3.1 3.8 3.5 318 2.8 2.8 2.3 324 2.9 3.7 3.5 293 2.8 2.5 3.5 O the r me tho d 23 3.5 4.1 2.9 29 2.3 3.1 2.1 32 2.6 4.2 4.3 28 3.0 2.1 3.4 (C on tin ue d t o t he n ext p ag e)
Table 4. C ont inu ed Ite m s/metho ds
Tri als 1st 2nd 3rd 4th Lab *
CC 16-01 CC 16-02 CC 16-03
Lab
CC 16-04 CC 16-05 CC 16-06
Lab
CC 16-07 CC 16-08 CC 16-09
Lab
CC 16-10 CC 16-11 CC 16-12
Cr ea tinin e 1,261 1,295 1,295 1,201 C om pen sa te d k in et ic J af fe m et ho d 96 12.9 8.9 7.6 103 14.7 8.7 12.5 115 12.3 8.7 8.9 115 13.3 12.1 8.3 Enzy m at ic m et ho d 41 17.7 3.6 3.6 41 38.0 4.5 14.4 47 12.8 5.1 4.9 50 18.4 16.0 4.9 K in et ic J af fe m et ho d 733 10.4 7.2 7.4 776 11.9 7.1 9.3 813 10.9 7.3 7.3 752 9.1 9.0 7.0 R at e b la nk ed co m pen sa te d k in et ic J af fe m et ho d 171 7.0 5.0 4.6 179 6.3 4.3 6.3 189 6.0 4.4 4.5 177 5.7 5.7 4.3 O the r me tho d 113 13.5 10.6 10.6 106 17.5 13.4 13.9 122 14.9 10.8 11.6 100 13.7 15.4 11.1 Dir ec t b ilir ub in 691 707 708 658 C olo rim et ric t es t-(D CA/D PD) 15 14.2 12.5 13.5 15 11.7 9.9 11.4 17 14.5 9.2 8.8 16 11.5 12.3 10.3 Di azo ni um s al t/di azo ni um io n w ith b la nk 199 21.9 6.4 6.4 222 19.6 12.0 19.8 228 19.8 11.4 12.0 220 22.7 16.6 6.4 Di azo ni um s al t/di azo ni um i on w ith out b la nk 4 6.0 1.4 1.3 5 20.2 15.9 15.6 5 10.5 1.9 2.8 5 16.1 8.1 2.2 Enzy m at ic b ilir ub in o xid as e 4 17.2 7.5 5.1 9 22.1 20.9 22.9 14 21.1 17.4 18.7 12 13.6 19.5 15.7 E ve ly n-M al lo y m et ho d wi th b la nk 7 30.3 20.5 20.5 6 33.6 17.7 31.1 12 43.1 40.5 42.9 9 40.4 30.6 10.0 E ve ly n-M al lo y m et ho d w ith out b la nk 2 12.9 38.9 43.9 3 18.6 8.9 26.0 8 20.4 9.0 9.7 7 5.7 1.5 9.5 J en dra ssi k-G ro f m et ho d wi th b la nk 2 12.9 2.4 3.4 2 7.4 1.8 12.9 2 15.7 10.1 18.7 O th er m et ho d (m odif ie d J en dra ssi k-G ro f u sin g s ur fac ta nt a s a n acce lera to r)
3 21.4 0.4 4.1 3 80.3 39.4 32.7 O xid at io n 4 6.0 14.2 13.1 6 47.2 24.5 51.1 8 17.9 30.4 33.3 11 23.4 0.0 7.4 O xid at io n dir ec t b ilir ub in 2 0.0 0.0 8.3 2 0.0 11.8 0.0 3 0.0 21.7 26.5 3 0.0 0.0 0.0 V an ad at e o xid at io n 223 15.8 16.3 18.0 252 15.4 12.0 19.4 266 10.8 11.9 11.5 247 13.7 19.3 20.0 O the r me tho d 163 29.8 36.4 33.2 132 23.7 20.8 23.2 138 22.2 26.7 23.8 120 33.6 23.2 35.4 Ir on 371 381 379 355 B at ho ph en an thr olin e w ith ou t dep ro teiniza tio n 123 1.8 2.7 2.3 129 1.8 3.1 2.4 129 1.6 2.9 2.5 117 1.5 1.4 3.0 (C on tin ue d t o t he n ext p ag e)
Table 4. C ont inu ed Ite m s/metho ds
Tri als 1st 2nd 3rd 4th Lab *
CC 16-01 CC 16-02 CC 16-03
Lab
CC 16-04 CC 16-05 CC 16-06
Lab
CC 16-07 CC 16-08 CC 16-09
Lab
CC 16-10 CC 16-11 CC 16-12
F er en e w ith dep ro teiniza tio n 2 4.5 1.5 5.3 F er ro chr om e/f er ro zin e w ith ou t dep ro teiniza tio n 129 2.4 3.1 3.7 135 2.1 3.3 2.1 138 2.2 3.6 4.1 131 2.3 2.2 2.7 N itr os o-PSAP w ith ou t dep ro teiniza tio n 31 2.0 3.2 3.1 33 1.9 4.0 2.0 32 1.1 2.9 3.4 28 1.0 1.2 2.2 P yr id yl azo d ye a sco rb at e w ith ou t dep ro teiniza tio n 2 5.9 15.4 12.1 2 14.3 3.9 4.0 2 97.8 11.5 91.6 2 5.6 7.3 11.5 T rip yr id yl tri az in e w ith ou t p rio r p ro tein r em ova l 59 1.4 2.8 2.7 64 1.7 2.8 1.9 65 1.3 3.8 2.7 66 1.2 1.2 2.3 O the r me tho d 16 12.5 14.3 5.8 8 12.6 11.3 11.3 11 9.6 6.1 9.1 11 8.2 9.0 11.5 Ga mm a g lu ta m yl t ra nsf era se 1,349 1,356 1,340 1,239 G-g lu ta m yl-c arb oxy- ni tro ani lide (IFC C) 903 6.9 7.2 7.5 935 7.0 7.1 7.1 987 6.9 7.1 7.2 926 7.0 7.1 7.6 G-g lu ta m yl-c arb oxy- ni tro ani lide ( JSC C) 96 2.5 2.0 1.6 97 3.7 1.8 2.6 99 2.9 2.2 2.1 88 2.6 1.6 2.0 G-g lu ta m yl-p-ni tro ani lide 4 7.5 4.0 1.8 7 4.5 4.7 4.7 13 4.7 3.7 3.6 10 3.8 3.3 4.5 G-g lu ta m yl-p-ni tro ani lide (dr y c hemi str y) 62 8.6 15.1 14.6 70 7.9 9.7 6.4 72 9.1 8.3 9.6 71 8.7 8.5 9.0 O the r me tho d 162 8.6 8.0 8.1 148 8.5 7.4 7.9 166 8.7 8.0 8.4 142 8.1 7.6 7.7 G lucos e 1,368 1,379 1,362 1,263 G lucos e o xid as e 230 4.4 3.9 4.1 246 4.5 3.9 4.5 286 4.3 3.6 3.6 269 4.8 4.8 4.3 G lucos e o xid as e (co lo rim et ric) 9 1.7 0.7 1.4 7 1.0 2.1 1.9 H ex ok inas e 885 2.9 2.7 2.9 914 2.9 2.7 3.5 931 2.6 2.7 2.6 875 2.7 3.3 2.7 O the r me tho d 127 5.2 4.6 4.6 119 5.3 4.2 5.7 132 5.2 5.0 5.1 108 5.6 5.2 4.6 HD L c ho les ter ol 1,285 1,302 1,282 1,190 B ec km an A U HD L dir ec t me tho d 149 3.4 3.3 4.9 152 3.3 5.3 3.4 156 4.0 5.0 5.1 152 3.4 3.8 3.5 D en ka HD L dir ec t m et ho d 7 2.3 3.2 3.5 8 2.2 3.3 2.2 8 6.2 8.0 7.8 5 10.9 13.3 9.2 Dir ec t m et ho d (o th er co m pa ny) 276 12.9 13.9 12.6 302 12.9 15.2 12.3 328 14.0 15.1 15.5 310 13.5 15.6 13.7 K yo wa HD L dir ec t m et ho d 69 3.8 10.7 7.7 73 6.4 10.8 6.7 76 4.4 8.6 8.7 70 4.2 2.5 7.7 R an do x HD L dir ec t m et ho d 3 4.7 12.4 6.6 3 7.6 15.7 12.8 3 7.5 1.0 9.4 (C on tin ue d t o t he n ext p ag e)
Table 4. C ont inu ed Ite m s/metho ds
Tri als 1st 2nd 3rd 4th Lab *
CC 16-01 CC 16-02 CC 16-03
Lab
CC 16-04 CC 16-05 CC 16-06
Lab
CC 16-07 CC 16-08 CC 16-09
Lab
CC 16-10 CC 16-11 CC 16-12
R oc he HD L dir ec t m et ho d 187 5.0 4.0 3.3 191 4.2 5.8 4.5 202 5.7 6.0 5.9 189 3.6 5.1 3.4 S ek isui HD L dir ec t m et ho d 255 3.2 4.3 4.2 270 3.4 3.4 3.5 281 3.0 3.3 4.7 263 3.5 3.4 3.0 S iem en s AD VI A dir ec t HD L me tho d 36 2.7 3.1 0.0 37 3.0 3.3 3.2 39 2.2 6.0 4.1 38 2.9 2.4 2.6 S iem en s HD L dir ec t m et ho d 3 12.1 6.1 1.9 3 2.2 3.6 2.2 3 2.0 2.9 2.9 5 6.1 5.9 18.8 W ak o HD L dir ec t m et ho d 55 6.1 6.2 5.8 55 5.3 7.8 5.8 51 5.8 4.3 7.5 48 4.1 7.9 5.3 O the r me tho d 126 11.5 12.9 13.1 104 11.7 9.5 11.4 122 12.0 13.8 12.0 96 11.7 13.4 13.9 Po ta ssi um 870 877 869 811 IS E, di lu te d (in dir ec t) 495 1.9 1.5 1.4 495 1.9 1.8 1.8 503 1.9 1.7 1.8 482 1.9 1.7 1.8 IS E, un di lu te d (dir ec t) 321 2.2 2.7 2.7 328 2.1 2.4 2.1 334 2.0 2.7 2.8 301 2.1 1.9 2.5 O the r me tho d 23 2.4 2.4 1.8 29 4.4 3.1 2.4 32 2.9 4.6 3.6 28 3.4 2.5 2.9 Lac ta te de hy dr og en as e 831 834 821 764 Dini tro ph en yl h ydrazin e 2 3.9 3.5 4.1 2 3.4 0.4 3.8 3 1.6 76.8 77.0 L ac ta te t o p yr uva te 358 5.7 5.3 5.5 386 5.6 5.7 5.7 383 5.5 5.5 5.6 362 5.4 4.9 5.3 P yr uva te t o l ac ta te 323 5.8 5.9 6.0 336 6.0 6.3 6.0 359 5.4 5.6 5.8 343 5.7 6.1 6.2 P yr uva te t o l ac ta te (dr y c hemi str y) 6 2.8 1.4 1.8 6 8.5 4.0 5.8 6 4.0 2.9 3.3 5 8.2 6.8 3.4 O the r me tho d 94 35.0 37.2 35.9 65 35.0 38.0 35.6 68 34.8 38.4 36.4 54 35.4 33.5 38.6 LD L c ho les ter ol 837 843 828 770 B ec km an A U LD L dir ec t me tho d 100 7.8 7.7 7.7 99 7.0 7.4 7.3 101 7.5 8.0 8.0 102 5.9 5.5 5.1 D en ka LD L dir ec t m et ho d 2 19.8 19.1 14.4 2 16.6 30.9 16.4 2 5.6 19.9 24.0 Dir ec t m et ho d (o th er co m pa ny) 127 10.8 11.0 13.0 134 10.3 12.1 10.6 146 10.9 13.5 14.5 138 10.6 11.9 11.9 K yo wa LD L dir ec t m et ho d 62 2.4 3.4 3.1 68 3.1 3.9 3.0 67 2.6 3.1 3.1 62 2.4 2.5 2.7 R an do x LD L dir ec t m et ho d 2 4.0 9.0 2.1 2 13.4 1.3 0.0 2 0.5 1.4 2.4 R oc he LD L dir ec t m et ho d 150 4.6 3.7 4.2 152 3.4 3.6 3.5 161 3.1 3.2 3.8 152 2.9 4.2 3.3 S ek isui LD L dir ec t m et ho d 180 3.0 3.3 3.6 188 2.8 3.0 2.5 198 2.9 3.7 3.1 181 2.4 2.9 3.5 S iem en s AD VI A dir ec t LD L m et ho d 36 4.1 2.9 4.0 37 3.3 3.1 2.3 38 2.5 4.2 4.1 38 2.8 2.9 3.2 (C on tin ue d t o t he n ext p ag e)
Table 4. C ont inu ed Ite m s/metho ds
Tri als 1st 2nd 3rd 4th Lab *
CC 16-01 CC 16-02 CC 16-03
Lab
CC 16-04 CC 16-05 CC 16-06
Lab
CC 16-07 CC 16-08 CC 16-09
Lab
CC 16-10 CC 16-11 CC 16-12
S iem en s LD L dir ec t m et ho d 2 7.1 8.2 1.5 2 2.8 2.6 4.5 2 1.0 1.1 3.7 3 2.4 1.7 4.8 W ak o LD L dir ec t m et ho d 44 7.1 8.6 15.8 44 5.6 9.3 9.2 43 10.2 14.5 12.5 41 7.6 10.3 13.2 O the r me tho d 61 11.7 7.2 10.8 51 12.2 12.1 10.5 62 12.3 10.9 12.2 45 10.7 15.3 8.6 Lip as e 366 375 369 345 H ydr ol ysi s o f 1,2-O-di la ur yl- rac-g ly cer o-3-g lu ta ric acid- (6'-m et hy lres or uf in) es ter
243 7.0 14.4 13.6 252 9.1 16.1 9.7 258 6.8 12.8 10.7 241 5.9 10.3 11.1 H ydr ol ysi s o f 1-o le oy l- 2,3-di acet yl g ly cer ol 10 5.4 3.6 3.2 10 2.3 2.2 3.2 10 5.1 3.4 4.0 9 4.5 2.5 2.3 O th er enzy m at ic m et ho d 2 18.1 3.4 2.3 4 9.4 10.4 10.4 3 14.3 6.8 1.2 3 17.4 13.8 1.1 S pe ct ro ph ot om et ric m et ho d w ith t rig ly cer ide 60 4.1 3.2 3.6 62 3.1 2.5 3.8 61 3.5 2.2 2.3 62 1.7 3.5 2.5 O the r me tho d 35 11.5 17.4 16.2 34 14.9 21.5 13.4 37 11.2 23.1 21.6 30 19.3 20.2 22.3 M ag nesi um 254 260 261 244 C al m agi te 3 0.0 2.3 1.4 4 4.8 4.1 4.1 4 0.0 3.3 2.0 4 2.7 0.0 3.4 C hlo ro ph os ph on azo III 2 0.0 3.2 1.7 2 23.6 12.9 16.6 2 0.0 1.6 0.0 2 0.0 6.7 3.1 C olo rim et ric t es t-xy lid yl b lue 26 3.8 2.8 1.9 27 3.7 3.7 4.0 30 3.3 3.5 3.6 27 4.9 4.9 4.5 C olo rim et ric-V itr os c hemi str y sys tem s 4 23.6 49.1 48.1 4 5.4 3.9 5.4 5 7.1 3.5 3.0 5 0.0 2.7 3.2 C olo rim et ric (d ye-xy lid yl b lue/M ag on) 203 4.1 3.8 3.8 214 6.5 4.2 3.8 215 3.9 3.7 3.5 201 4.0 3.6 3.7 O the r me tho d 9 12.9 13.4 9.0 4 22.9 6.2 19.2 5 5.4 3.7 3.5 5 6.8 6.7 1.6 So di um 870 877 869 811 IS E, di lu te d (in dir ec t) 418 1.4 1.2 1.4 423 1.2 1.3 1.2 438 1.3 1.2 1.3 430 1.2 1.2 1.3 IS E, un di lu te d (dir ec t) 432 1.5 1.8 1.7 431 1.4 1.7 1.4 404 1.6 1.6 1.5 357 1.5 1.4 1.8 O the r me tho d 20 1.3 1.4 1.9 23 1.5 1.7 1.4 27 2.0 2.0 2.5 24 1.3 1.5 2.1 Ph osp ho ru s 622 622 617 575 P hos ph om ol yb da te w ith a ny r ed uc tio n m et ho d 6 0.0 4.1 2.5 6 1.4 1.0 0.0 9 4.9 3.0 3.6 9 5.2 4.3 4.2 P ho sph om oly bd at e, U V 538 4.5 2.5 2.3 558 4.6 2.9 4.3 576 4.4 2.2 2.3 541 5.0 2.4 2.8 O the r me tho d 51 6.8 3.2 3.6 37 6.3 4.3 8.0 29 7.6 4.0 4.2 23 5.8 6.0 5.0 (C on tin ue d t o t he n ext p ag e)
Table 4. C ont inu ed Ite m s/metho ds
Tri als 1st 2nd 3rd 4th Lab *
CC 16-01 CC 16-02 CC 16-03
Lab
CC 16-04 CC 16-05 CC 16-06
Lab
CC 16-07 CC 16-08 CC 16-09
Lab
CC 16-10 CC 16-11 CC 16-12
To ta l p ro tein 1,260 1,263 1,248 1,160 B iur et m et ho d 1,035 3.2 3.4 3.5 1,071 2.8 3.6 2.9 1,028 2.8 3.4 3.5 943 3.1 3.1 3.5 O the r me tho d 114 5.0 5.4 5.3 100 4.5 5.8 5.3 220 4.4 4.6 5.0 217 3.6 3.6 4.6 To ta l b ilir ub in 1,276 1,282 1,271 1,175 B enzen es ulf onic acid di azo r eac tio n 2 4.7 0.1 6.2 3 6.8 7.0 6.9 3 13.3 4.7 4.8 C olo rim et ric t es t-(D CA/D PD) 31 7.0 8.1 8.0 32 8.6 7.7 8.6 33 12.4 9.4 7.7 30 12.4 7.7 8.5 Di azo-dim et hy l s ulf oxide wi th b la nk 71 13.8 8.5 9.9 73 10.1 9.4 12.6 82 11.9 11.1 11.2 75 14.4 14.1 11.4 Di azo ni um s al t/di azo ni um io n w ith b la nk 339 13.3 5.8 5.7 347 11.1 5.7 11.0 361 13.8 5.5 5.5 342 12.4 12.1 5.7 Di azo ni um s al t/di azo ni um i on w ith out b la nk 26 11.6 8.6 8.9 25 6.1 7.6 12.0 25 6.8 8.8 8.0 21 15.5 12.4 8.1 Di azo ni um s al t-d yp hy llin e (V itr os) 13 11.9 10.4 12.6 12 8.4 11.9 9.0 12 9.2 8.0 5.4 10 6.6 13.1 6.5 Enzy m at ic b ilir ub in o xid as e 22 12.0 6.1 5.8 25 10.5 6.8 10.2 24 8.2 5.0 4.5 25 9.5 9.3 5.2 E ve ly n-M al lo y m et ho d wi th b la nk 4 5.1 5.8 4.3 4 0.0 3.7 0.0 20 8.9 11.9 10.4 21 10.3 10.1 10.0 E ve ly n-M al lo y m et ho d w ith out b la nk 43 16.7 8.7 10.8 55 18.3 12.8 17.3 66 23.2 10.0 9.8 63 19.6 12.0 9.9 J en dra ssi k-G ro f m et ho d wi th b la nk 7 18.4 5.2 5.5 6 15.7 13.6 14.6 7 9.0 6.6 7.2 6 10.6 10.9 5.5 O xid at io n 74 7.8 5.7 4.5 79 10.2 5.2 9.9 81 12.5 8.1 8.0 77 12.1 11.3 7.7 V an ad at e o xid at io n 418 6.4 5.9 5.9 428 7.3 6.2 7.2 441 7.6 6.1 5.9 412 7.1 6.9 6.2 O the r me tho d 115 17.1 13.0 12.9 102 12.5 8.9 14.4 113 18.9 10.9 11.6 88 14.9 16.5 10.2 To ta l ir on b in din g c ap aci ty 333 348 348 326 B at ho ph en an thr olin e 92 2.4 3.8 3.8 106 2.1 4.4 2.6 111 2.5 3.9 3.5 102 2.5 2.3 3.5 C hr om azur ol B 21 3.2 3.1 3.4 22 2.4 3.1 2.4 23 2.7 2.3 2.5 23 2.0 2.3 1.7 F er ro chr om e/f er ro zin e 84 2.6 5.2 5.0 90 2.6 5.2 2.9 95 2.7 4.6 4.6 90 2.9 3.0 4.8 N itr os o-PSAP 74 2.8 3.2 3.1 83 2.1 2.5 2.3 84 1.9 2.3 2.3 80 1.4 2.1 2.3 O the r me tho d 44 5.0 12.4 10.6 34 3.9 7.9 4.8 35 5.3 7.5 6.1 31 3.6 3.0 4.8 (C on tin ue d t o t he n ext p ag e)
Table 4. C ont inu ed Ite m s/metho ds
Tri als 1st 2nd 3rd 4th Lab *
CC 16-01 CC 16-02 CC 16-03
Lab
CC 16-04 CC 16-05 CC 16-06
Lab
CC 16-07 CC 16-08 CC 16-09
Lab
CC 16-10 CC 16-11 CC 16-12
Tr ig ly cer ide 1,346 1,359 1,339 1,242 Enzy m at ic (g ly cer ol p hos ph at e o xid as e) w ith g ly cer ol b la nk 431 4.2 4.3 4.1 454 4.2 4.3 4.3 452 3.9 4.0 3.9 414 3.7 3.2 3.7 Enzy m at ic (g ly cer ol p hos ph at e o xid as e) w ith ou t g ly cer ol b lan k
667 3.8 5.5 5.8 696 4.0 5.4 3.9 758 4.1 5.9 5.6 723 4.5 4.3 5.8 O the r me tho d 129 6.9 8.4 8.1 111 5.2 6.1 5.5 127 5.9 6.7 6.4 103 4.9 4.8 7.4 U ric acid 1,098 1,105 1,092 1,020 Ur ic as e 910 4.3 3.6 3.7 945 4.1 4.3 4.2 992 4.2 4.3 4.3 940 4.8 3.6 4.1 U ric as e (V itr os) 8 3.4 3.8 3.8 8 4.0 0.9 2.1 9 5.6 2.7 1.7 7 3.2 1.8 1.7 O the r me tho d 97 5.8 5.7 5.8 84 7.4 5.7 6.4 91 6.5 5.3 5.2 73 7.3 7.0 6.2 A bb re vi at io ns: B C G, b ro m ocr es ol g re en; B CP , b ro m ocr es ol p ur ple; P NP P, p ara ni tr op hen yl ph os ph at e; AMP , 2-a min o-2-m et hy l-1-p ro pa no l; D EA, diet ha no la min e; EAE, 2-et hy la min oet ha no l; UV , u ltra v io let; P5P , p yr ido xa l-5-p hos ph at e; GLD H, g lu ta m at e de hy dr og en as e; IS E, io n-s ele ct iv e e le ct ro des; CrP , cr ea tin e p hos ph at e; Cr , cr ea tin e; D CA, dic hlo ro ani lin e; D PD , 2,5-dic hlo ro ph en yl di azo ni um; ni tros o-PSAP , 2-ni tros o-5-(N-p ro py l-N-s ulf op ro py la min o)-p hen ol; IFC C, I nt er na tio na l F edera tio n o f C linic al C hemi str y; JSC C, J ap an es e S ociet y f or C linic al C hemi str y; HD L, hig h-den sit y li po pr ot ein; LD L, lo w-den sit y li po pr ot ein. *N o. o f l ab ora to ries t ha t p ar tici pa te d in t he K or ea n E xt er na l Q ua lit y A ss es sm en t S er vice 2016.
적 위치를 나타내는 SDI와도 관련되므로 변이계수가 큰 경우 SDI는 상대적으로 작아질 수 있으므로 결과해석 시 고려되어 야 한다.
2016년 일반화학검사 프로그램의 신빙도조사 결과에 대해 보다 자세한 통계분석결과는 대한임상검사정도관리협회 신빙 도조사사업 홈페이지(http://eqas.keqas.org)에서 조회가 가능 하다.
각 기관의 신빙도조사 결과에 대한 해석과 검사법 선택 시 본 통계분석자료가 유용할 것으로 생각된다.
REFERENCES
1. Jun SH, Song J, Song WH; Clinical Chemistry Sub- committee, Korean Association of External Quality As-
sessment Service. Annual report on the external quality assessment scheme for clinical chemistry in Korea (2015).
J Lab Med Qual Assur 2016;38:111-9.
2. Jun SH, Song J; Clinical Chemistry Subcommittee, The Korean Association of External Quality Assessment Service. Annual report on the external quality assessment scheme for clinical chemistry in Korea (2014). J Lab Med Qual Assur 2015;37:115-23.
3. Jun SH, Song J; Clinical Chemistry Subcommittee; The Korean Association of Quality Assurance for Clinical Laboratory. Annual report on the external quality assessment scheme in clinical chemistry in Korea (2013).
J Lab Med Qual Assur 2014;36:113-21.
일반화학검사 프로그램 신빙도조사 결과보고(2016)
이용화
1
• 전병열1
• 김정권1
• 전선희2
• 윤여민3
• 전사일4
• 송정한2
• 민원기4
1